Back
Poster Session B
Systemic lupus erythematosus (SLE)
Session: (0629–0670) SLE – Etiology and Pathogenesis Poster
0632: Single-cell Multiomic Profiling Differentiates Ancestral B Cell Pathologies Contributing to Lupus Disease Activity
Sunday, November 13, 2022
9:00 AM – 10:30 AM Eastern Time
Location: Virtual Poster Hall
- KT
Kevin Thomas, BSc
Oklahoma Medical Research Foundation
Oklahoma City, OK, United States
Abstract Poster Presenter(s)
Kevin Thomas, Miles Smith, Samantha Slight-Webb, Susan Macwana, Joseph Kheir, Carla J. Guthridge, Wade deJager, Christian Wright, Bolanle Adebayo, Judith James and Joel Guthridge, Oklahoma Medical Research Foundation, Oklahoma City, OK
Background/Purpose: Genetic ancestry impacts SLE prevalence, clinical presentation, and treatment response; however, the molecular underpinnings of this disparity remain poorly understood. Recent findings demonstrate that B cell signatures are uniquely perturbed in SLE patients with African ancestry (AA) compared to those with European ancestry (EA). This study used single-cell multiomic profiling to characterize the B cell compartment in SLE patients and controls across EA and AA and different disease activities.
Methods: PBMCs were isolated from matched EA (n=8) and AA (n=8) healthy controls, EA (n=7) and AA (n=8) inactive SLE patients (SLEDAI < 4), and EA (n=8) and AA (n=7) active SLE patients (SLEDAI ≥ 4). Following T cell depletion, cellular indexing of transcriptomes and epitopes by sequencing (CITE-seq) was performed using 10X Genomics 3' single-cell RNA-sequencing kits and a 51-plex custom surface marker panel.
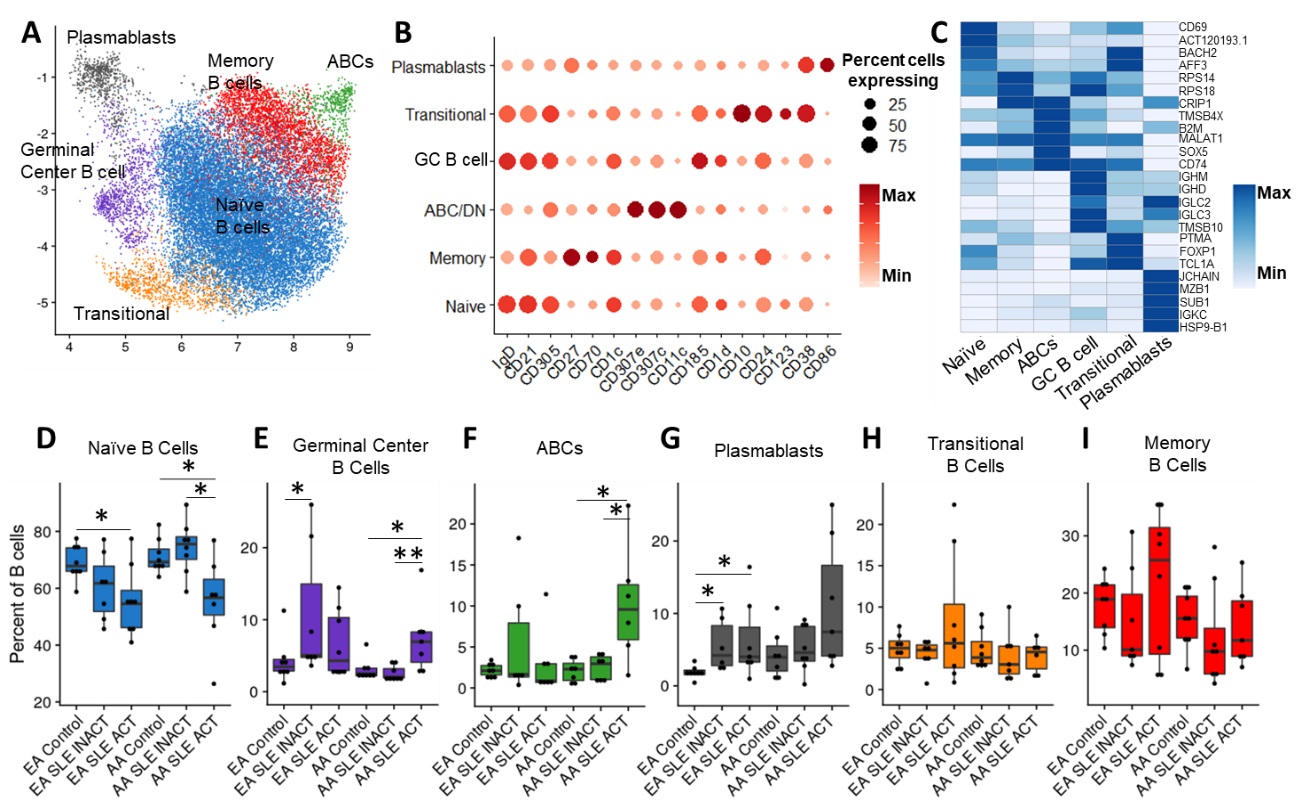
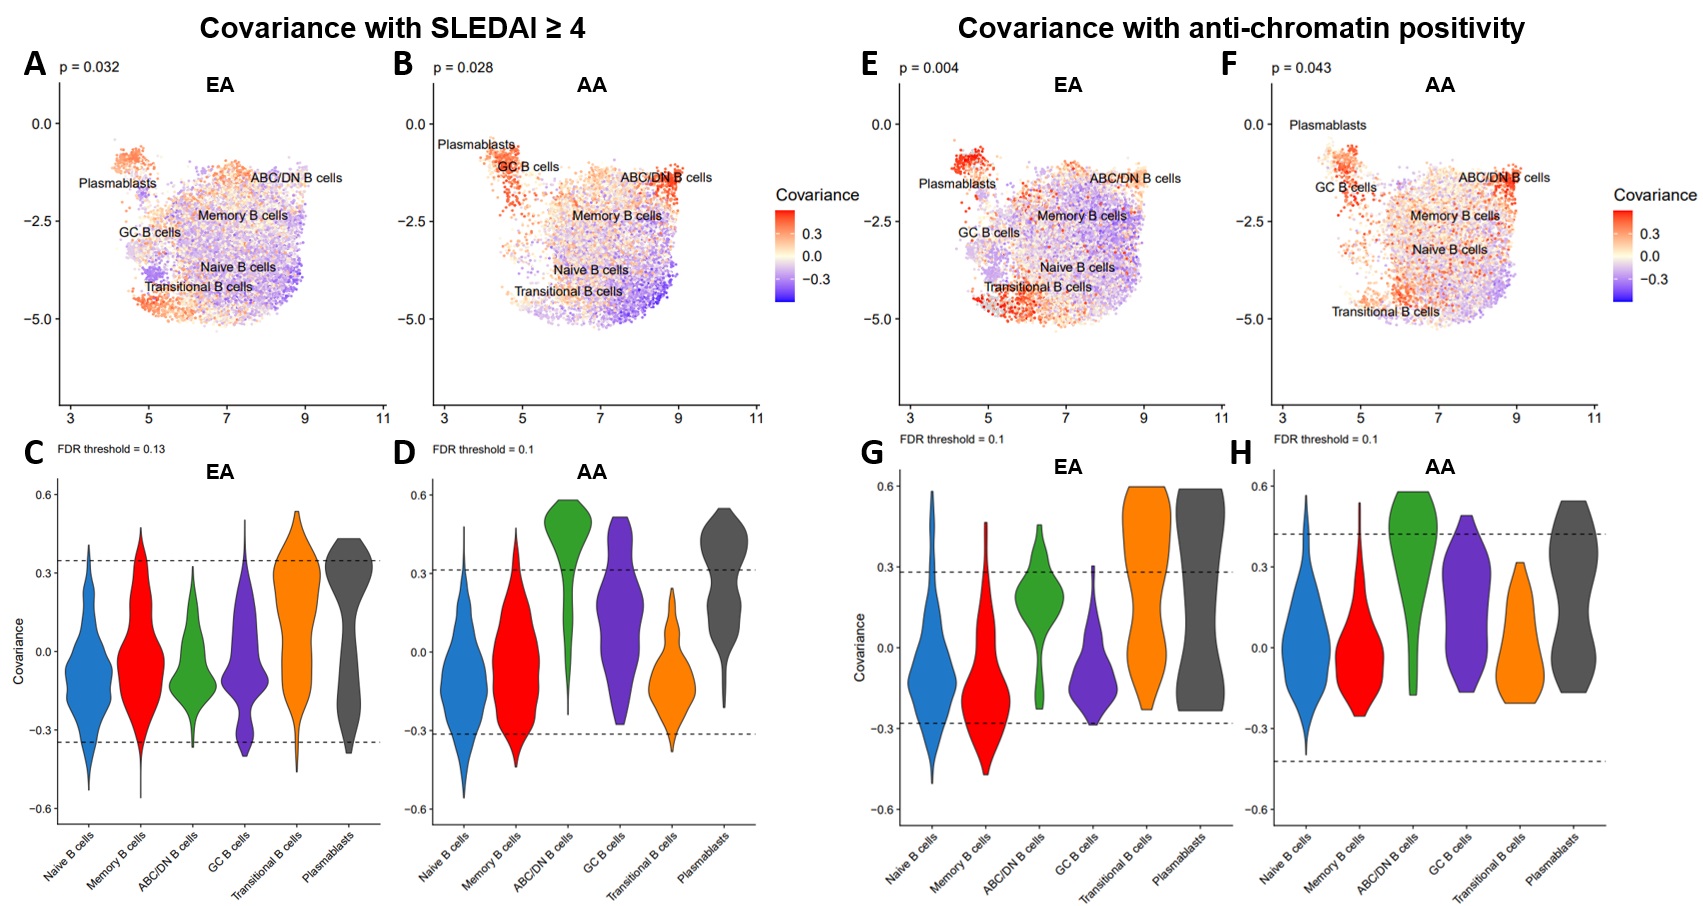
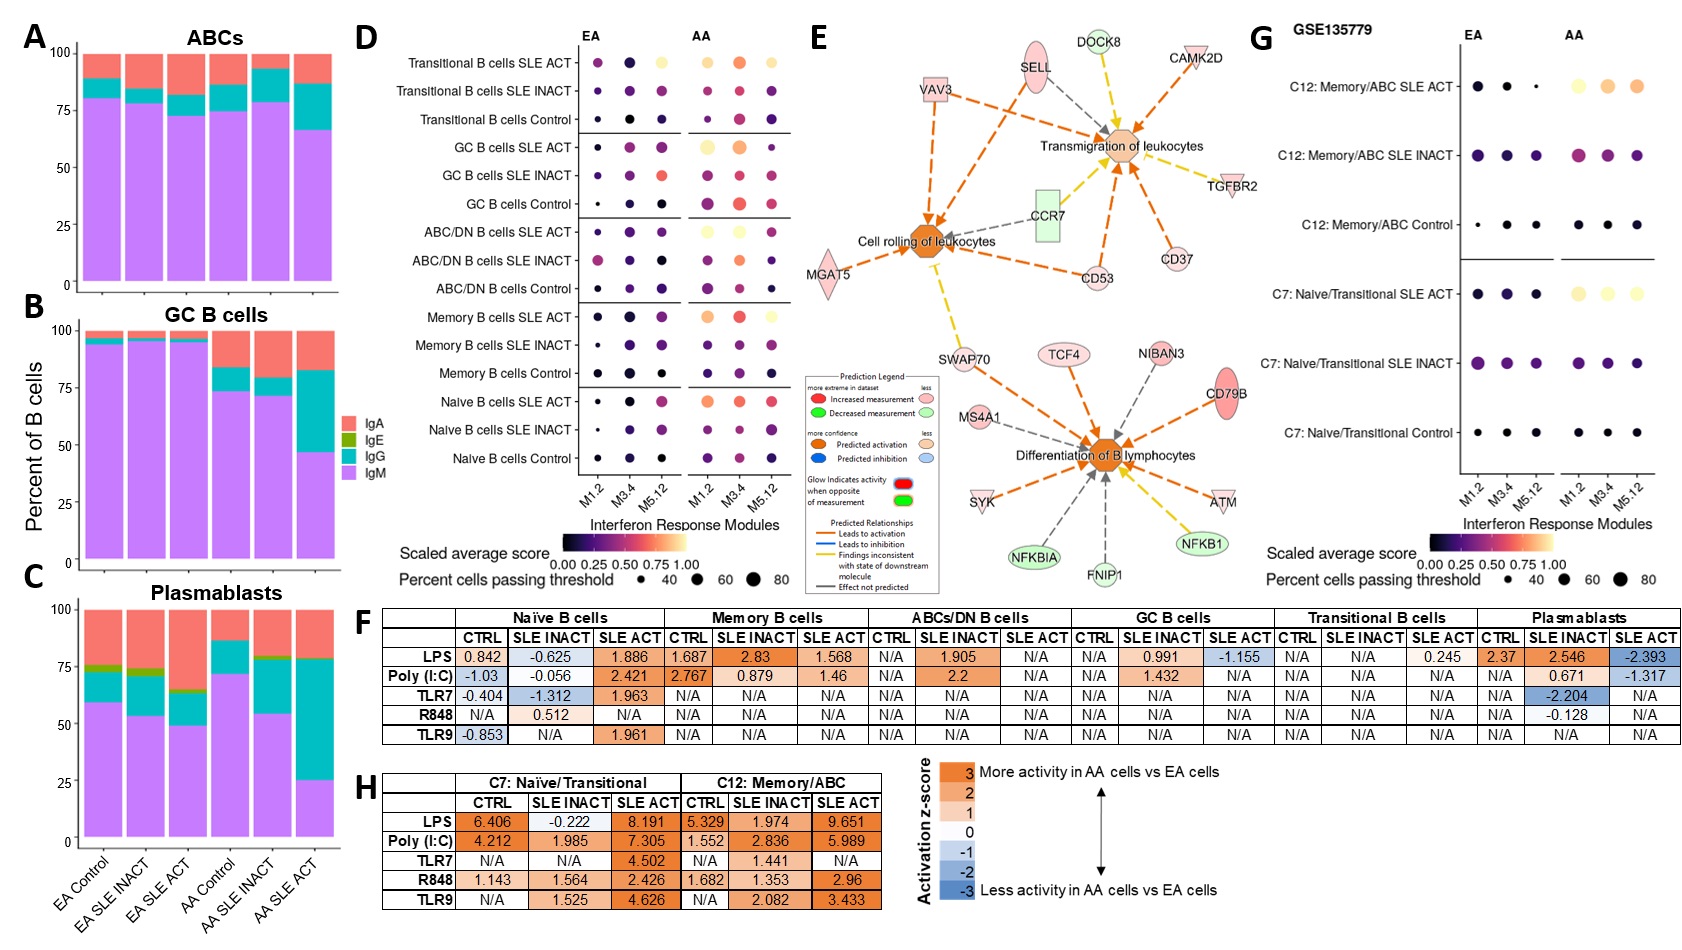
Results: We identified 6 B cell clusters via integrated multimodal analysis of 22,574 B-lineage cells (Figure 1A-C). In both EA and AA, naïve B cells were reduced in active SLE patients, while a cluster of CD185hi germinal center B cells was increased in SLE patients regardless of disease activity (Figure 1D-E). In contrast, pathogenic age-related B cells (ABCs) were only elevated in AA active SLE patients (Figure 1F), while plasmablasts were significantly elevated in active and inactive EA SLE patients, with a trend towards an increase in active AA SLE patients (Figure 1G). No significant differences were observed in transitional or memory B cells (Figure H-I). The associations of SLEDAI with plasmablasts in both AA and EA and ABCs and transitional B cells in AA and EA, respectively, were confirmed using covarying neighborhood analysis (Figure 2A-D). In addition, these populations were associated with RNP-A and chromatin autoantibody positivity in EA and AA SLE patients (Figure 2E-H). Furthermore, IgG class switching and IFN response gene signatures were elevated in ABCs, GC B cells, and plasmablasts of AA active SLE patients (Figure 3A-D) , while migration and differentiation gene pathways were increased in naïve B cells of both EA and AA SLE patients (Figure 3E). Cells from AA active SLE patients also demonstrated higher activity of genes downstream of Toll-like receptors (TLRs) and their ligands (Figure 3F). These transcriptional changes were confirmed in an independent analysis (Figure 3G-H).
Conclusion: The molecular pathology of B cells in SLE differs between EA and AA. Naïve B cells, while reduced in active SLE, undergo migration and development into more advanced subsets across both ancestries. However, the B cell compartment was further dysregulated in AA active SLE patients, including ABC expansion, IgG class-switching, elevated IFN response signature, and downstream TLR activation, which may contribute to differences in SLE clinical presentation and treatment responses in EA and AA patients. Additional work is needed to provide mechanistic explanations for these molecular differences.
 Figure 1. B cell compartments are differentially altered in SLE depending on both ancestry and disease activity. (A) Uniform Manifold Approximation and Projection (UMAP) of weighted nearest neighbor (WNN) integration of B cell CITE-seq data. Clusters determined by Leiden clustering on the WNN graph were defined by expression of marker surface proteins (B) and marker genes (C). Dot plots of the proportion of total B cells for each patient group consisting of Naïve B cells (D), GC B cells (E), ABCs (F), Plasmablasts (G), Transitional B cells (H), and Memory B cells (I). Comparisons were performed by Mann-Whitney test with Benjamini-Hochberg correction for multiple comparisons. *p < 0.05, and **p < 0.01.
 Figure 2. B cell populations linked to disease activity in EA and AA are associated with autoantibody positivity. UMAP colored by covariance of single-cell neighborhoods with active SLE from independent analyses of EA (A) and AA (B) cells. Violin plots of active SLE covariance of single-cell neighborhoods within each of the six identified clusters in EA (C) and AA (D) cells. UMAP colored by covariance of single-cell neighborhoods with anti-chromatin positivity from independent analyses of EA (E) and AA (F) cells. Violin plots of anti-chromatin covariance of single-cell neighborhoods within each of the six identified clusters in EA (C) and AA (D) cells. P-values represent the significance of the overall covariance of B cell neighborhoods with the variable of interest. Dashed lines represent the indicated false discovery rate (FDR) threshold, beyond which neighborhood correlations are considered statistically significant.
 Figure 3. Transcriptomic analyses reveal unique perturbations of B cell populations in AA active SLE. Percentage of B cells with highest gene expression of Ig classes IgA, IgE, IgG or IgM in ABCs (A), GC B cells (B), and Plasmablasts (C). (D) Dot plot of gene expression for specific IFN response modules in each B cell subset and disease group. (E) Ingenuity pathway analysis (IPA) of differentially expressed genes (DEGs) in Naïve B cells between all active SLE and controls shows predicted activity of differentiation and migration pathways. (F) IPA of DEGs in B cell subsets between AA and EA cells in disease groups shows downstream activity of TLR and their ligands. Independent analysis of published single-cell RNA-seq data in SLE (GSE135779) showed similar patterns of IFN response (G) and downstream TLR activity (H) as our data.
Disclosures: K. Thomas, None; M. Smith, None; S. Slight-Webb, None; S. Macwana, None; J. Kheir, None; C. Guthridge, None; W. deJager, None; C. Wright, None; B. Adebayo, None; J. James, Bristol-Myers Squibb(BMS), AstraZeneca, Novartis, Progentec Biosciences; J. Guthridge, None.
Background/Purpose: Genetic ancestry impacts SLE prevalence, clinical presentation, and treatment response; however, the molecular underpinnings of this disparity remain poorly understood. Recent findings demonstrate that B cell signatures are uniquely perturbed in SLE patients with African ancestry (AA) compared to those with European ancestry (EA). This study used single-cell multiomic profiling to characterize the B cell compartment in SLE patients and controls across EA and AA and different disease activities.
Methods: PBMCs were isolated from matched EA (n=8) and AA (n=8) healthy controls, EA (n=7) and AA (n=8) inactive SLE patients (SLEDAI < 4), and EA (n=8) and AA (n=7) active SLE patients (SLEDAI ≥ 4). Following T cell depletion, cellular indexing of transcriptomes and epitopes by sequencing (CITE-seq) was performed using 10X Genomics 3' single-cell RNA-sequencing kits and a 51-plex custom surface marker panel.
Results: We identified 6 B cell clusters via integrated multimodal analysis of 22,574 B-lineage cells (Figure 1A-C). In both EA and AA, naïve B cells were reduced in active SLE patients, while a cluster of CD185hi germinal center B cells was increased in SLE patients regardless of disease activity (Figure 1D-E). In contrast, pathogenic age-related B cells (ABCs) were only elevated in AA active SLE patients (Figure 1F), while plasmablasts were significantly elevated in active and inactive EA SLE patients, with a trend towards an increase in active AA SLE patients (Figure 1G). No significant differences were observed in transitional or memory B cells (Figure H-I). The associations of SLEDAI with plasmablasts in both AA and EA and ABCs and transitional B cells in AA and EA, respectively, were confirmed using covarying neighborhood analysis (Figure 2A-D). In addition, these populations were associated with RNP-A and chromatin autoantibody positivity in EA and AA SLE patients (Figure 2E-H). Furthermore, IgG class switching and IFN response gene signatures were elevated in ABCs, GC B cells, and plasmablasts of AA active SLE patients (Figure 3A-D) , while migration and differentiation gene pathways were increased in naïve B cells of both EA and AA SLE patients (Figure 3E). Cells from AA active SLE patients also demonstrated higher activity of genes downstream of Toll-like receptors (TLRs) and their ligands (Figure 3F). These transcriptional changes were confirmed in an independent analysis (Figure 3G-H).
Conclusion: The molecular pathology of B cells in SLE differs between EA and AA. Naïve B cells, while reduced in active SLE, undergo migration and development into more advanced subsets across both ancestries. However, the B cell compartment was further dysregulated in AA active SLE patients, including ABC expansion, IgG class-switching, elevated IFN response signature, and downstream TLR activation, which may contribute to differences in SLE clinical presentation and treatment responses in EA and AA patients. Additional work is needed to provide mechanistic explanations for these molecular differences.
 Figure 1. B cell compartments are differentially altered in SLE depending on both ancestry and disease activity. (A) Uniform Manifold Approximation and Projection (UMAP) of weighted nearest neighbor (WNN) integration of B cell CITE-seq data. Clusters determined by Leiden clustering on the WNN graph were defined by expression of marker surface proteins (B) and marker genes (C). Dot plots of the proportion of total B cells for each patient group consisting of Naïve B cells (D), GC B cells (E), ABCs (F), Plasmablasts (G), Transitional B cells (H), and Memory B cells (I). Comparisons were performed by Mann-Whitney test with Benjamini-Hochberg correction for multiple comparisons. *p < 0.05, and **p < 0.01.
 Figure 2. B cell populations linked to disease activity in EA and AA are associated with autoantibody positivity. UMAP colored by covariance of single-cell neighborhoods with active SLE from independent analyses of EA (A) and AA (B) cells. Violin plots of active SLE covariance of single-cell neighborhoods within each of the six identified clusters in EA (C) and AA (D) cells. UMAP colored by covariance of single-cell neighborhoods with anti-chromatin positivity from independent analyses of EA (E) and AA (F) cells. Violin plots of anti-chromatin covariance of single-cell neighborhoods within each of the six identified clusters in EA (C) and AA (D) cells. P-values represent the significance of the overall covariance of B cell neighborhoods with the variable of interest. Dashed lines represent the indicated false discovery rate (FDR) threshold, beyond which neighborhood correlations are considered statistically significant.
 Figure 3. Transcriptomic analyses reveal unique perturbations of B cell populations in AA active SLE. Percentage of B cells with highest gene expression of Ig classes IgA, IgE, IgG or IgM in ABCs (A), GC B cells (B), and Plasmablasts (C). (D) Dot plot of gene expression for specific IFN response modules in each B cell subset and disease group. (E) Ingenuity pathway analysis (IPA) of differentially expressed genes (DEGs) in Naïve B cells between all active SLE and controls shows predicted activity of differentiation and migration pathways. (F) IPA of DEGs in B cell subsets between AA and EA cells in disease groups shows downstream activity of TLR and their ligands. Independent analysis of published single-cell RNA-seq data in SLE (GSE135779) showed similar patterns of IFN response (G) and downstream TLR activity (H) as our data.
Disclosures: K. Thomas, None; M. Smith, None; S. Slight-Webb, None; S. Macwana, None; J. Kheir, None; C. Guthridge, None; W. deJager, None; C. Wright, None; B. Adebayo, None; J. James, Bristol-Myers Squibb(BMS), AstraZeneca, Novartis, Progentec Biosciences; J. Guthridge, None.

