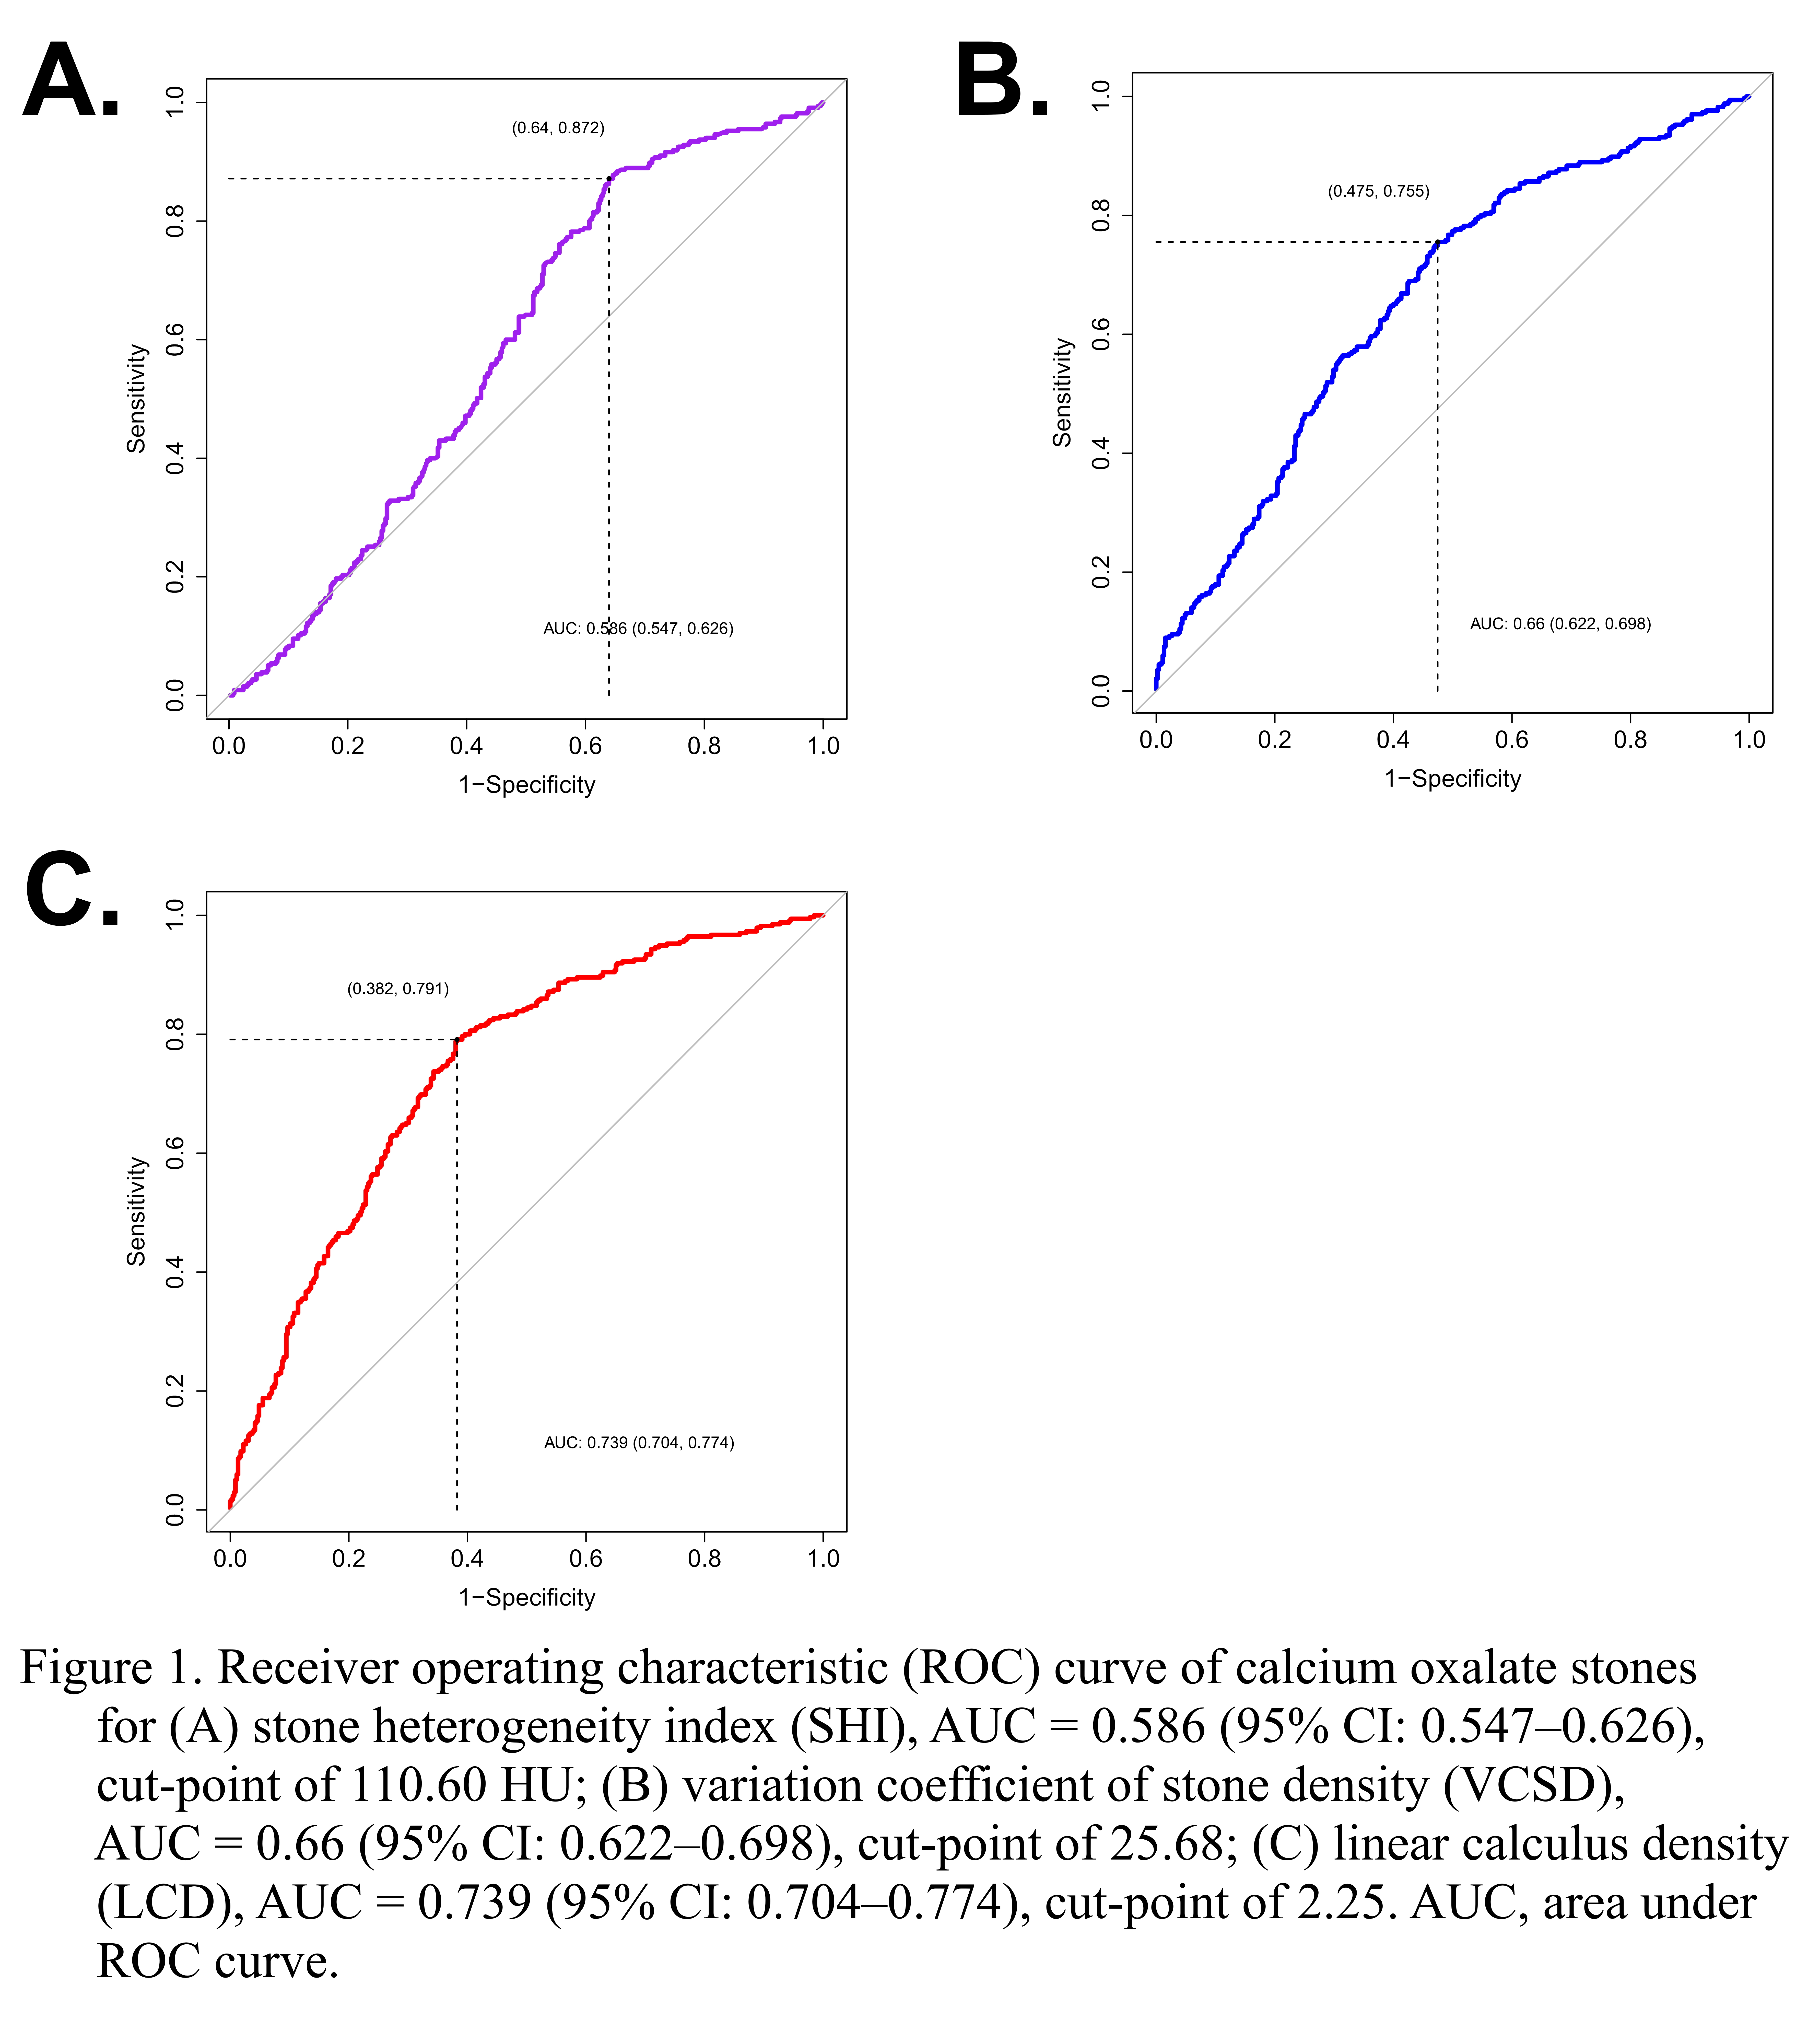
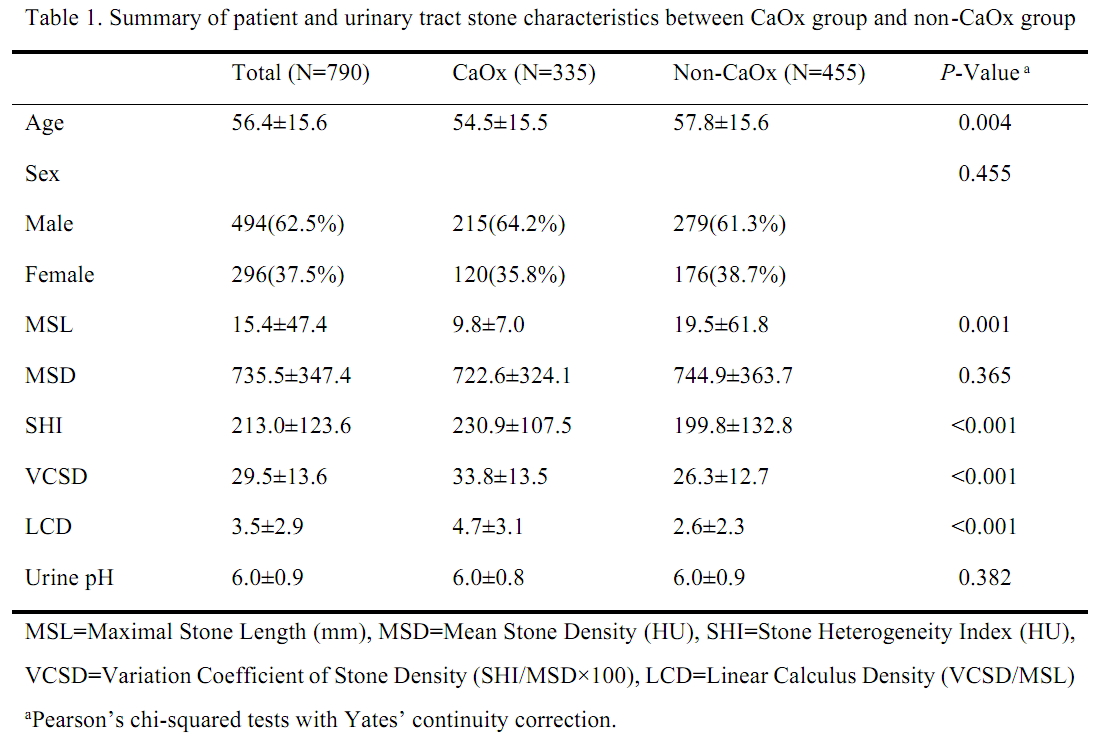
Introduction: Non-contrast computed tomography (NCCT) is widely used to evaluate urinary stones. The CT attenuation, measured in Hounsfield units (HU), has been evaluated to predict stone characteristics. We proposed a novel predictor, linear calculus density (LCD), and analyzed variables from NCCT imaging to help diagnose calcium oxalate (CaOx) stones, which are common and challenging to fragment. Methods: We retrospectively reviewed medical records of patients who had stone-related procedures or whose stone spontaneously passed between Dec 2014 and Feb 2017. Among those, 790 patients were included in the study. Based on the pre-treatment NCCT, the maximal stone length (MSL), mean stone density (MSD), and stone heterogeneity index (SHI) were obtained. In addition, the variation coefficient of stone density (VCSD=SHI/MSD×100) and linear calculus density (LCD= VCSD/MSL) were calculated. In accordance with the stone analysis, the patients were divided into two groups (CaOx and non-CaOx groups). The logistic regression model and ROC curve were used to develop a useful predictive model. This study was approved by the Ethical Committee. Results: The number of patients with CaOx group was 335 and that of patients with non-CaOx group was 455. The mean MSL of CaOx group was shorter (9.8 ± 7.0 vs. 19.5 ± 61.8, P=0.001). In CaOx group, SHI, VCSD and LDS was higher than in non-CaOx group (all P<0.001) (Table 1). SHI (OR 1.002, 95% CI 1.001–1.004, P<0.001), VCSD (OR 1.028, 95% CI 1.016–1.041, P<0.001), and LCD (OR 1.352, 95% CI 1.270–1.444, P<0.001) were significant independent factors for CaOx stones in the logistic regression models. The areas under the ROC curve for predicting CaOx stones were 0.586 for SHI, 0.66 for VCSD, and 0.739 for LCD, with a cut-point of 2.25 (Fig 1). Conclusions: The LCD can be a useful new parameter to provide additional information to help discriminate CaOx stone before treatment. SOURCE OF Funding: None.

 photo")