Back
Purpose: Formulating poorly water-soluble compounds as amorphous solid dispersions (ASDs) is one of the most promising approaches to enhance solubility and/or dissolution,1 and membrane flux2 to improve bioavailability.3 Due to the unstable nature of amorphous materials and the underlying principle for their formation, it is clear that the manufacturing technology and process conditions would impact ASD material characteristics and properties, and in turn in vivo performance.4,5 The purpose of this work is to evaluate the interrelationship of microstructure, properties, and dissolution performance for ASDs prepared using different methods.
Methods: ASD of GDC-0810 (50% w/w) with HPMC-AS was prepared using methods of spray drying and co-precipitation via resonant acoustic mixing. Microstructure, particulate and bulk powder properties, and dissolution performance were characterized for GDC-0810 ASDs. In addition to application of typical physical characterization tools, we have applied X-Ray Microscopy (XRM) to assess the contribution of microstructure to the characteristics of ASDs and obtain additional quantification and understanding of the drug product intermediates and tablets.
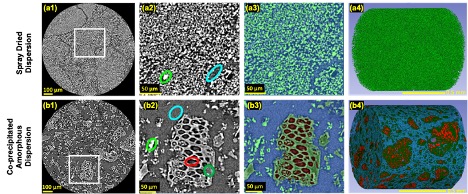
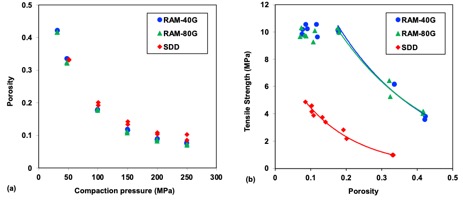
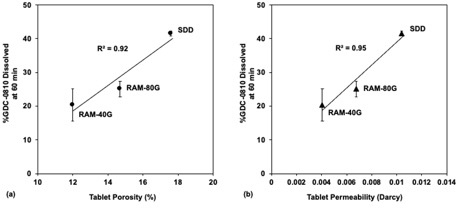
Results: Both methods of spray drying and co-precipitation produced single-phase ASDs. Distinct differences in microstructure, particle size distribution, specific surface area, bulk and tapped density, were observed between GDC-0810 spray dried dispersion (SDD) and co-precipitated amorphous dispersion (cPAD) materials. The cPAD powders prepared by the resonant acoustic mixing process demonstrated superior compactibility compared to the SDD, while the compressibility of the ASDs were comparable. Both SDD powder and tablets showed higher in vitro dissolution than those of cPAD powders. XRM calculated total solid external surface area (SA) normalized by calculated total solid volume (SV) shows a strong correlation with micro dissolution data.
Conclusion: Strong interrelationship of microstructure, physical properties, and dissolution performance was observed for GDC-0810 ASDs. XRM image-based analysis is a powerful tool to assess the contribution of microstructure to the characteristics of ASDs and provide mechanistic understanding of the interrelationship.
References: 1. Vaka SR, Bommana MM, Desai D, Djordjevic J, Phuapradit W, Shah N. Excipients for amorphous solid dispersions. In Amorphous solid dispersions 2014. p. 123-161. Springer, New York, NY.
2. Miller JM, Beig A, Carr RA, Spence JK, Dahan A. A win–win solution in oral delivery of lipophilic drugs: supersaturation via amorphous solid dispersions increases apparent solubility without sacrifice of intestinal membrane permeability. Mol Pharm. 2012;9(7):2009-16.
3. Shah N, Iyer RM, Mair HJ, Choi D, Tian H, Diodone R, Fahnrich K, Pabst-Ravot A, Tang K, Scheubel E, Grippo JF. Improved human bioavailability of vemurafenib, a practically insoluble drug, using an amorphous polymer-stabilized solid dispersion prepared by a solvent-controlled coprecipitation process. J Pharm Sci. 2013;102(3):967-81.
4. Hou HH, Rajesh A, Pandya KM, Lubach JW, Muliadi A, Yost E, Jia W, Nagapudi K. Impact of method of preparation of amorphous solid dispersions on mechanical properties: Comparison of coprecipitation and spray drying. J Pharm Sci. 2019;108(2):870-9.
5. Vasconcelos T, Marques S, das Neves J, Sarmento B. Amorphous solid dispersions: Rational selection of a manufacturing process. Adv Drug Deliv Rev. 2016;100:85-101.

Figure 1. Microstructure morphology and image segmentation, top row is SDD powder results and bottom row is cPAD powder results.

Figure 2. Compressibility (a) and compactibility (b) plots of GDC-0810 ASDs (duplicate compressions at each compaction pressure).

Figure 3: (a) ASD tablet dissolution (%GDC-0810 dissolved at 60 min) versus XRM determined tablet porosity and (b) ASD tablet dissolution (%GDC-0810 dissolved at 60 min) versus XRM determined tablet permeability. Error bars represent standard deviations where n = 3.
Formulation and Delivery - Chemical - Formulation
Category: Poster Abstract
(M1230-07-38) Assessing the Interrelationship of Microstructure, Properties, Drug Release Performance, and Preparation Process for Amorphous Solid Dispersions
Monday, October 17, 2022
12:30 PM – 1:30 PM ET
- HH
Helen Hou, Ph.D.
Genentech Inc.
South San Francisco, California, United States - HH
Helen Hou, Ph.D.
Genentech Inc.
South San Francisco, California, United States
Presenting Author(s)
Main Author(s)
Purpose: Formulating poorly water-soluble compounds as amorphous solid dispersions (ASDs) is one of the most promising approaches to enhance solubility and/or dissolution,1 and membrane flux2 to improve bioavailability.3 Due to the unstable nature of amorphous materials and the underlying principle for their formation, it is clear that the manufacturing technology and process conditions would impact ASD material characteristics and properties, and in turn in vivo performance.4,5 The purpose of this work is to evaluate the interrelationship of microstructure, properties, and dissolution performance for ASDs prepared using different methods.
Methods: ASD of GDC-0810 (50% w/w) with HPMC-AS was prepared using methods of spray drying and co-precipitation via resonant acoustic mixing. Microstructure, particulate and bulk powder properties, and dissolution performance were characterized for GDC-0810 ASDs. In addition to application of typical physical characterization tools, we have applied X-Ray Microscopy (XRM) to assess the contribution of microstructure to the characteristics of ASDs and obtain additional quantification and understanding of the drug product intermediates and tablets.
Results: Both methods of spray drying and co-precipitation produced single-phase ASDs. Distinct differences in microstructure, particle size distribution, specific surface area, bulk and tapped density, were observed between GDC-0810 spray dried dispersion (SDD) and co-precipitated amorphous dispersion (cPAD) materials. The cPAD powders prepared by the resonant acoustic mixing process demonstrated superior compactibility compared to the SDD, while the compressibility of the ASDs were comparable. Both SDD powder and tablets showed higher in vitro dissolution than those of cPAD powders. XRM calculated total solid external surface area (SA) normalized by calculated total solid volume (SV) shows a strong correlation with micro dissolution data.
Conclusion: Strong interrelationship of microstructure, physical properties, and dissolution performance was observed for GDC-0810 ASDs. XRM image-based analysis is a powerful tool to assess the contribution of microstructure to the characteristics of ASDs and provide mechanistic understanding of the interrelationship.
References: 1. Vaka SR, Bommana MM, Desai D, Djordjevic J, Phuapradit W, Shah N. Excipients for amorphous solid dispersions. In Amorphous solid dispersions 2014. p. 123-161. Springer, New York, NY.
2. Miller JM, Beig A, Carr RA, Spence JK, Dahan A. A win–win solution in oral delivery of lipophilic drugs: supersaturation via amorphous solid dispersions increases apparent solubility without sacrifice of intestinal membrane permeability. Mol Pharm. 2012;9(7):2009-16.
3. Shah N, Iyer RM, Mair HJ, Choi D, Tian H, Diodone R, Fahnrich K, Pabst-Ravot A, Tang K, Scheubel E, Grippo JF. Improved human bioavailability of vemurafenib, a practically insoluble drug, using an amorphous polymer-stabilized solid dispersion prepared by a solvent-controlled coprecipitation process. J Pharm Sci. 2013;102(3):967-81.
4. Hou HH, Rajesh A, Pandya KM, Lubach JW, Muliadi A, Yost E, Jia W, Nagapudi K. Impact of method of preparation of amorphous solid dispersions on mechanical properties: Comparison of coprecipitation and spray drying. J Pharm Sci. 2019;108(2):870-9.
5. Vasconcelos T, Marques S, das Neves J, Sarmento B. Amorphous solid dispersions: Rational selection of a manufacturing process. Adv Drug Deliv Rev. 2016;100:85-101.

Figure 1. Microstructure morphology and image segmentation, top row is SDD powder results and bottom row is cPAD powder results.

Figure 2. Compressibility (a) and compactibility (b) plots of GDC-0810 ASDs (duplicate compressions at each compaction pressure).

Figure 3: (a) ASD tablet dissolution (%GDC-0810 dissolved at 60 min) versus XRM determined tablet porosity and (b) ASD tablet dissolution (%GDC-0810 dissolved at 60 min) versus XRM determined tablet permeability. Error bars represent standard deviations where n = 3.
