Back
Purpose: Over the last 2 decades, several methods for assessing the dissolution of orally inhaled drug products have been evaluated. Many of these methods have limitations including the requirement to collect multiple doses from the device to attain a quantifiable mass. For inhaled drug products, like a dry powder inhaler (DPI), where the labeled dose is typically a single actuation, these multi-actuation approaches may mask inter-dose variability and are not representative of a single dose or the amount of drug product that reaches the lung. A DPI’s lung deposition is dependent on the particle size and aerodynamic performance. The particles depositing in the lungs are referred to as the fine fraction, generally ranging from 0.5 to 5 μm aerodynamic diameter1. The purpose of this study was to develop a low-volume in vitro dissolution method for testing the fine particle dose ( < 5 μm) of orally inhaled dry powders using a single dose from a commercial DPI. This method was used for systematic screening of dissolution differences between five different batches of low dose Advair® Diskus® [100 mcg Fluticasone Propionate (FP) and 50 mcg Salmeterol Xinafoate (Sal) – FP/Sal 100/50].
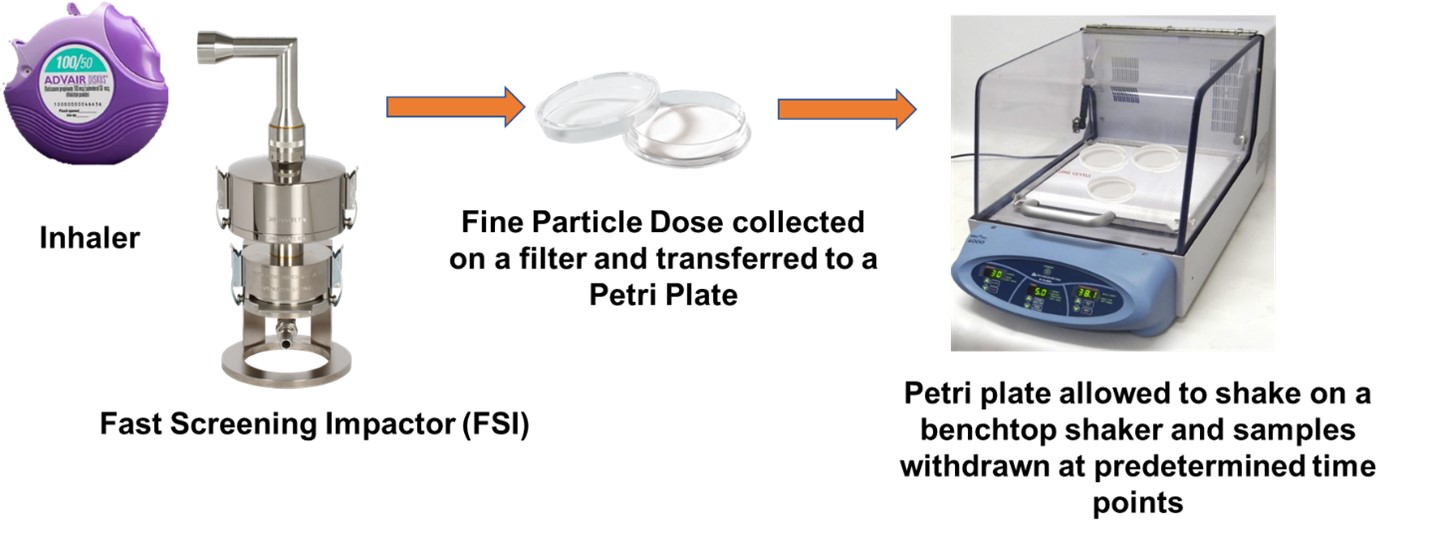
Methods: Five batches of FP/Sal 100/50 (GlaxoSmithKline, Zebulon, USA) with expiration dates over a 10-month period (from 4/2021 to 1/2022) were purchased. The batch information is as follows: Batch X: lot WX7G, expiration 4/2021; Batch Y: lot 3W7F, expiration 5/2021; Batch C: lot 9D5W, expiration 7/2021; Batch B: lot 6G9Y, expiration 11/2021; and Batch D: lot WG4L, expiration 1/2022. A fast screening impactor (FSI) (Copley Scientific, Nottingham, UK) with a USP induction port and pre-separator containing a specialized insert was used at a 90 L/min flow rate with a 4 L actuation volume, corresponding to a ~4 kPa pressure drop across the device. The use of the FSI with the induction port and pre-separator provides a greater deposition surface area and decrease in particle-on-particle deposition that can bias dissolution results. The FSI device (shown in Figure 1) was coupled to a Fine Fraction Collector (FFC) that collects the powders that have an aerodynamic particle size smaller than 5μm on a filter housed within the FFC. Briefly, the DPI was actuated once (corresponding to a single labeled dose) into the apparatus, and the filter from the FFC was collected and added onto a 10 cm Petri plate containing 15 mL of the dissolution media (0.2% Sodium Dodecyl Sulphate in Phosphate Buffered Saline, pH 7.4). This Petri plate was then kept in a benchtop orbital shaker (MaxQ™ 4000 Benchtop Orbital Shakers) at 37°C and 50 rpm. One mL of the sample was collected at 5, 10, 15, 30, 45, 60, and 75 minutes and the volume was replenished at each time point (the shaker speed was increased to 75 rpm for the last interval from 60 to 75 minutes to establish the endpoint for dissolution). The amount of FP and Sal dissolved at each time point was quantified via RP-HPLC using 0.6% ammonium acetate/methanol (30/70) as mobile phase and a UV detector set at 228 nm to assay both active ingredients. The dissolution data for the different batches was compared using similarity factor (f2) and difference factor (f1) as per U.S. FDA guidelines and using ANOVA with a post-hoc Tukey-Kramer HSD test using JMP 10.0 Software (SAS, Cary, NC)2.
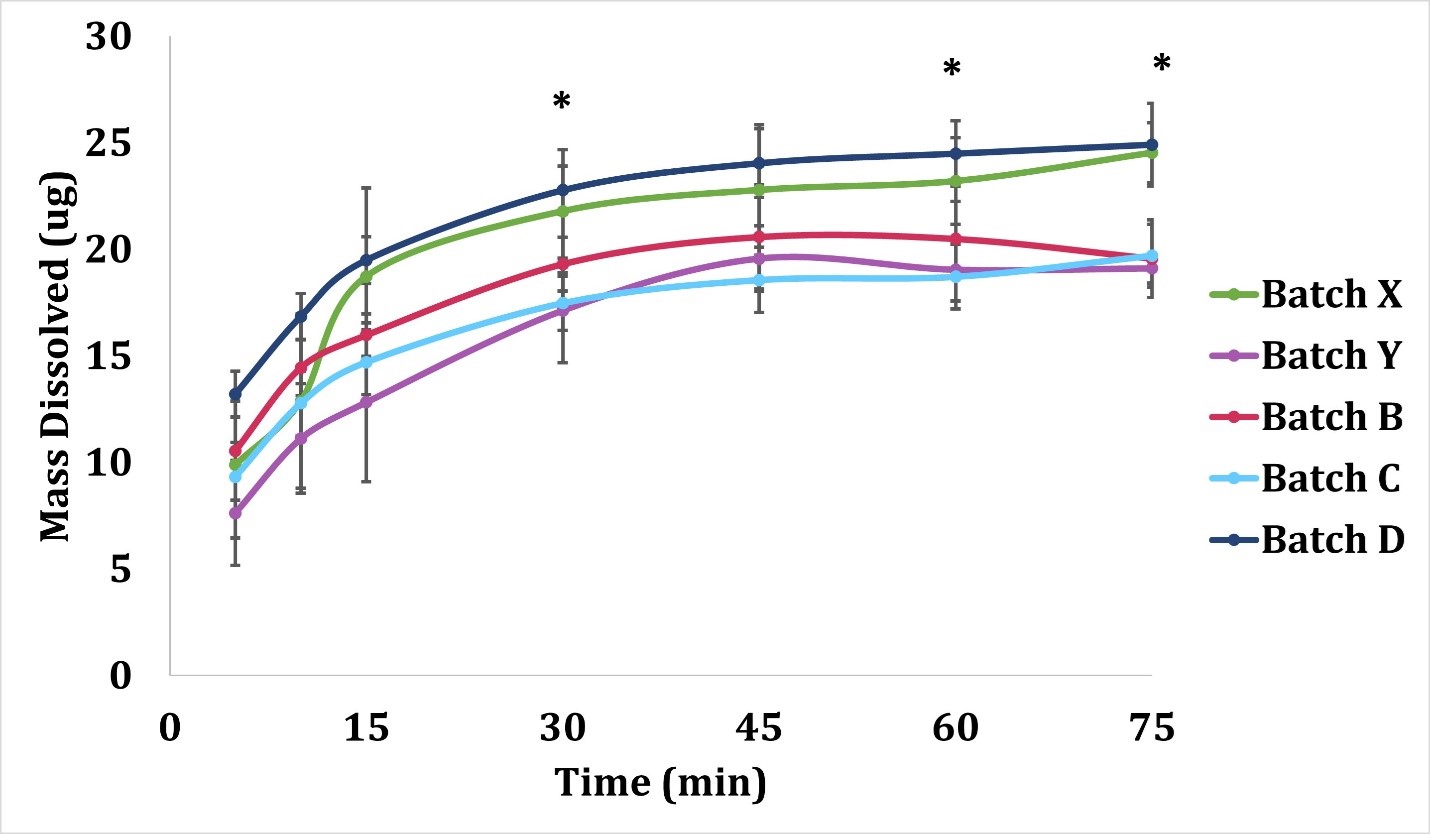
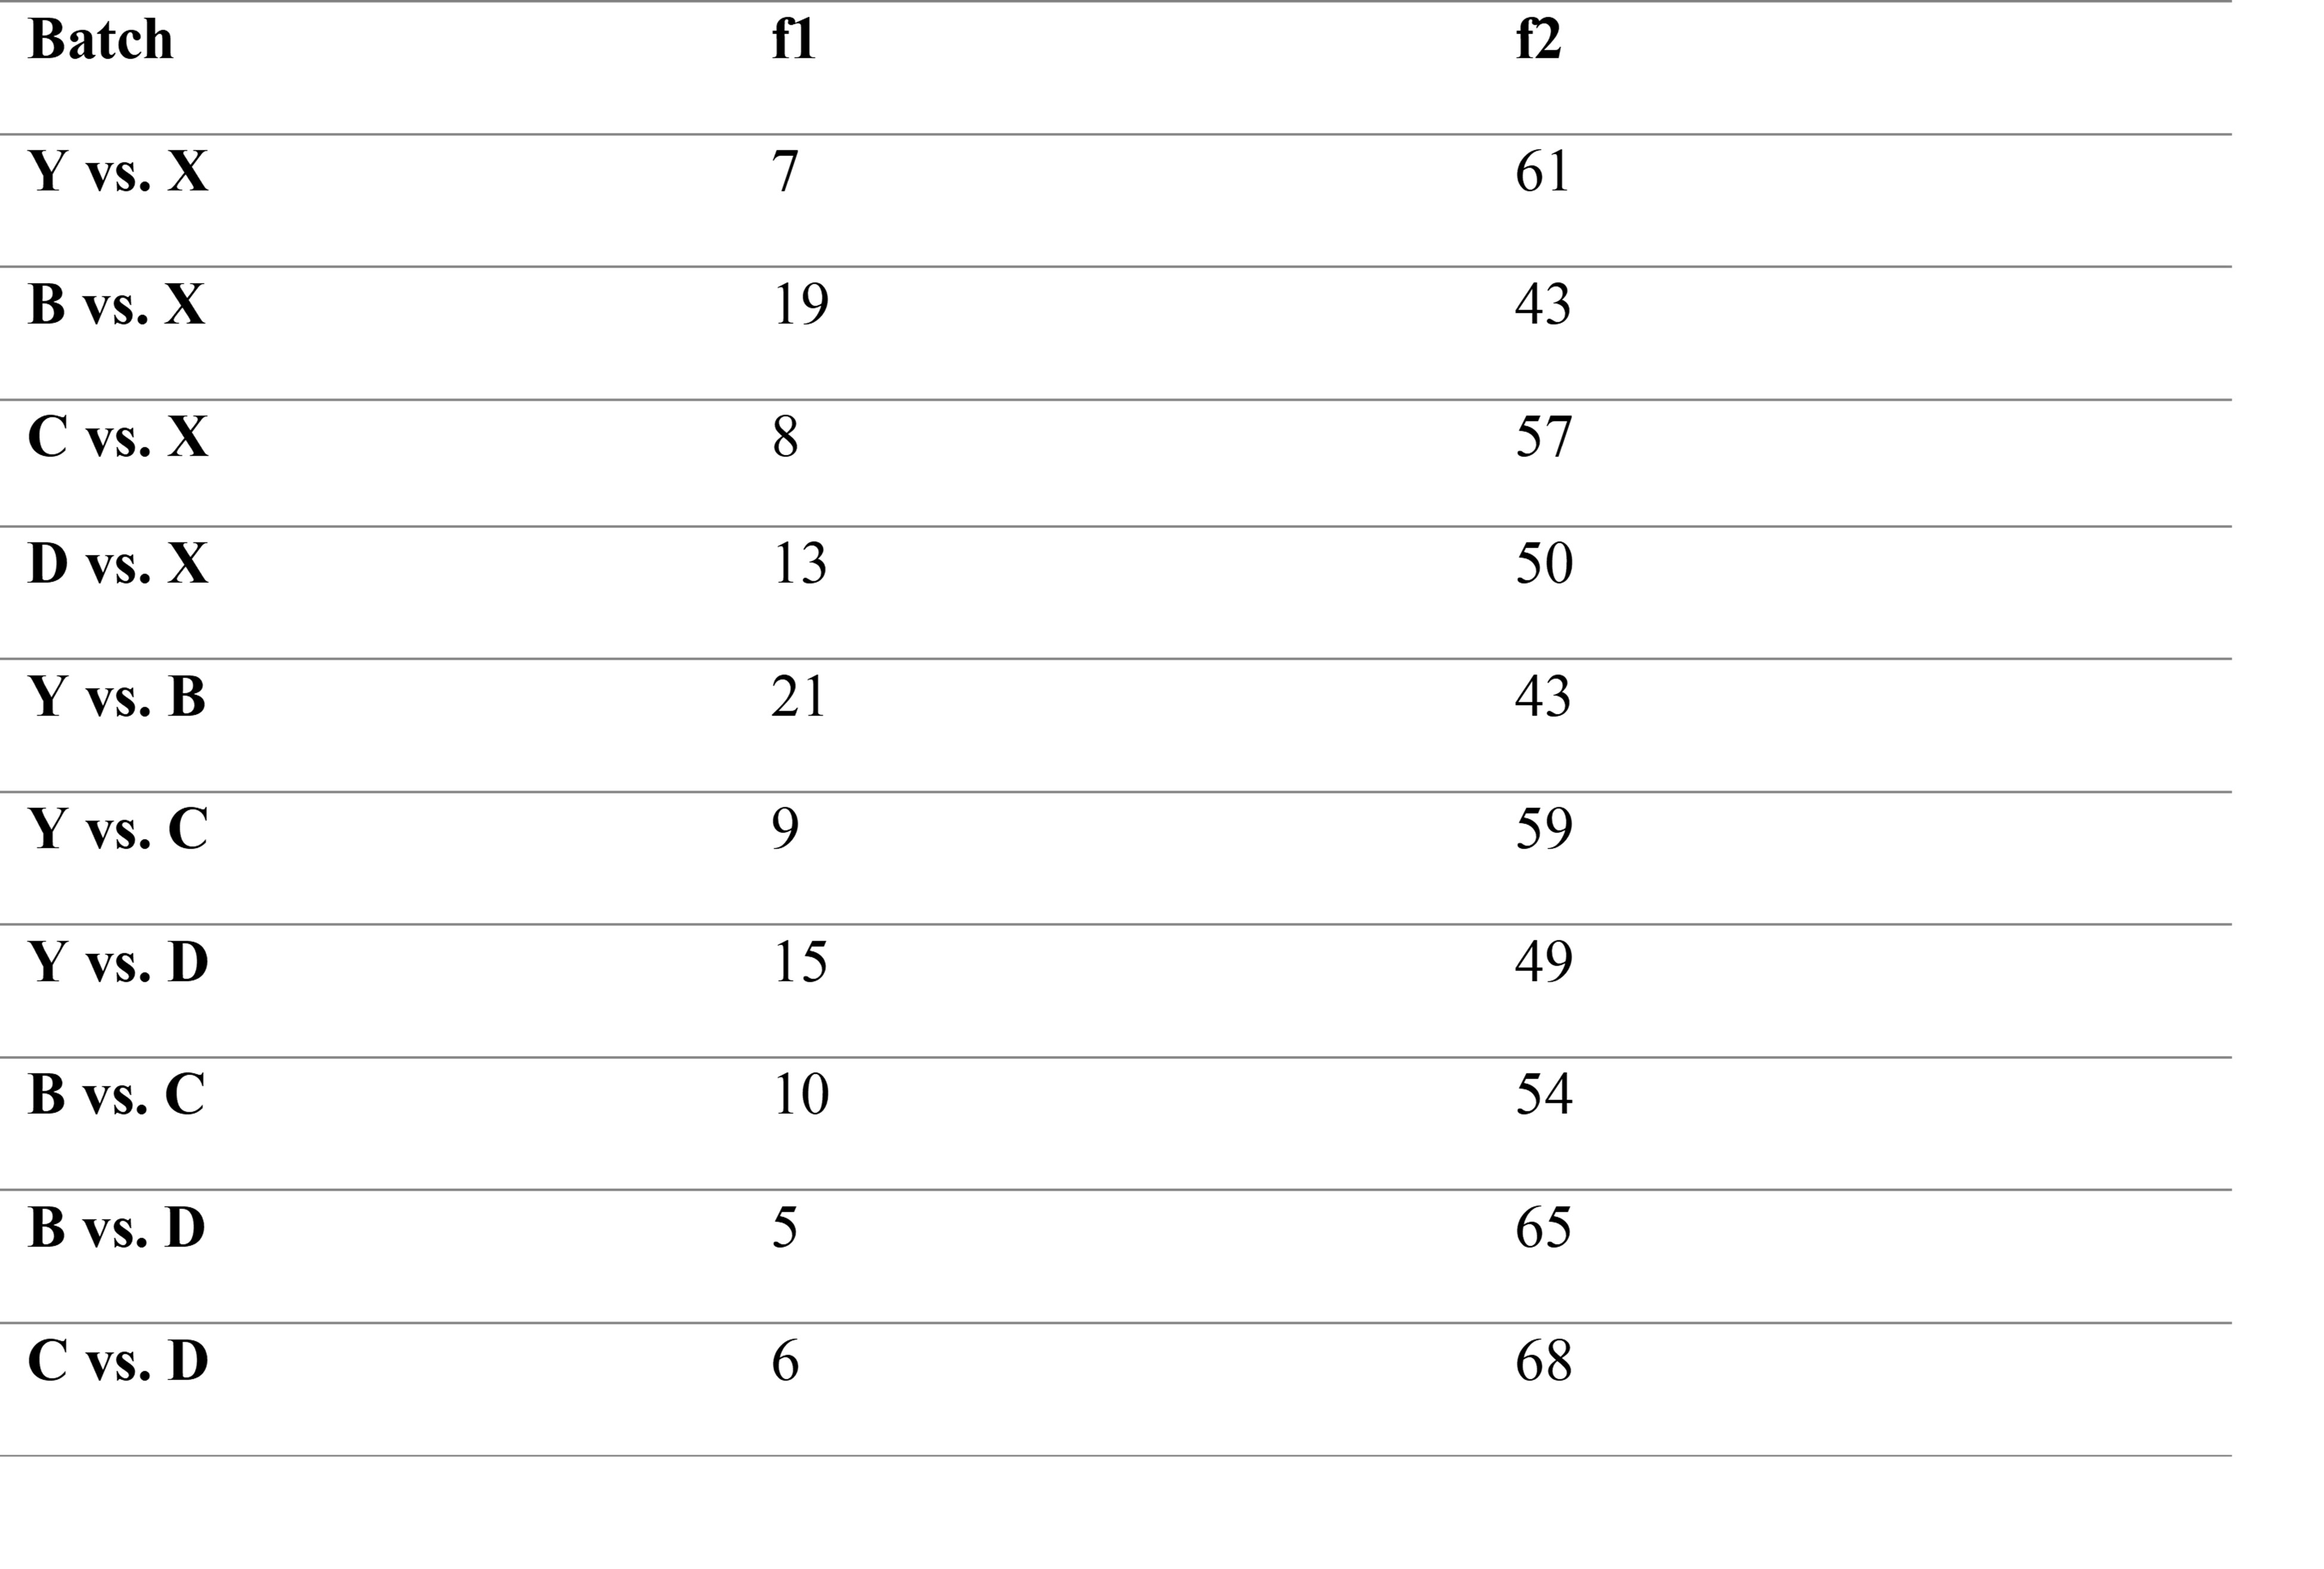
Results: Dissolution testing of the five batches of FP/Sal 100/50 revealed that the powders exhibited an initial burst release of FP followed by plateau after 45 minutes, as shown in Figure 2. The dissolution profiles showed significant differences between batches at 30, 60, and 75 minutes time points. At 30 minutes, Batch D showed significantly higher mass dissolved (p < 0.05) as compared to Batch C and Y. Batch C and Batch Y also exhibited significantly lower mass dissolved from Batch D at 60 minutes and 75 minutes. Additionally, at 75 minutes, the mass of dissolved FP in Batch B was lower than Batch D and X, while Batch X exhibited higher dissolved mass as compared to Batch C and Y. While the initial time points for dissolution did not exhibit differences, the differences became more pronounced after the 30-minute time point. Significant differences at the dissolution endpoint (i.e., 75-minute time point), are indicative of the variability in the fine particle dose amongst batches. Additionally, the calculation of similarity factor (f2) and difference factor (f1) revealed differences as shown in Table 1.
Conclusion: A sensitive method to study the dissolution of a single respirable dose of a dry powder from commercial DPIs was successfully developed. Through the systematic screening of five batches of Advair® Diskus® 100/50, it was determined that the method is capable of detecting differences in the dissolution profile using this low-volume system. This method may provide complementary advantages of low volume unstirred models, like the RespiCell, and common paddle/stirred methods used for testing bulk powders.
References: 1. Pascal Demoly, Paul Hagedoorn, Anne H. de Boer, Henderik W. Frijlink,
The clinical relevance of dry powder inhaler performance for drug delivery, Respiratory Medicine, Volume 108, Issue 8, 2014, Pages 1195-1203, ISSN 0954-6111, https://doi.org/10.1016/j.rmed.2014.05.009.
2. U.S. Food and Drug Administration/Center for Drug Evaluation and Research. (August 1997). Guidance for Industry: Dissolution Testing of Immediate Release Solid Oral Dosage Forms. https://www.fda.gov/regulatory-information/search-fda-guidance-documents
Acknowledgments: Funding for this work was made possible, in part, by the U.S. Food and Drug Administration through Contract HHSF223201810169C. Views expressed in this abstract are from the authors and do not necessarily reflect the official policies of the Department of Health and Human Services, and the FDA, nor does any mention of trade names, commercial practices, or organization imply endorsement by the US Government

Figure 1: Schematic of experimental setup and procedure for fine particle dose dissolution testing.

Figure 2: Dissolution time-curve of FP for all batches. Statistically significant (p < 0.05) differences were observed between batches C-D and D-Y at 30 minutes, batches C-D and D-Y at 60 minutes and batches B-D, B-X, C-D, C-X, D-Y and X-Y at 75 minutes. Data are represented as mean ± standard deviation (n=3). *Asterisks indicate significant differences at that particular time point.

Table 1: Difference factor (f1) and similarity factor (f2) comparisons. Values that fall within the standard range (f1: 0-15 and f2: 50-100) generally ensure sameness of the compared curves.
Formulation and Delivery - Chemical - Biopharmaceutics
Category: Late Breaking Poster Abstract
(W1030-03-14) Development of a Low-Volume In Vitro Dissolution Method for Assessing Variability in Fine Particle Doses of Dry Powder Inhalers
Wednesday, October 19, 2022
10:30 AM – 11:30 AM ET
- VN
Varsha Nair, MS
University of Texas at Austin
Austin, Texas, United States - VN
Varsha Nair, MS
University of Texas at Austin
Austin, Texas, United States
Presenting Author(s)
Main Author(s)
Purpose: Over the last 2 decades, several methods for assessing the dissolution of orally inhaled drug products have been evaluated. Many of these methods have limitations including the requirement to collect multiple doses from the device to attain a quantifiable mass. For inhaled drug products, like a dry powder inhaler (DPI), where the labeled dose is typically a single actuation, these multi-actuation approaches may mask inter-dose variability and are not representative of a single dose or the amount of drug product that reaches the lung. A DPI’s lung deposition is dependent on the particle size and aerodynamic performance. The particles depositing in the lungs are referred to as the fine fraction, generally ranging from 0.5 to 5 μm aerodynamic diameter1. The purpose of this study was to develop a low-volume in vitro dissolution method for testing the fine particle dose ( < 5 μm) of orally inhaled dry powders using a single dose from a commercial DPI. This method was used for systematic screening of dissolution differences between five different batches of low dose Advair® Diskus® [100 mcg Fluticasone Propionate (FP) and 50 mcg Salmeterol Xinafoate (Sal) – FP/Sal 100/50].
Methods: Five batches of FP/Sal 100/50 (GlaxoSmithKline, Zebulon, USA) with expiration dates over a 10-month period (from 4/2021 to 1/2022) were purchased. The batch information is as follows: Batch X: lot WX7G, expiration 4/2021; Batch Y: lot 3W7F, expiration 5/2021; Batch C: lot 9D5W, expiration 7/2021; Batch B: lot 6G9Y, expiration 11/2021; and Batch D: lot WG4L, expiration 1/2022. A fast screening impactor (FSI) (Copley Scientific, Nottingham, UK) with a USP induction port and pre-separator containing a specialized insert was used at a 90 L/min flow rate with a 4 L actuation volume, corresponding to a ~4 kPa pressure drop across the device. The use of the FSI with the induction port and pre-separator provides a greater deposition surface area and decrease in particle-on-particle deposition that can bias dissolution results. The FSI device (shown in Figure 1) was coupled to a Fine Fraction Collector (FFC) that collects the powders that have an aerodynamic particle size smaller than 5μm on a filter housed within the FFC. Briefly, the DPI was actuated once (corresponding to a single labeled dose) into the apparatus, and the filter from the FFC was collected and added onto a 10 cm Petri plate containing 15 mL of the dissolution media (0.2% Sodium Dodecyl Sulphate in Phosphate Buffered Saline, pH 7.4). This Petri plate was then kept in a benchtop orbital shaker (MaxQ™ 4000 Benchtop Orbital Shakers) at 37°C and 50 rpm. One mL of the sample was collected at 5, 10, 15, 30, 45, 60, and 75 minutes and the volume was replenished at each time point (the shaker speed was increased to 75 rpm for the last interval from 60 to 75 minutes to establish the endpoint for dissolution). The amount of FP and Sal dissolved at each time point was quantified via RP-HPLC using 0.6% ammonium acetate/methanol (30/70) as mobile phase and a UV detector set at 228 nm to assay both active ingredients. The dissolution data for the different batches was compared using similarity factor (f2) and difference factor (f1) as per U.S. FDA guidelines and using ANOVA with a post-hoc Tukey-Kramer HSD test using JMP 10.0 Software (SAS, Cary, NC)2.
Results: Dissolution testing of the five batches of FP/Sal 100/50 revealed that the powders exhibited an initial burst release of FP followed by plateau after 45 minutes, as shown in Figure 2. The dissolution profiles showed significant differences between batches at 30, 60, and 75 minutes time points. At 30 minutes, Batch D showed significantly higher mass dissolved (p < 0.05) as compared to Batch C and Y. Batch C and Batch Y also exhibited significantly lower mass dissolved from Batch D at 60 minutes and 75 minutes. Additionally, at 75 minutes, the mass of dissolved FP in Batch B was lower than Batch D and X, while Batch X exhibited higher dissolved mass as compared to Batch C and Y. While the initial time points for dissolution did not exhibit differences, the differences became more pronounced after the 30-minute time point. Significant differences at the dissolution endpoint (i.e., 75-minute time point), are indicative of the variability in the fine particle dose amongst batches. Additionally, the calculation of similarity factor (f2) and difference factor (f1) revealed differences as shown in Table 1.
Conclusion: A sensitive method to study the dissolution of a single respirable dose of a dry powder from commercial DPIs was successfully developed. Through the systematic screening of five batches of Advair® Diskus® 100/50, it was determined that the method is capable of detecting differences in the dissolution profile using this low-volume system. This method may provide complementary advantages of low volume unstirred models, like the RespiCell, and common paddle/stirred methods used for testing bulk powders.
References: 1. Pascal Demoly, Paul Hagedoorn, Anne H. de Boer, Henderik W. Frijlink,
The clinical relevance of dry powder inhaler performance for drug delivery, Respiratory Medicine, Volume 108, Issue 8, 2014, Pages 1195-1203, ISSN 0954-6111, https://doi.org/10.1016/j.rmed.2014.05.009.
2. U.S. Food and Drug Administration/Center for Drug Evaluation and Research. (August 1997). Guidance for Industry: Dissolution Testing of Immediate Release Solid Oral Dosage Forms. https://www.fda.gov/regulatory-information/search-fda-guidance-documents
Acknowledgments: Funding for this work was made possible, in part, by the U.S. Food and Drug Administration through Contract HHSF223201810169C. Views expressed in this abstract are from the authors and do not necessarily reflect the official policies of the Department of Health and Human Services, and the FDA, nor does any mention of trade names, commercial practices, or organization imply endorsement by the US Government

Figure 1: Schematic of experimental setup and procedure for fine particle dose dissolution testing.

Figure 2: Dissolution time-curve of FP for all batches. Statistically significant (p < 0.05) differences were observed between batches C-D and D-Y at 30 minutes, batches C-D and D-Y at 60 minutes and batches B-D, B-X, C-D, C-X, D-Y and X-Y at 75 minutes. Data are represented as mean ± standard deviation (n=3). *Asterisks indicate significant differences at that particular time point.

Table 1: Difference factor (f1) and similarity factor (f2) comparisons. Values that fall within the standard range (f1: 0-15 and f2: 50-100) generally ensure sameness of the compared curves.
