Manufacturing and Analytical Characterization - Biomolecular - Drug Product Manufacturing and Development
Category: Late Breaking Poster Abstract
(W1030-06-34) Characterization of Protein Formulations to Optimize Annealing Parameters for Freeze-Drying
- MR
Mohsina Rahman, MS
Graduate Student
University of Connecticut
Storrs Mansfield, Connecticut, United States - MR
Mohsina Rahman, MS
Graduate Student
University of Connecticut
Storrs Mansfield, Connecticut, United States
Presenting Author(s)
Main Author(s)
Purpose: Lyophilization is the most widely used method for stability enhancement, long-term storage and transportation of protein formulations. The primary drying step (sublimation) is often the longest phase of the lyophilization cycle. As sublimation of ice occurs, the thickness of a dried product layer over the frozen product creates resistance (Rp) to further ice sublimation. As sublimation progresses, the increase in the dried layer thickness (Ldry) leads to increased product resistance (Rp). Previous studies showed that annealing reduces the rate of primary drying (Searles 2001), presumably due to a reduction in Rp. In this study, we seek to develop a prediction for the optimum annealing temperature and time to reduce the cycle duration.
Methods: The material studied in this preliminary investigation is a proprietary stabilizer solution without protein, which consisted of 10% w/v solute. Differential Scanning Calorimetry (DSC) was used to determine the equilibrium melting temperature of several concentrations of the stabilizer solution (10-60% maintaining the ratio of solutes constant at each concentration) , resulting in a phase diagram for the stabilizer. The viscosity of each concentration was measured over a range of temperatures using a oscillatory rheometer (TA instruments, AR-G2). The stabilizer solution was filled in 2ml serum vials with 5mm fill depth for freeze drying (MicroFD®, Millrock Technology using LyoSim® blocks to reduce the edge effect) using conservative drying conditions after several freezing protocols (annealed at product temperatures (Tann) of -14.5ᵒC for 2hr and 24 hr, at -21ᵒC for 0.3 hr, 2hr and 24 hr and at -30ᵒC for 10 hr and 24 hr). The Rp was calculated from the thermocouple data as previously described (Bogner 2021). The initial slope of Rp versus Ldry (Rp, slope) was determined from each thermocouple trace.
Results: Annealing was found to reduce Rp consistent with Searles et al. In addition, the vial-to-vial heterogeneity in Rp decreased with annealing time. Most importantly, Rp,slope, was found to follow an exponential decay with time
Rp,slope = (Rp,slope,unannealed – Rp,slope,∞)e-k(Tann)t + Rp,slope,∞
Where Rp,slope,unannealed is the slope of Rp versus Ldry for unannealed product, Rp,slope,∞ is the lowest accessible value of the Rp slope at any annealing temperature, and k(Tann) is the first order rate constant of the reduction in Rp at any annealing temperature (Tann).
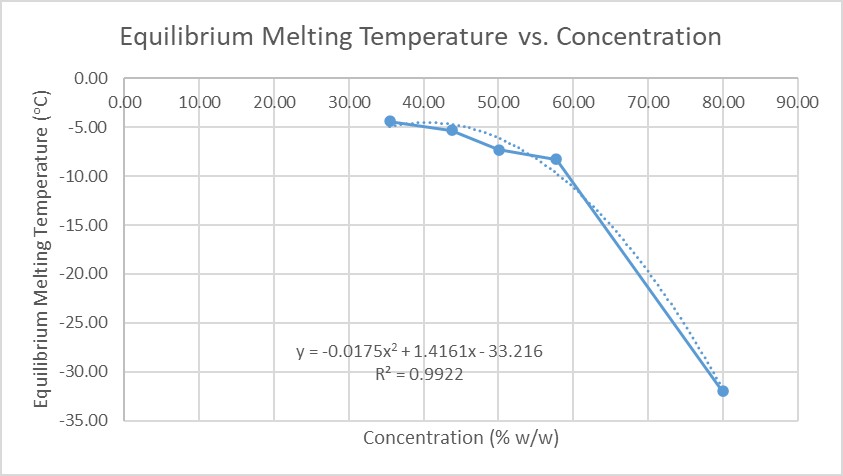
The phase diagram (Figure 1) defines the equilibrium freeze concentrate at each annealing temperature, i.e., C = f(T). Viscosity versus temperature, ie., η = f (C(T)) was fitted to a series of WLF equations at each concentration. The combination and interpolation of equations fitted to the data allowed us to calculate the concentration and viscosity of the freeze concentrate at each annealing temperature, η = f(C(Tann)). Preliminary data suggest that the rate constant for annealing, k(Tann), is related to the viscosity of the freeze-concentrate defined by the phase diagram and viscosity data extrapolated using the WLF equation.
Conclusion: Experimental data (DSC and viscosity) that require very small sample sizes have the potential to be used to predict an optimum annealing time and temperature (at least based on reducing product resistance). Additional work is required to refine the model. Extensions of this work formulations using this and other stabilizing platforms are planned.
References: 1. Searles JA, Carpenter JF, Randolph TW. Annealing to optimize the primary drying rate, reduce freezing-induced drying rate heterogeneity, and determine T(g)' in pharmaceutical lyophilization. J Pharm Sci. 2001 Jul;90(7):872-87. doi: 10.1002/jps.1040. PMID: 11458336
2. Bogner, R., Gong, E., Kessler, W. et al. A Software Tool for Lyophilization Primary Drying Process Development and Scale-up Including Process Heterogeneity, I: Laboratory-Scale Model Testing. AAPS PharmSciTech 22, 274 (2021). https://doi.org/10.1208/s12249-021-02134-3
Acknowledgments: Authors would like to acknowledge AstraZeneca for funding support and for providing the proprietary formulations.
Figure-1: Equilibrium Melting Temperature vs. Concentration Curve
