Formulation and Delivery - Chemical - Formulation
Category: Late Breaking Poster Abstract
(T1330-12-71) Quality and Processability Parameters Prediction for a Direct Compressible Tablet Powder Mix
- ND
Nicolas Descamps, Ph.D.
Roquette Freres
Lestrem Cedex, Nord-Pas-de-Calais, France - CP
Carmen Popescu, Ph.D.
Roquette America Inc.
Geneva, Illinois, United States
Main Author(s)
Presenting Author(s)
Purpose: Tablets, as a dosage form, have many advantages, like high patient compliance, portability, relatively low cost, and convenient scaling-up. Based on experimental study and quantitative evaluation, there is a need to find reliable computational physics criteria to qualify tablet powder mix (API and excipients) suitability for direct compression (DC). As literature suggests(1,2,3), the easiest way is to create a spider diagram based on measured physical powder parameters in acceptable range of values and define the conversion to radii from 0 to 10 scale.
Methods: Materials: Sitagliptin is used along with diet and exercise and sometimes with other medications to lower blood sugar levels in adults with type 2 diabetes. PEARLITOL® 200 SD mannitol and MICROCEL® MC-200 microcrystalline cellulose (MCC) are commonly used filler/binder in DC. Bulk Densities (Da) (associated to die filling parameter) was measured as per European Pharmacopeia 2.9.34, 𝐷𝑏=𝑚/𝑉𝑏. Tapped density (Dt) (linked to flowability): measured as per European Pharmacopeia 2.9.34, 𝐷𝑡=𝑚/𝑉𝑡
Hausner ratio (HR) (linked to flowability): as per European Pharmacopeia 2.9.34; 𝐻𝑅=𝐷𝑡/𝐷𝑏
Angle of repose (linked to flowability): evaluated as per European Pharmacopeia 2.9.36
Powder flow time (linked to flowability): measured as per European Pharmacopeia 2.9.16
D10 (linked to flowability): The portion of particles with diameters smaller than D10 is 10% of the total volume of powder. Measured using a laser diffraction particle size analyzer.
Bulk density difference (powder mixture homogeneity): Calculated using minimum and maximum bulk densities of the individual components of the powder blend. Minor components (lubricant, glidant or flavor) are not considered bulk density difference=(𝐷(𝑏, 𝑚𝑎𝑥)−𝐷 (𝑏, 𝑚𝑖𝑛) )/𝐷(𝑏, 𝑚𝑖𝑛𝑖)
Particle size difference (powder mixture homogeneity): Calculated using minimum and maximum D50 of the individual components of the powder blend. Minor components (lubricant, glidant or flavor) are not considered particle size difference=(𝐷(50,𝑚𝑎𝑥)−𝐷(50,𝑚𝑖𝑛))/𝐷(50,𝑚𝑖𝑛).
Specific surface area (associated with compactibility): evaluated as per European Pharmacopeia 2.9.26
Maximum tensile strength at P≤200MPa (𝜎𝑡) (associated with compactibility): as per European Pharmacopeia 2.9.8. Calculated using maximum hardness measured for a compression pressure P≤200 MPa. Measurement conditions: low speed (10tabs/min) with flat punch 10 mm diameter.
𝜎𝑡=2𝐻/(𝜋𝑑T𝑡)
H: tablet hardness
dT: tablet diameter
t: tablet thickness
Loss on drying (associated with stability): as per European Pharmacopeia 2.2.32
Hygroscopicity (associated with stability): Measured using a dynamic vapor sorption (DVS) analyzer as percentage increase in sample weight after being equilibrated at a relative humidity of 76% (+/-2%) and a temperature of 20°C.
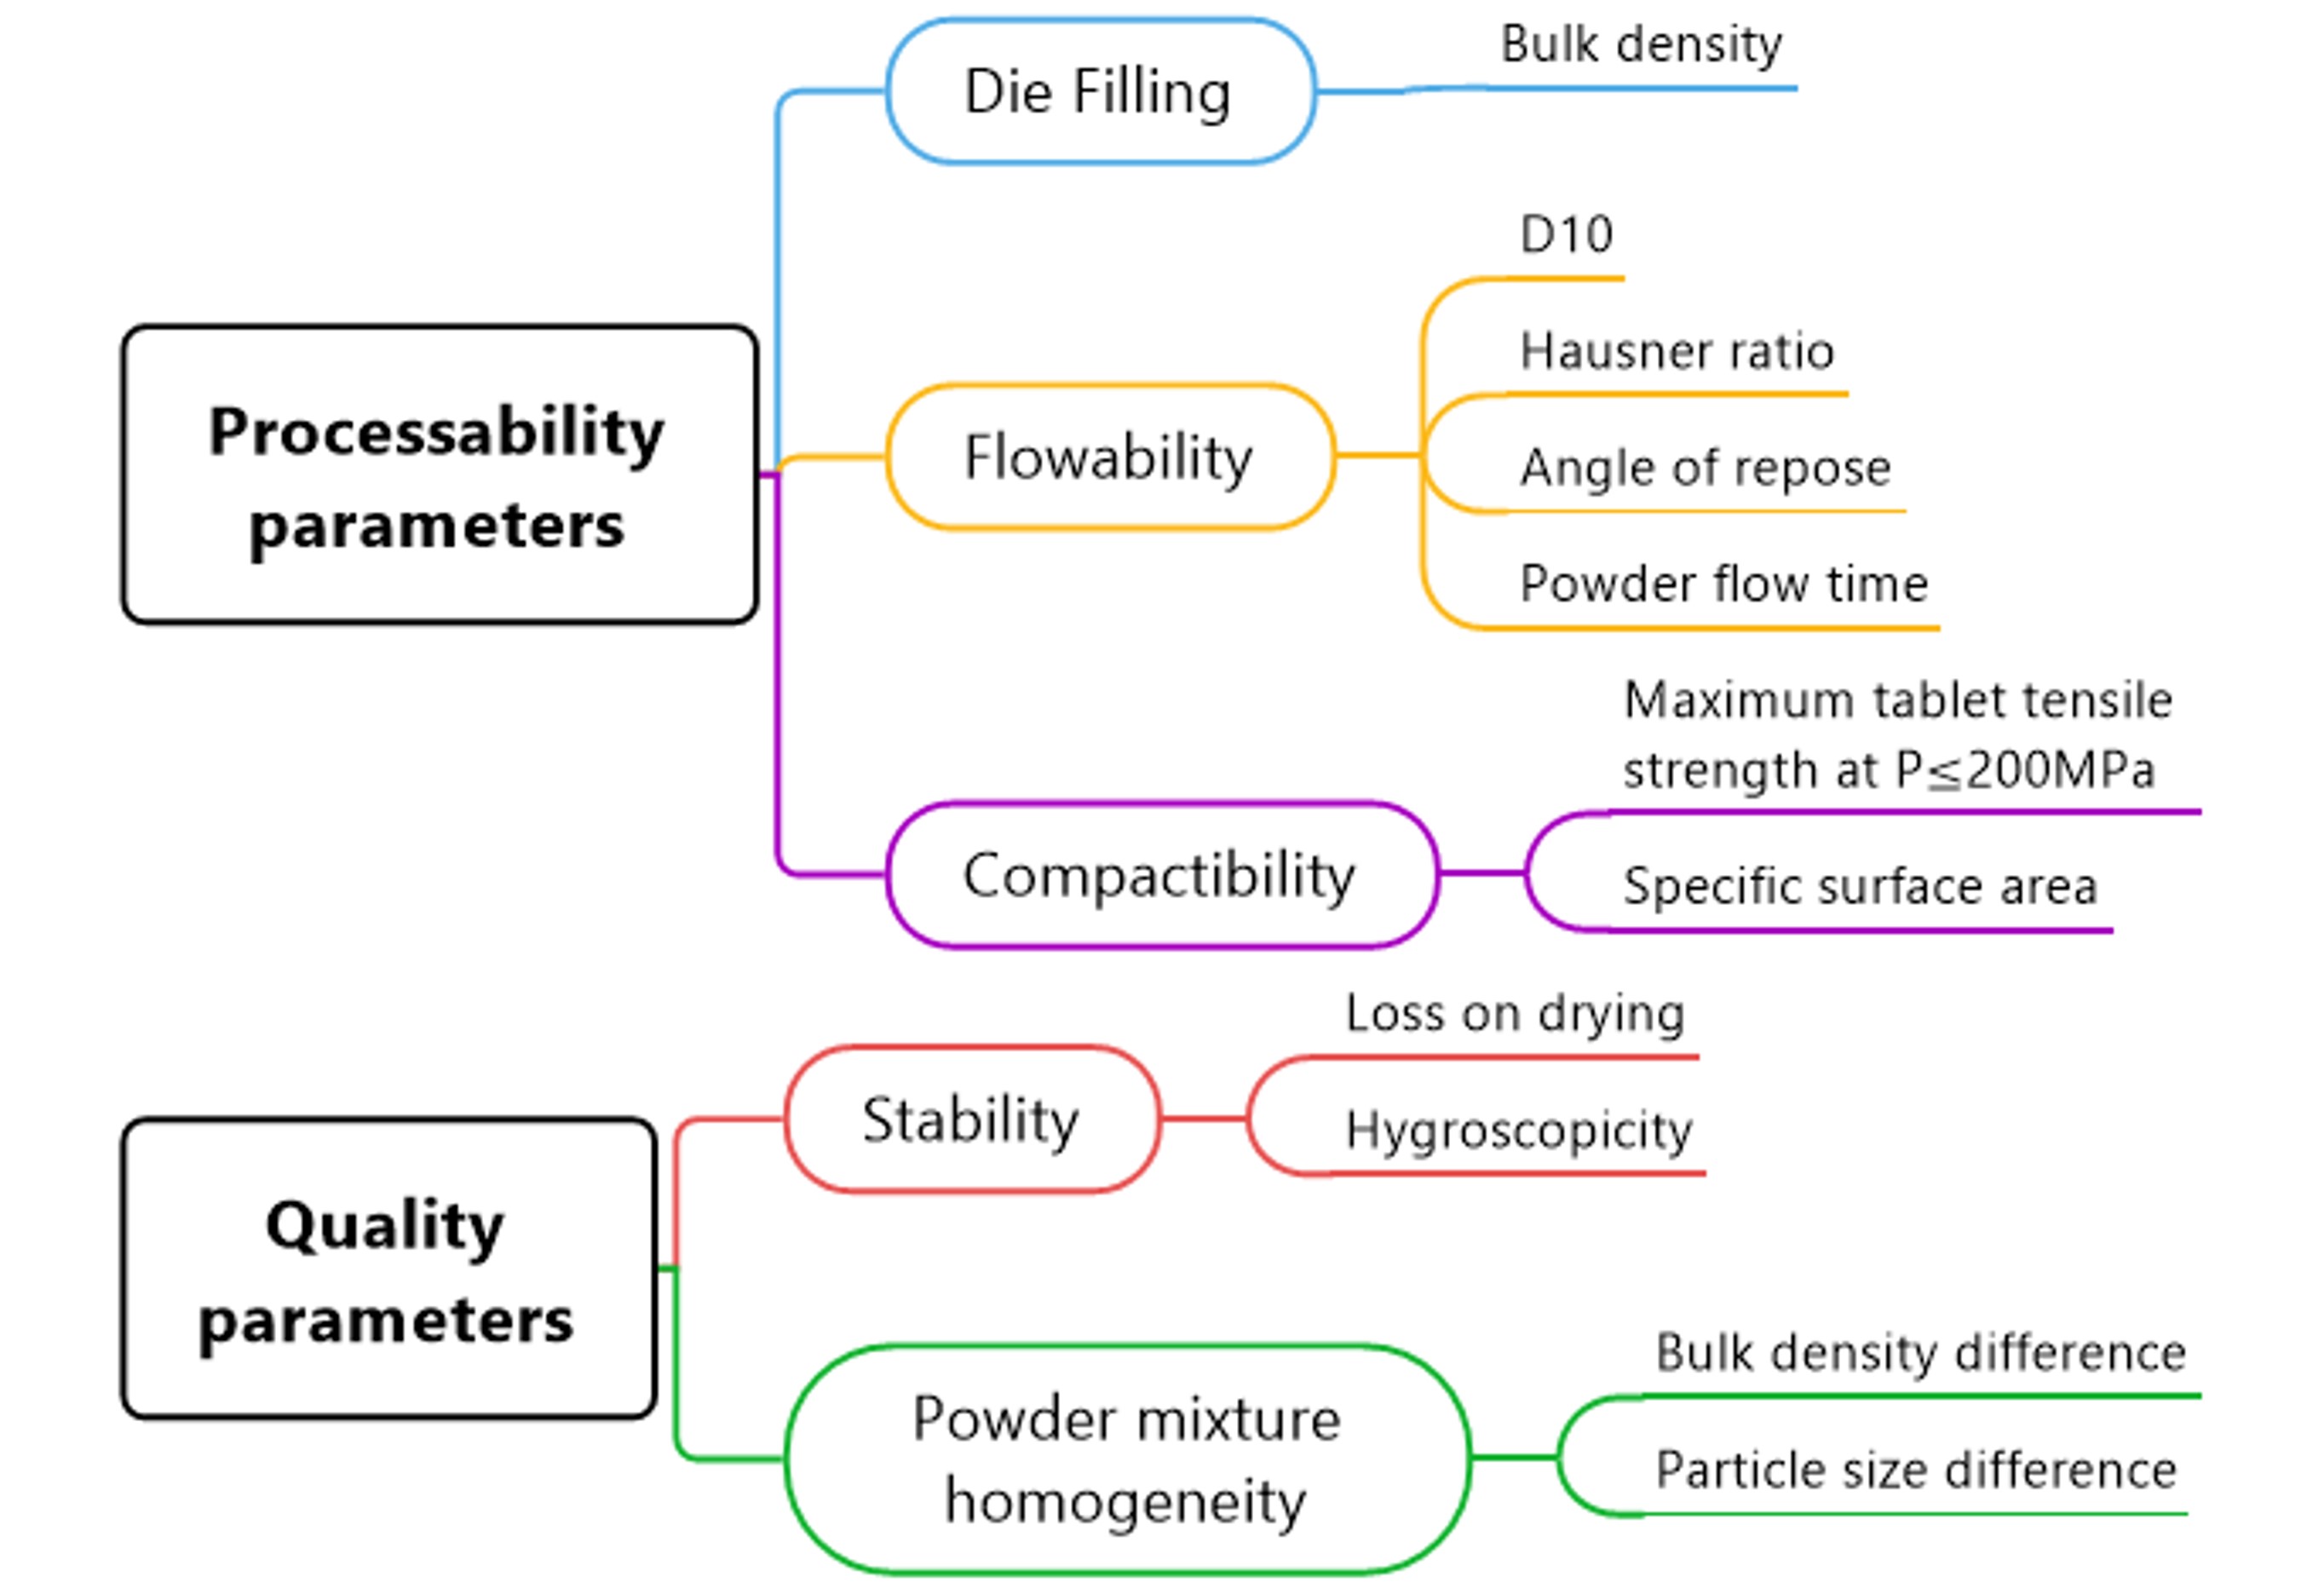
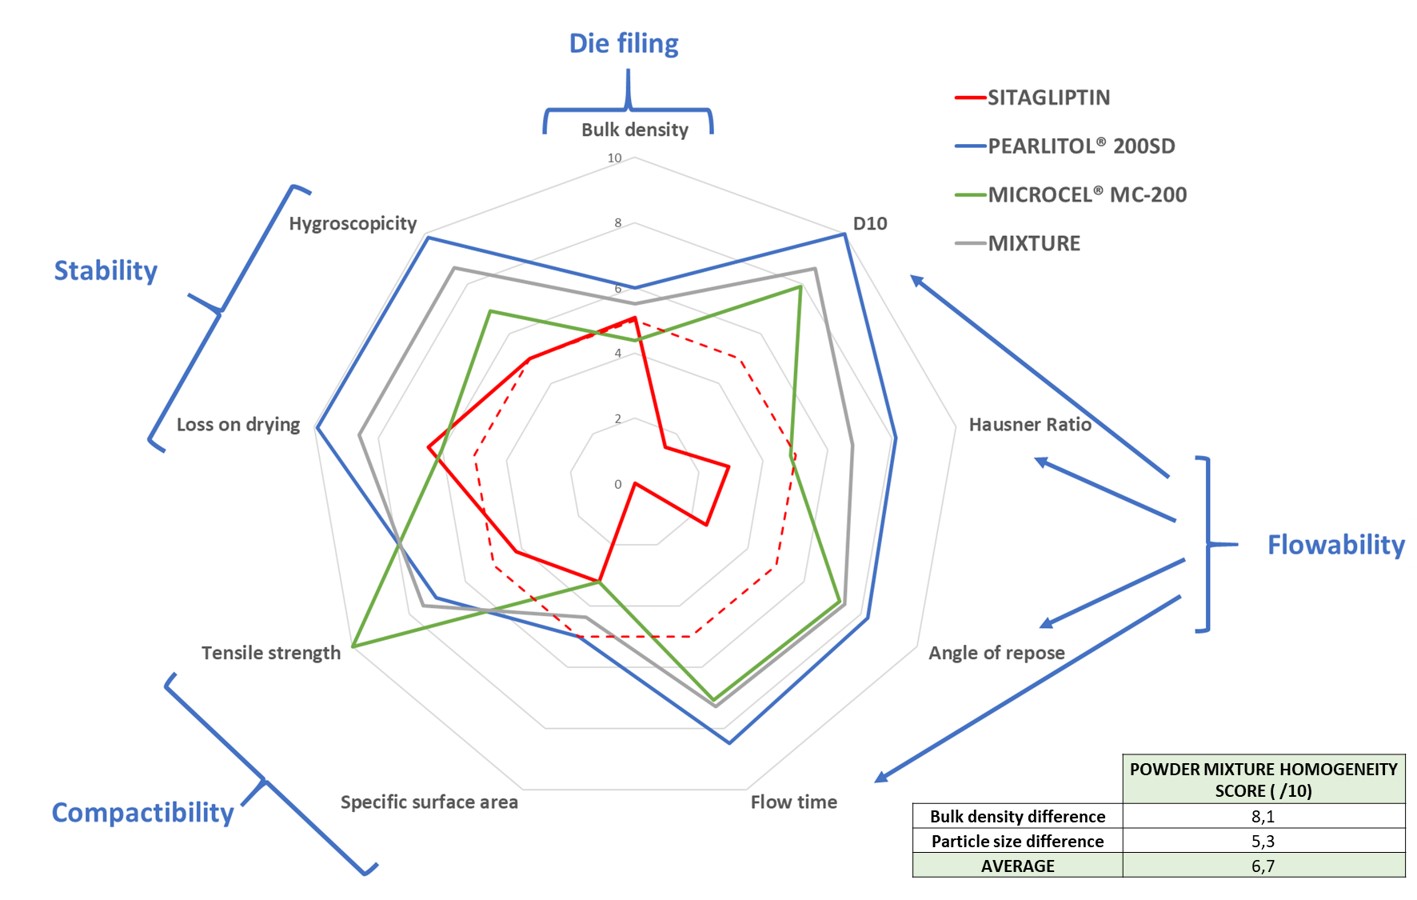
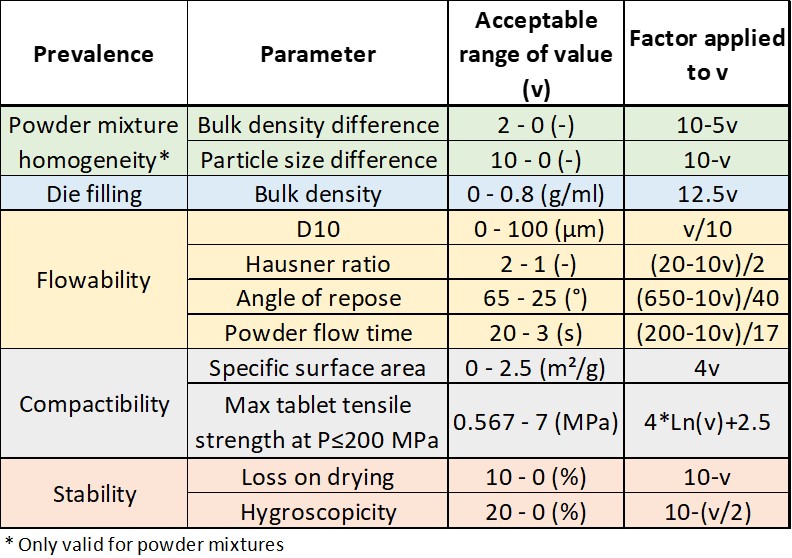
Results: We have selected 11 parameters under five categories; each category corresponds to an important step in the overall powder tabletability fig.1. For each parameter, an acceptable range of values is defined and is expressed on 0 to 10 scale. The measured values (v) and calculated radii are shown in table 1. After conversion on a 0 to 10 scale according to factors presented in table 1, each component of a powder mixture can be represented on a spider plot (figure 2). Depending on the mass ratio of the components, the behavior of the mixture can be calculated (grey line in figure 2). To assess prediction accuracy of the mixture behavior in DC, theoretical and experimental values are plotted on the same graph (figure 3). It clearly appears on figure 3 that the performances of the studied ternary mixture (API/mannitol/MCC) are well predicted by the mode. The mean scores are almost identical (7.1/10 predicted vs 6.8/10 measured. This difference is mainly explained by a slight overestimation of the tensile strength
Conclusion: The computational physics criteria presented here enable better prediction of powder mixture behavior in direct compression. It is based on the SeDeM system with improvement on several aspects. It first introduces specific surface area (associated with compactibility) and homogeneity index of powder mixtures. It does not take into consideration tap density (not connected to tabletability) and selected Hausner ratio over Carr index due to their opposite contribution to the overall evaluation. Finally, realistic ranges of acceptability for studied parameters were defined to better represent experimental values.
References: 1. Pérez, Pilar, Josep M. Suñé-Negre, Montserrat Miñarro, Manel Roig, Roser Fuster, Encarna García-Montoya, Carmen Hernández, Ramón Ruhí, and Josep R. Ticó. “A new expert system (SeDeM Diagram) for control batch powder formulation and preformulation drug products.” European journal of pharmaceutics and biopharmaceutics 64, no. 3 (2006): 351-359.
2. Suñé-Negre, Josep M., Pilar Pérez-Lozano, Montserrat Miñarro, Manel Roig, Roser Fuster, Carmen Hernández, Ramon Ruhí, Encarna García-Montoya, and Josep R. Ticó. “Application of the SeDeM Diagram and a new mathematical equation in the design of direct compression tablet formulation.” European journal of pharmaceutics and biopharmaceutics 69, no. 3 (2008): 1029-1039.
3. BASF ZoomLab https://info-mypharma.basf.com/
Figure 1. Parameters influencing the overall powder tabletability grouped in five categories, related either to the processability or to the quality of the formula
Figure 2. Spider plot representation of single powders parameters and predicted behavior of the mixture of those powders (composition of the mix: 10% Sitagliptin, 65% PEARLITOL® 200 SD, 25% MICROCEL® MC-200). Predicted mean score for mixture = 7.1/10. Bottom right table indicated the homogeneity score of the mixture.
Table 1. Definition of the acceptable range of values (v) for each parameter. The factor to express the value on a 0 to 10 scale in indicated
