Back
Purpose: The reversible introduction of a phosphate ester moiety renders drug molecules significantly more water soluble. Upon dissolution in the intestinal lumen and cleavage by phosphate esterases, the prodrug is converted back to the pharmacologically active parent compound of limited solubility, a process, which may lead to supersaturation and enhanced absorption. A prominent commercial example of such a prodrug is fosamprenavir, which is cleaved into HIV protease inhibitor amprenavir. Our aim was to test a cell-free in vitro tool consisting of an artificial biomimetic barrier and microdialysis sampling for its potential use to follow the dissolution/bioconversion/permeation kinetics of fosamprenavir.
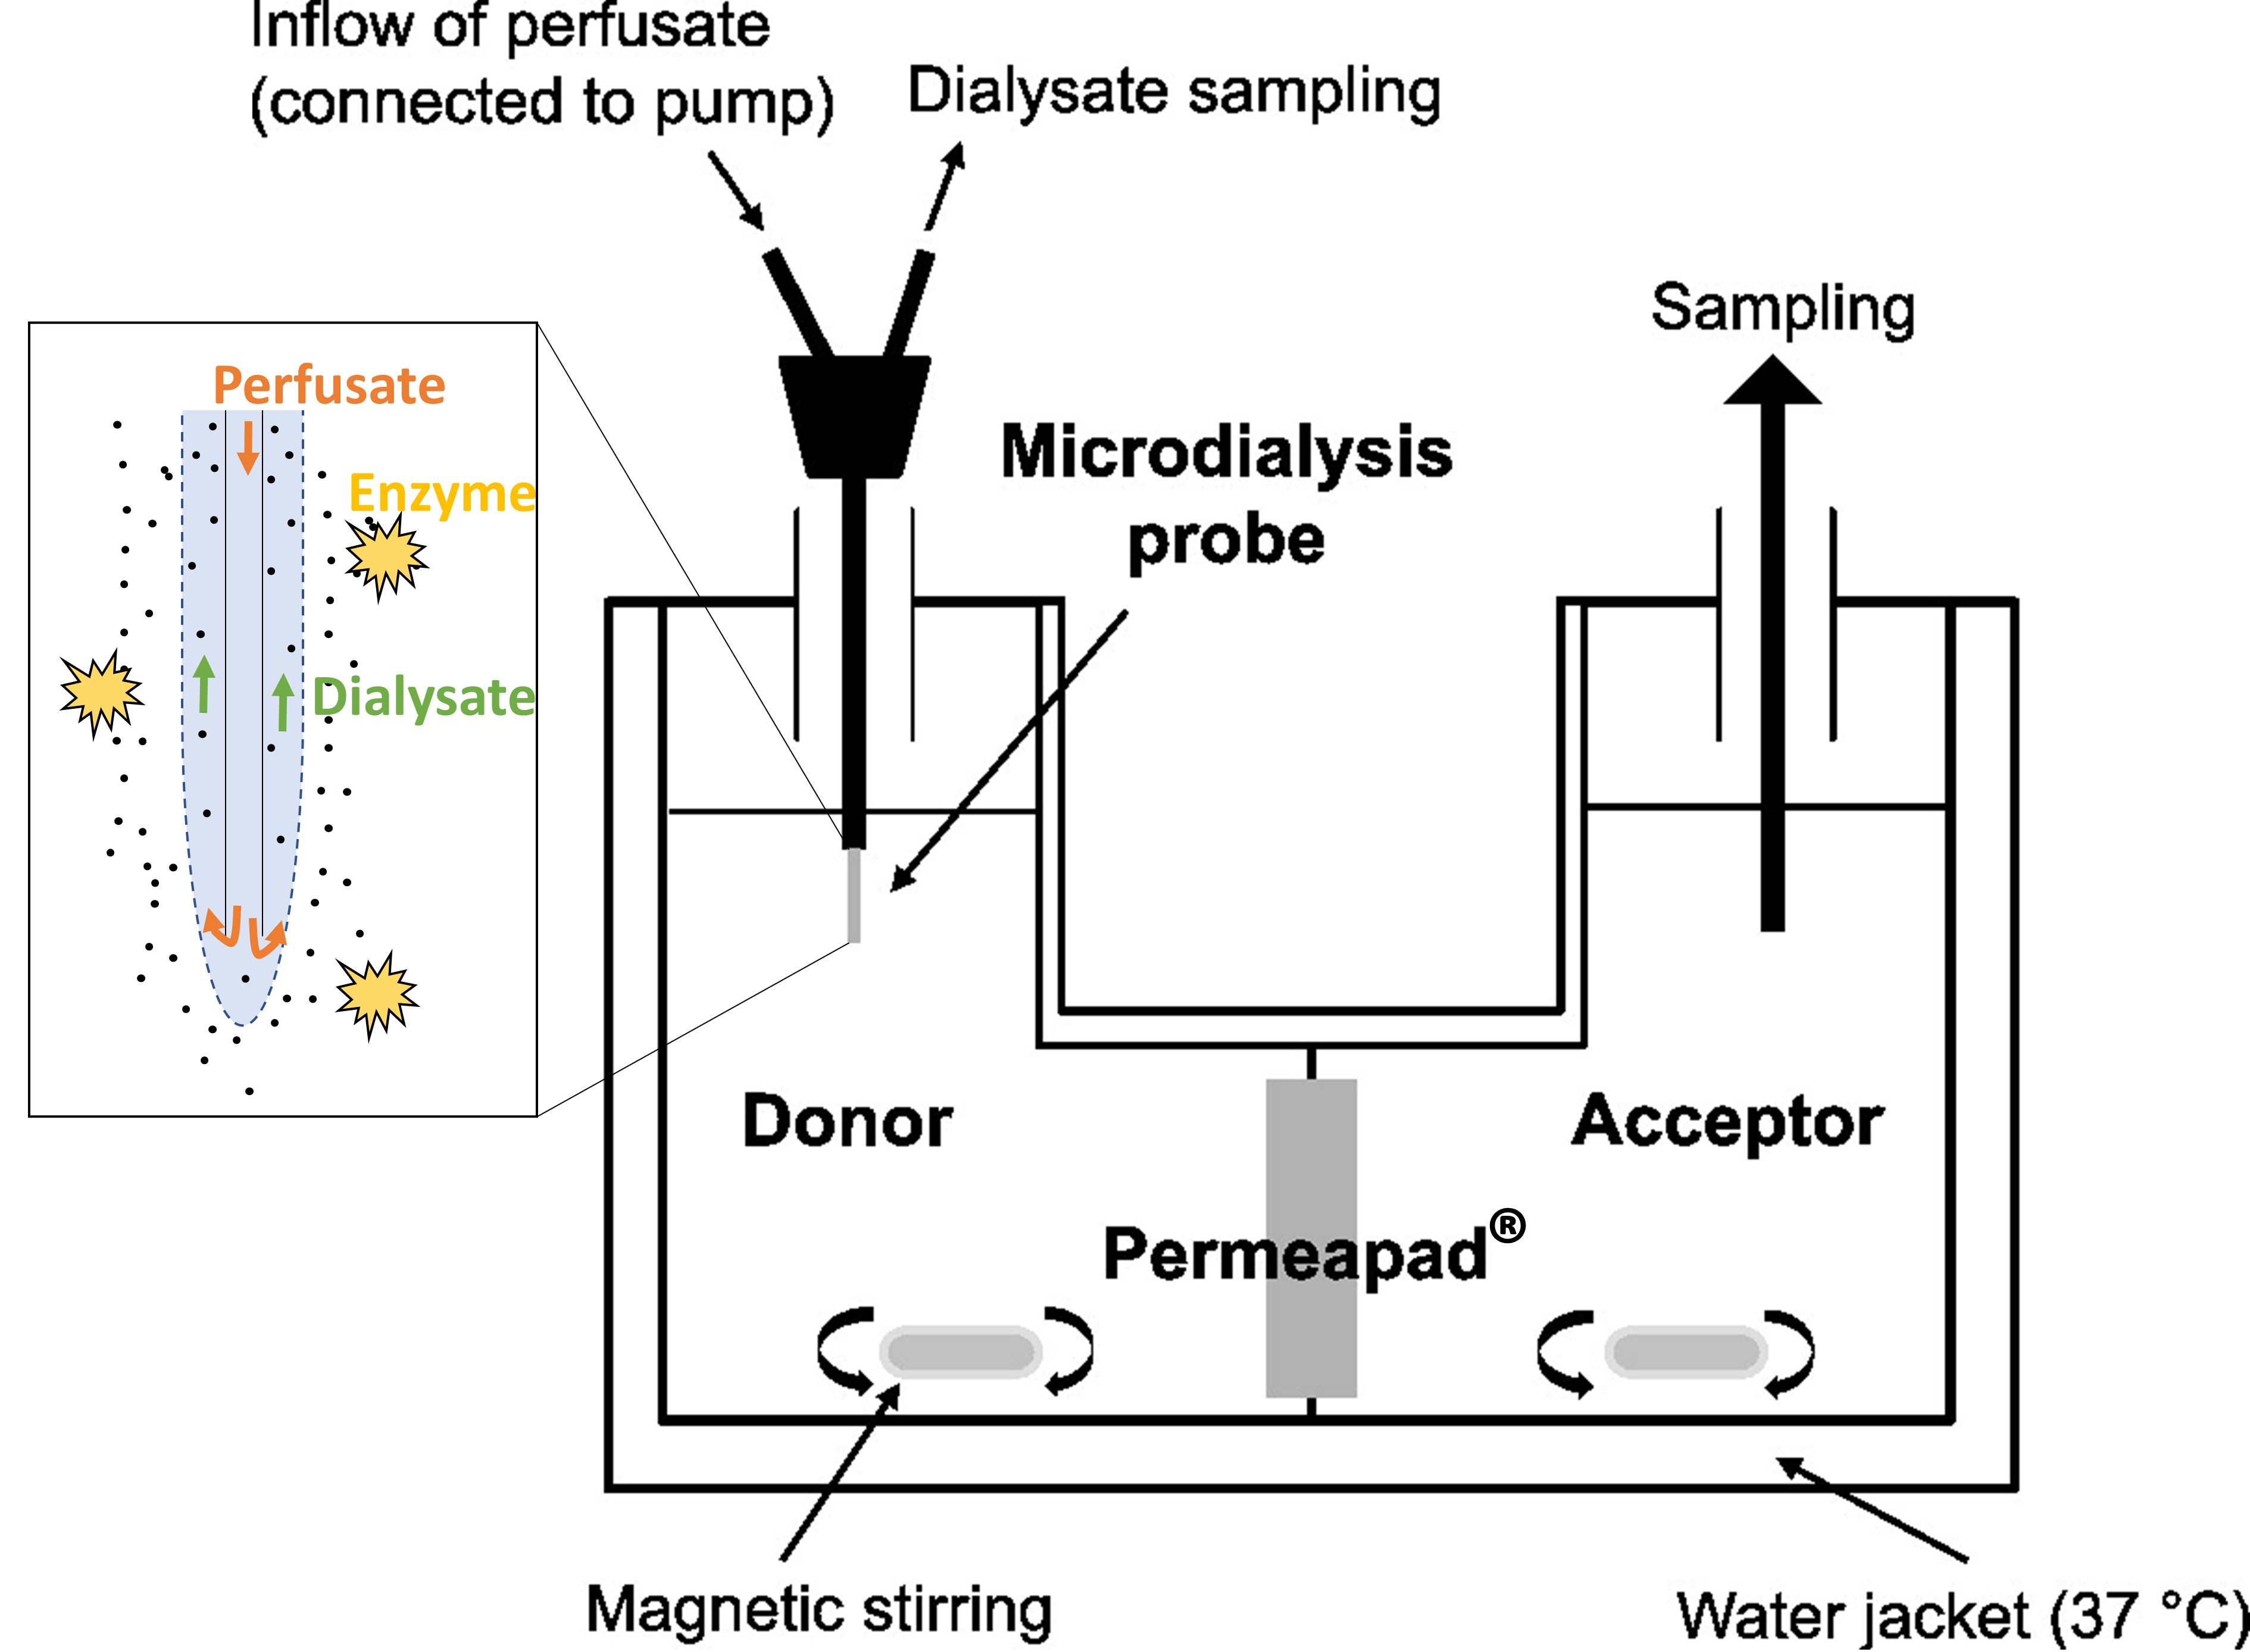
Methods: Figure 1 shows the set-up. PermeaPad® is a commercial sandwich barrier consisting of two cellulose membranes, which enclose a layer of phospholipids; the latter form lipid vesicles upon contact with water. Microdialysis is a sampling tool with a hollow-fiber dialysis membrane perfused at a constant rate with a collection medium. Under appropriate conditions and upon calibration, one can accurately follow the (unbound) drug concentration in almost real-time by determining the concentrations within the dialysate. The novel set-up was used to evaluate and compare the dissolution-/permeation-behavior of (saturated) amprenavir suspensions with the dissolution-/bioconversion-/permeation-behavior of fosamprenavir solutions/suspensions in the presence of bovine alkaline phosphatase. During the experiments, the donor was sampled with the microdialysis in ten-minute intervals over 180 min and the acceptor was directly sampled after 30, 60, 90, 120, and 180 min. Hank’s balanced salt solution (HBSS) was used as donor medium and HBSS + 0.2 % vitamin E TPGS as acceptor medium and microdialysis perfusate. At appropriate time points, fosamprenavir and amprenavir were quantified in donor (upon microdialysis sampling) and acceptor by ultra-high-performance liquid chromatography.
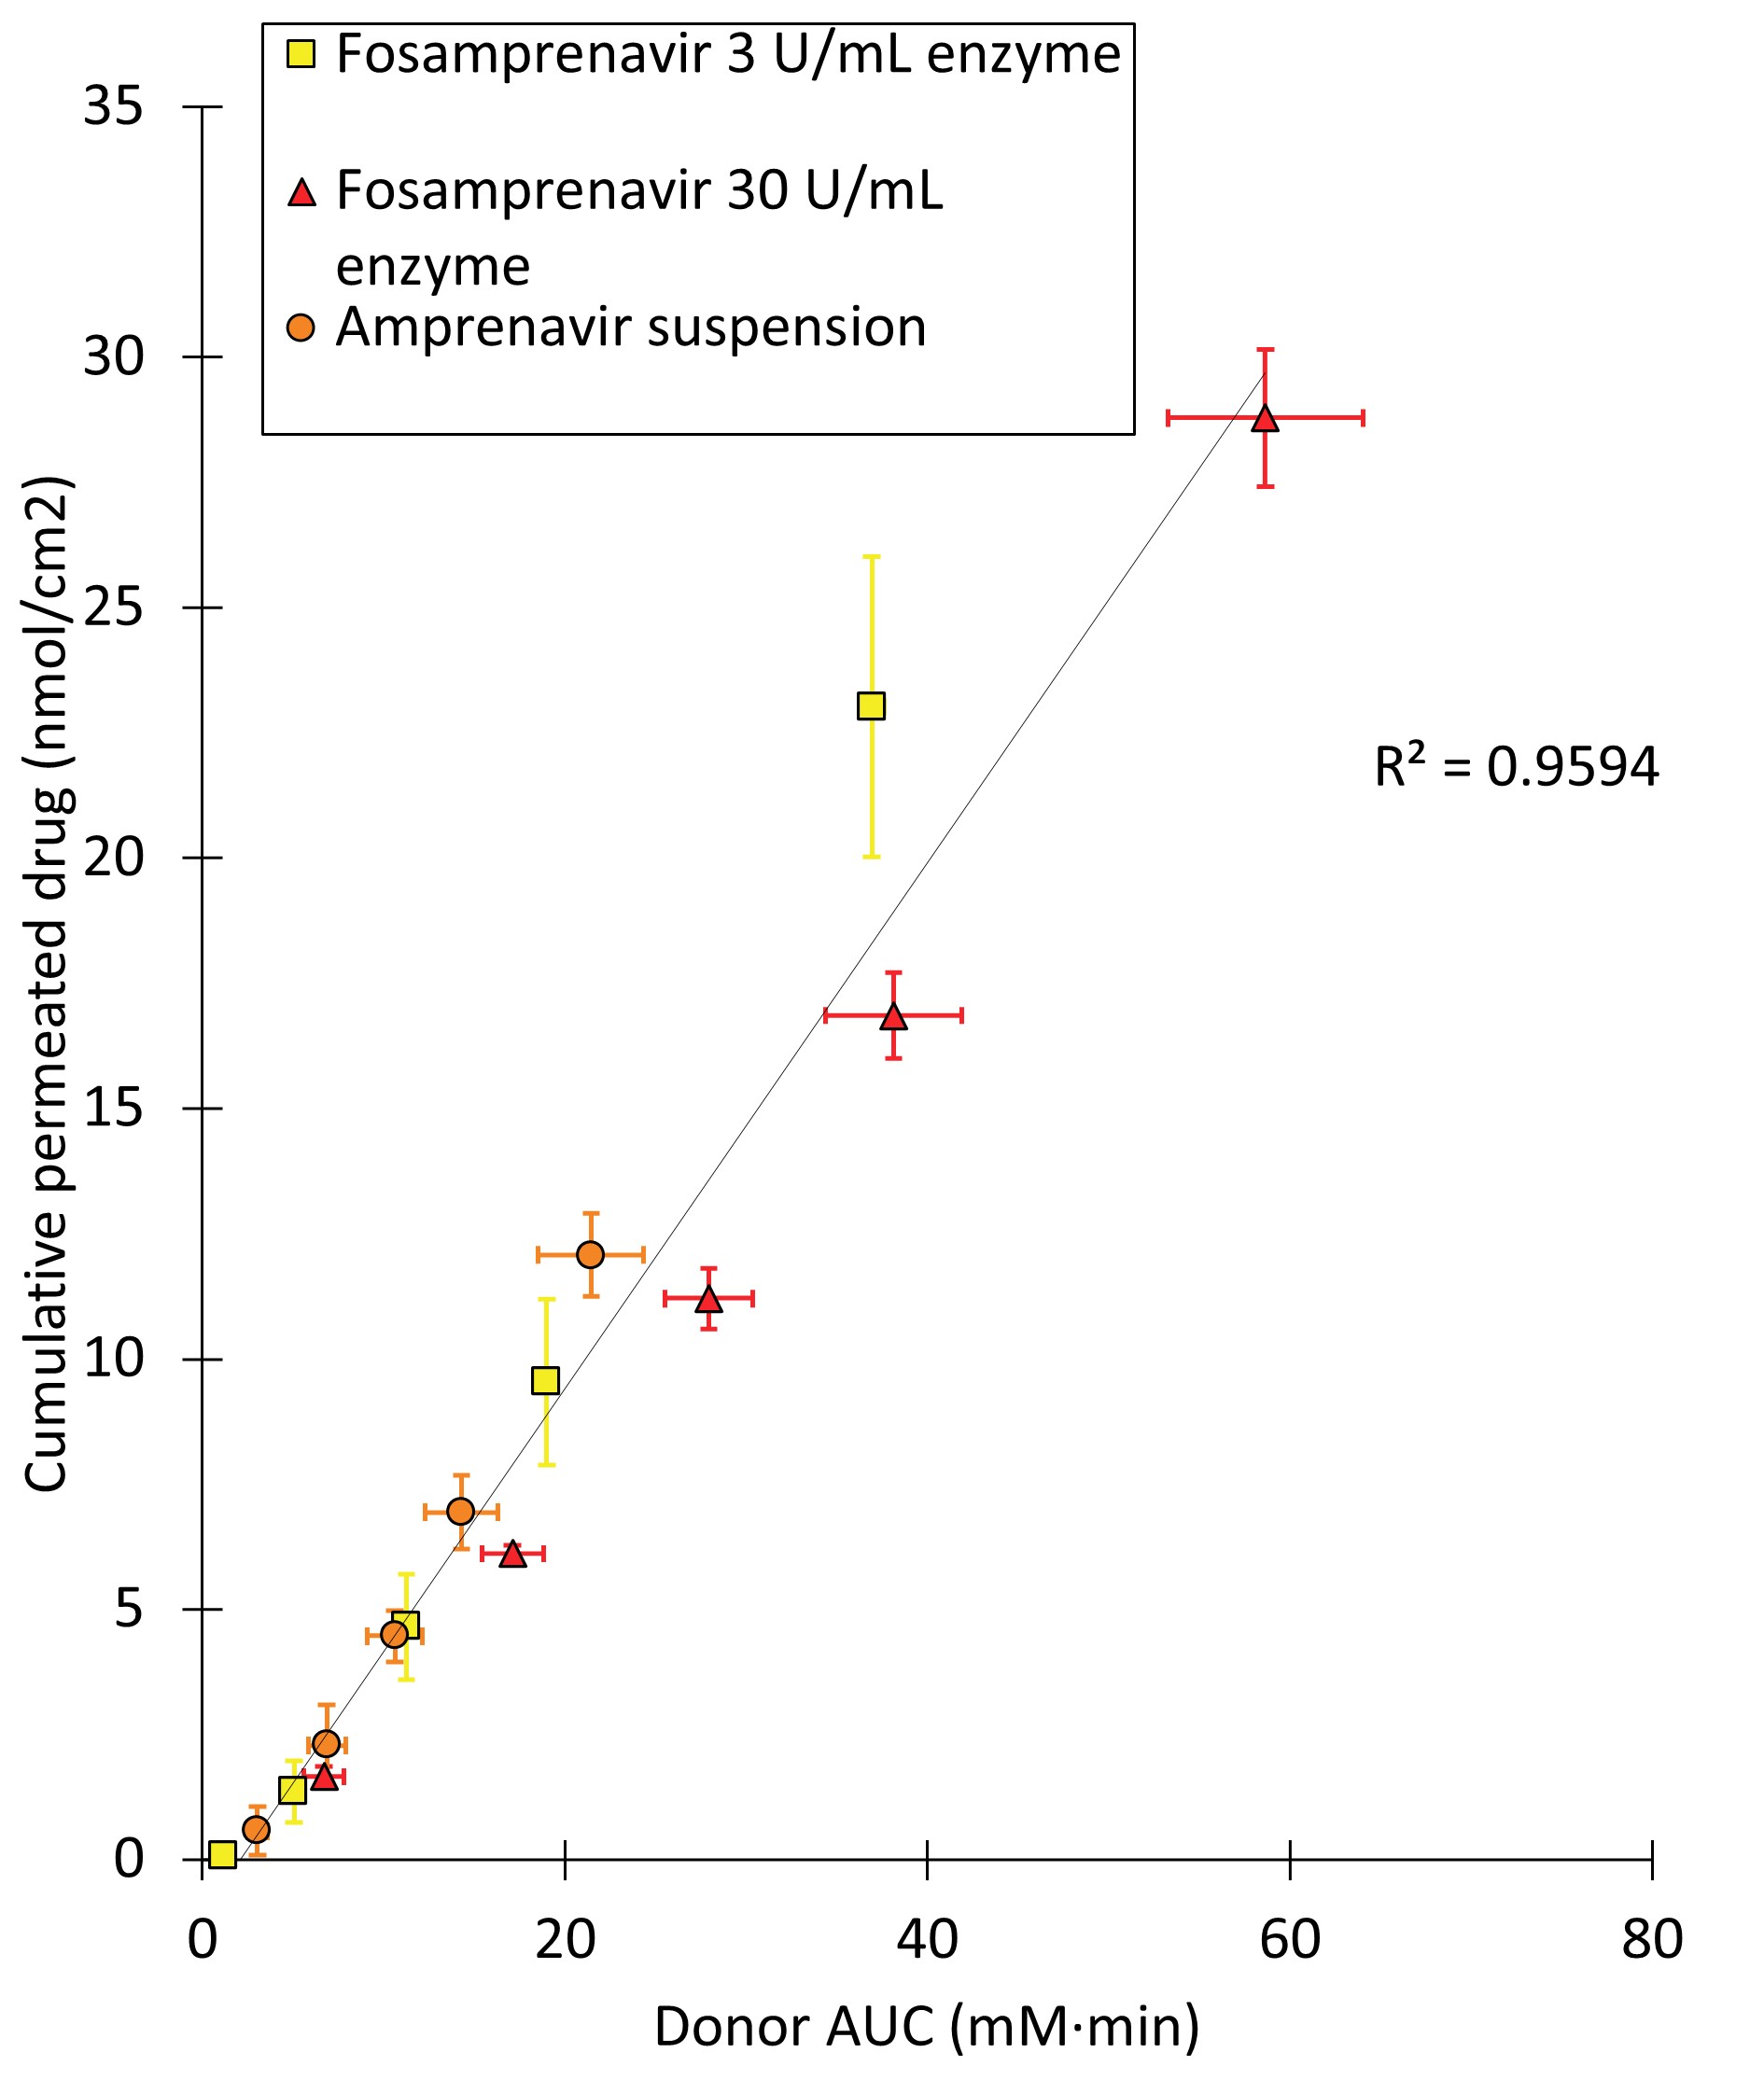
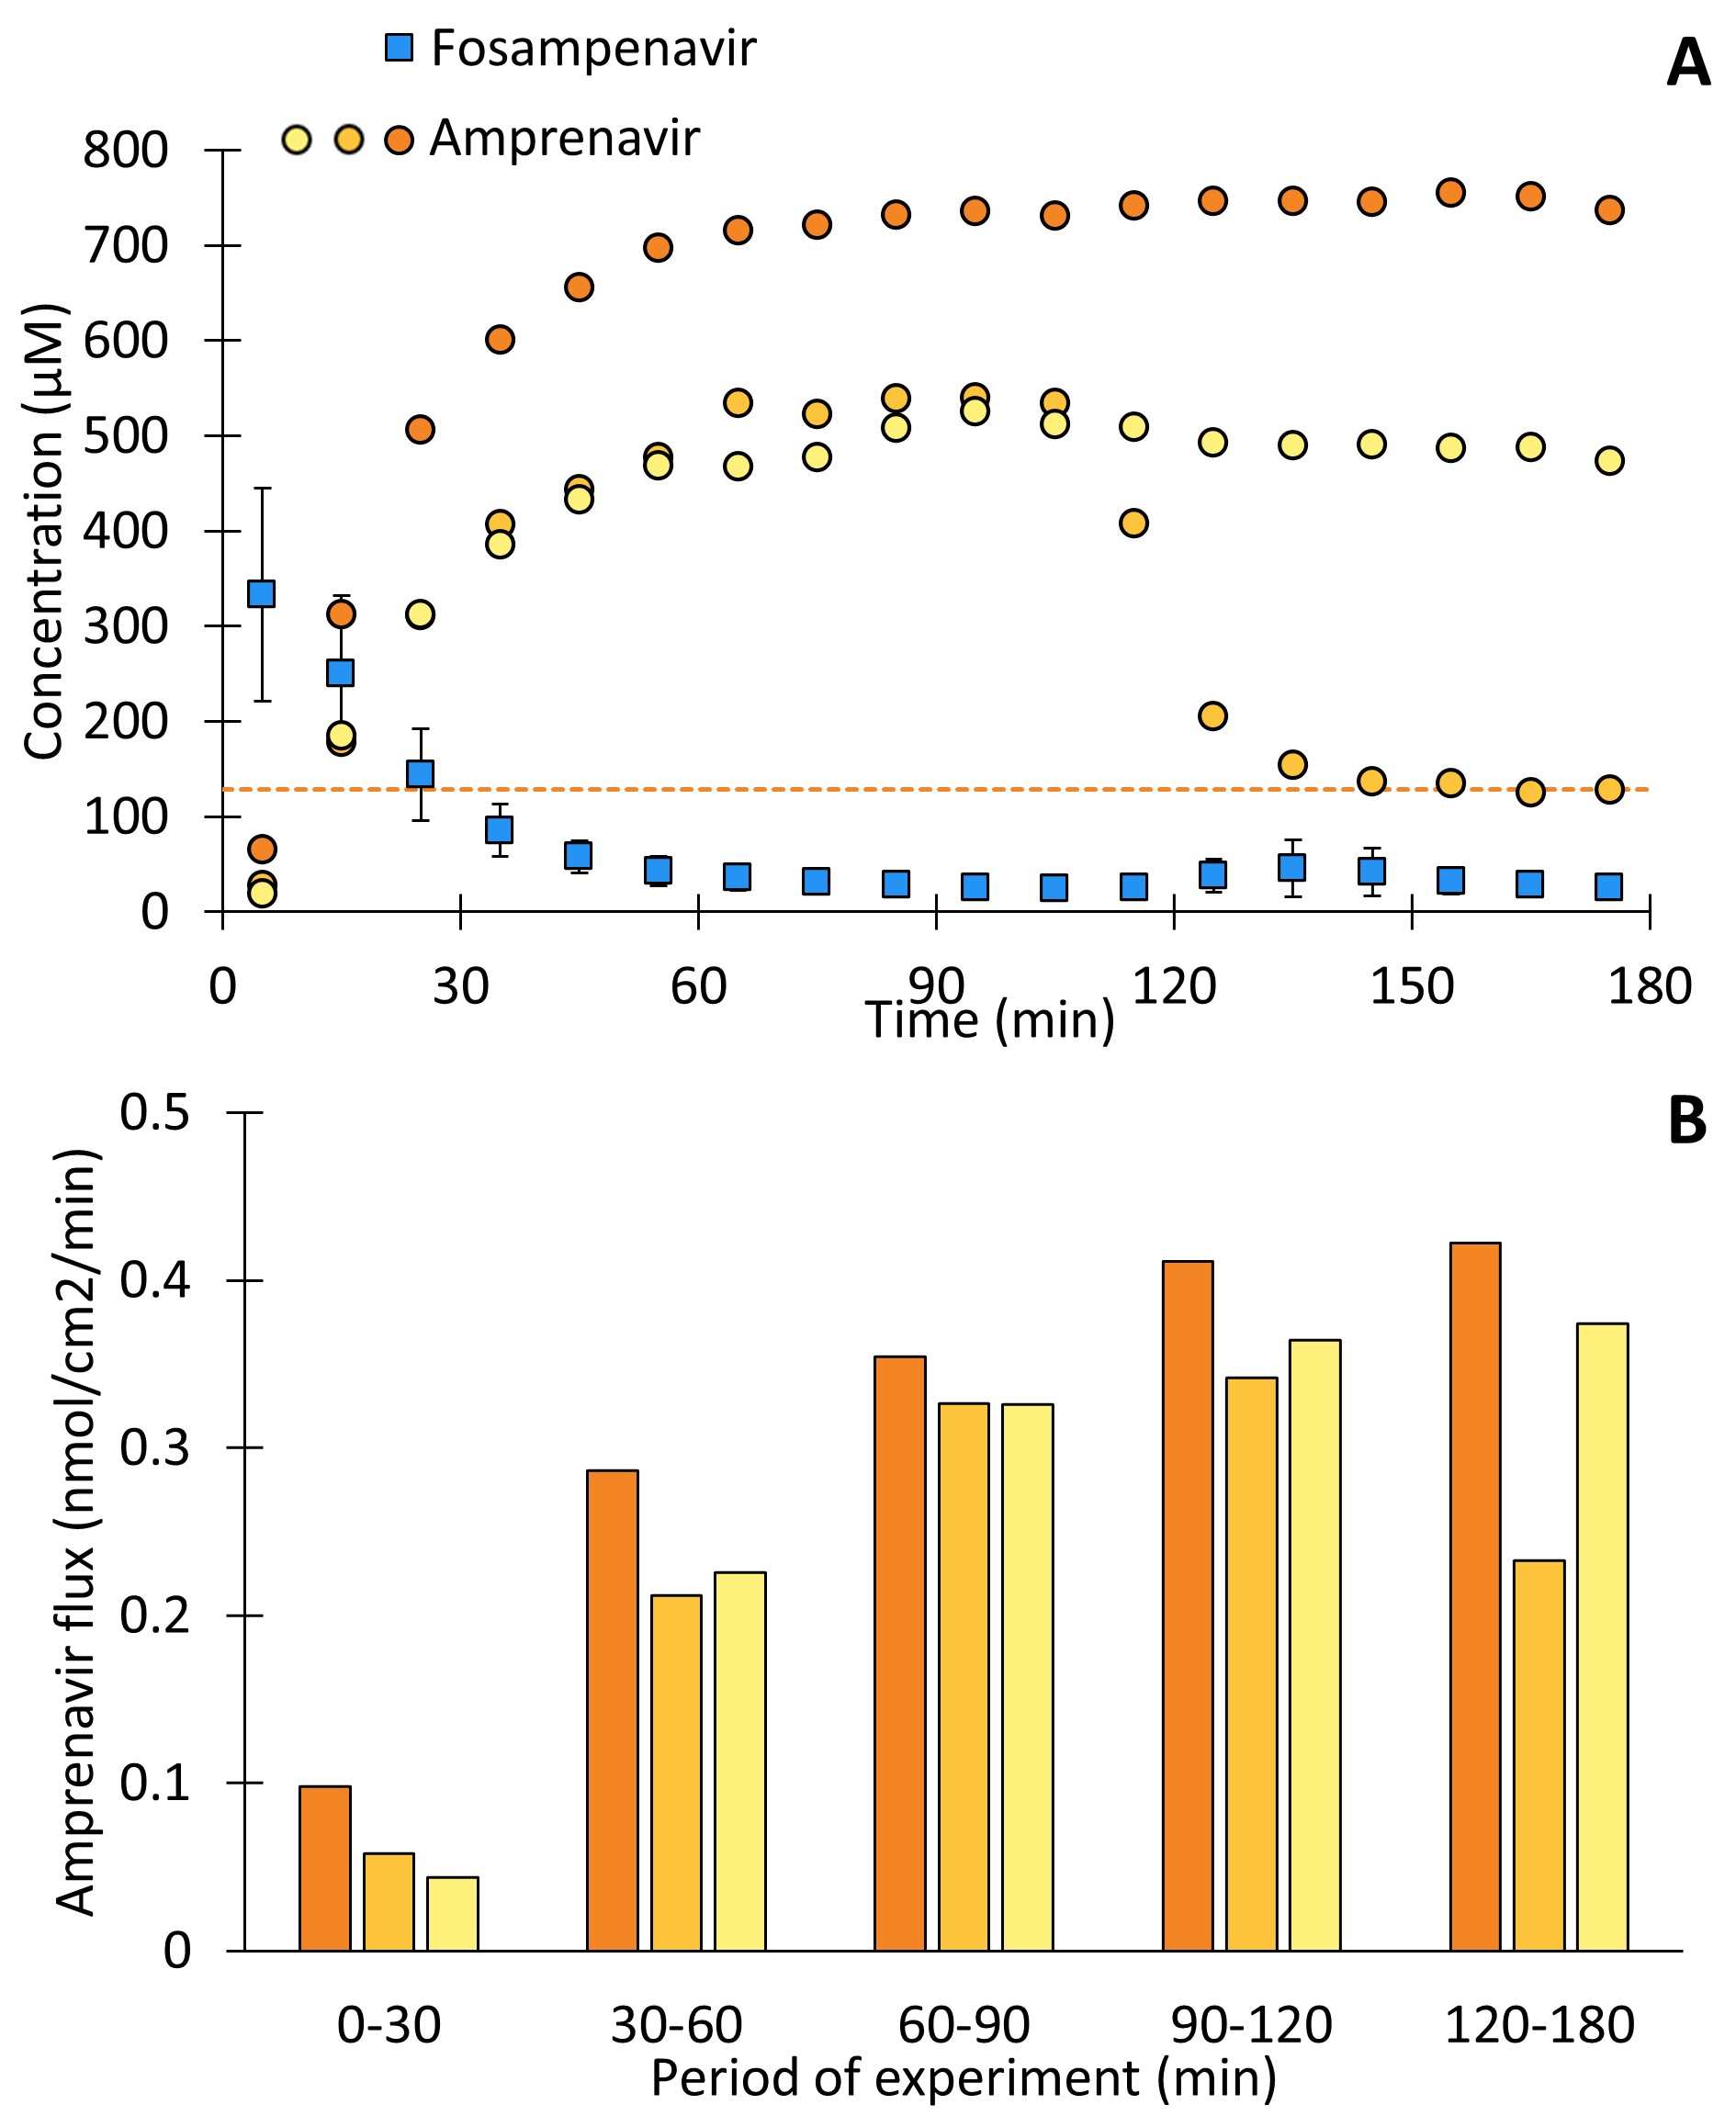
Results: An excellent correlation was observed between the permeated amount of amprenavir and its concentration in the donor over time as a result of bioconversion (Figure 2). Noticeably amprenavir permeation resulting from fosamprenavir solutions exceeds the saturated amprenavir suspension. This was due to amprenavir concentrations in the donor exceeding the 128 µM solubility limit in HBSS i.e. supersaturation occurring after 9 and 45 min for. The bovine alkaline phosphatase (120-140 kDa) did not permeate the microdialysis with a 20 kDa cut-off, which was found as fosamprenavir AUC did not change with reinjection of dialysate samples from bioconversion studies after 24 h (data not shown). In experiments with therapeutically relevant fosamprenavir concentrations (i.e. suspensions), the three replicates showed variable behavior (Figure 3) with regard to dissolution-/bioconversion profiles. One of the three replicates precipitated during the study while the two other supersaturations were stable over the three-hour course of the experiment. The flux of amprenavir across the barrier correlated well with measured donor concentrations over time for all three replicates at all time intervals.
Conclusion: Microdialysis was established as a tool to easily and accurately follow dissolution and bioconversion of fosamprenavir simultaneously. A pronounced supersaturation induced by bioconversion could be demonstrated, which nicely correlated with enhanced permeation of amprenavir. The novel set-up proposed here allows for detailed insights into the micro kinetics of the underlying inter-related processes of dissolution, enzymatic cleavage, and permeation.
Acknowledgments: NordicPOP (supported by NordForsk for the Nordic University Hub project number: 85352).
Boehringer Ingelheim GmbH for financing the Ph.D. of Jonas Borregaard Eriksen.
Lab technician Tina Christiansen for practical support.

Figure 1: Illustration of the experimental set-up used in the study.

Figure 2: The correlation between the measured area under the curve (AUC) in the donor of dissolved amprenavir and total permeated amprenavir across PermeaPad® in studies with a 500 µM amprenavir suspension or 500 µM fosamprenavir solutions in presence of 3 or 30 U/mL bovine alkaline phosphatase. Data are plotted as mean ± SD (n=3)

Figure 3: A dissolution/bioconversion/experiment with 4500 µM fosamprenavir. A) the dissolved amprenavir and fosamprenavir in the donor. B) the flux of amprenavir across PermeaPad® in each period of the experiment. Amprenavir is plotted as each individual replicate with a corresponding color code between the figures. Fosamprenavir is plotted as mean ± SD (n=3). The dotted orange line indicates the solubility of amprenavir.
Formulation and Delivery - Chemical - Biopharmaceutics
Category: Late Breaking Poster Abstract
(T1430-03-14) In Vitro Permeation Studies Combined with Microdialysis Sampling Allow Mechanistic Insights into the Dynamic Dissolution-/ Bioconversion-/ Permeation-Behavior of the Prodrug Fosamprenavir
Tuesday, October 18, 2022
2:30 PM – 3:30 PM ET
- JE
Jonas Eriksen
University of Southern Denmark
Odense M, Syddanmark, Denmark - JE
Jonas Eriksen
University of Southern Denmark
Odense M, Syddanmark, Denmark
Presenting Author(s)
Main Author(s)
Purpose: The reversible introduction of a phosphate ester moiety renders drug molecules significantly more water soluble. Upon dissolution in the intestinal lumen and cleavage by phosphate esterases, the prodrug is converted back to the pharmacologically active parent compound of limited solubility, a process, which may lead to supersaturation and enhanced absorption. A prominent commercial example of such a prodrug is fosamprenavir, which is cleaved into HIV protease inhibitor amprenavir. Our aim was to test a cell-free in vitro tool consisting of an artificial biomimetic barrier and microdialysis sampling for its potential use to follow the dissolution/bioconversion/permeation kinetics of fosamprenavir.
Methods: Figure 1 shows the set-up. PermeaPad® is a commercial sandwich barrier consisting of two cellulose membranes, which enclose a layer of phospholipids; the latter form lipid vesicles upon contact with water. Microdialysis is a sampling tool with a hollow-fiber dialysis membrane perfused at a constant rate with a collection medium. Under appropriate conditions and upon calibration, one can accurately follow the (unbound) drug concentration in almost real-time by determining the concentrations within the dialysate. The novel set-up was used to evaluate and compare the dissolution-/permeation-behavior of (saturated) amprenavir suspensions with the dissolution-/bioconversion-/permeation-behavior of fosamprenavir solutions/suspensions in the presence of bovine alkaline phosphatase. During the experiments, the donor was sampled with the microdialysis in ten-minute intervals over 180 min and the acceptor was directly sampled after 30, 60, 90, 120, and 180 min. Hank’s balanced salt solution (HBSS) was used as donor medium and HBSS + 0.2 % vitamin E TPGS as acceptor medium and microdialysis perfusate. At appropriate time points, fosamprenavir and amprenavir were quantified in donor (upon microdialysis sampling) and acceptor by ultra-high-performance liquid chromatography.
Results: An excellent correlation was observed between the permeated amount of amprenavir and its concentration in the donor over time as a result of bioconversion (Figure 2). Noticeably amprenavir permeation resulting from fosamprenavir solutions exceeds the saturated amprenavir suspension. This was due to amprenavir concentrations in the donor exceeding the 128 µM solubility limit in HBSS i.e. supersaturation occurring after 9 and 45 min for. The bovine alkaline phosphatase (120-140 kDa) did not permeate the microdialysis with a 20 kDa cut-off, which was found as fosamprenavir AUC did not change with reinjection of dialysate samples from bioconversion studies after 24 h (data not shown). In experiments with therapeutically relevant fosamprenavir concentrations (i.e. suspensions), the three replicates showed variable behavior (Figure 3) with regard to dissolution-/bioconversion profiles. One of the three replicates precipitated during the study while the two other supersaturations were stable over the three-hour course of the experiment. The flux of amprenavir across the barrier correlated well with measured donor concentrations over time for all three replicates at all time intervals.
Conclusion: Microdialysis was established as a tool to easily and accurately follow dissolution and bioconversion of fosamprenavir simultaneously. A pronounced supersaturation induced by bioconversion could be demonstrated, which nicely correlated with enhanced permeation of amprenavir. The novel set-up proposed here allows for detailed insights into the micro kinetics of the underlying inter-related processes of dissolution, enzymatic cleavage, and permeation.
Acknowledgments: NordicPOP (supported by NordForsk for the Nordic University Hub project number: 85352).
Boehringer Ingelheim GmbH for financing the Ph.D. of Jonas Borregaard Eriksen.
Lab technician Tina Christiansen for practical support.

Figure 1: Illustration of the experimental set-up used in the study.

Figure 2: The correlation between the measured area under the curve (AUC) in the donor of dissolved amprenavir and total permeated amprenavir across PermeaPad® in studies with a 500 µM amprenavir suspension or 500 µM fosamprenavir solutions in presence of 3 or 30 U/mL bovine alkaline phosphatase. Data are plotted as mean ± SD (n=3)

Figure 3: A dissolution/bioconversion/experiment with 4500 µM fosamprenavir. A) the dissolved amprenavir and fosamprenavir in the donor. B) the flux of amprenavir across PermeaPad® in each period of the experiment. Amprenavir is plotted as each individual replicate with a corresponding color code between the figures. Fosamprenavir is plotted as mean ± SD (n=3). The dotted orange line indicates the solubility of amprenavir.
