Back
Poster, Podium & Video Sessions
Podium
PD15: Kidney Cancer: Epidemiology & Evaluation/Staging/Surveillance I
PD15-07: Renal Cell Carcinoma Paraneoplastic Syndrome Score: Construction and Validation
Friday, May 13, 2022
4:30 PM – 4:40 PM
Location: Room 245
Shady Soliman*, La Jolla, CA, Sabrina Noyes, Grand Rapids, MI, Margaret Meagher, Joel Rosenberg, Austin Leonard, Kevin Hakimi, Julia Yuan, Arman Walia, Ava Saidian, Fady Ghali, Juan Javier-Desloges, Devin Patel, Rana McKay, Ithaar Derweesh, La Jolla, CA, Brian Lane, Grand Rapids, MI
- SS
Podium Presenter(s)
Introduction: Paraneoplastic symptoms (PNS) are common in Renal Cell Carcinoma (RCC). However, PNS do not have a standardized definition. We sought to design and validate a prognostic index based on PNS for RCC.
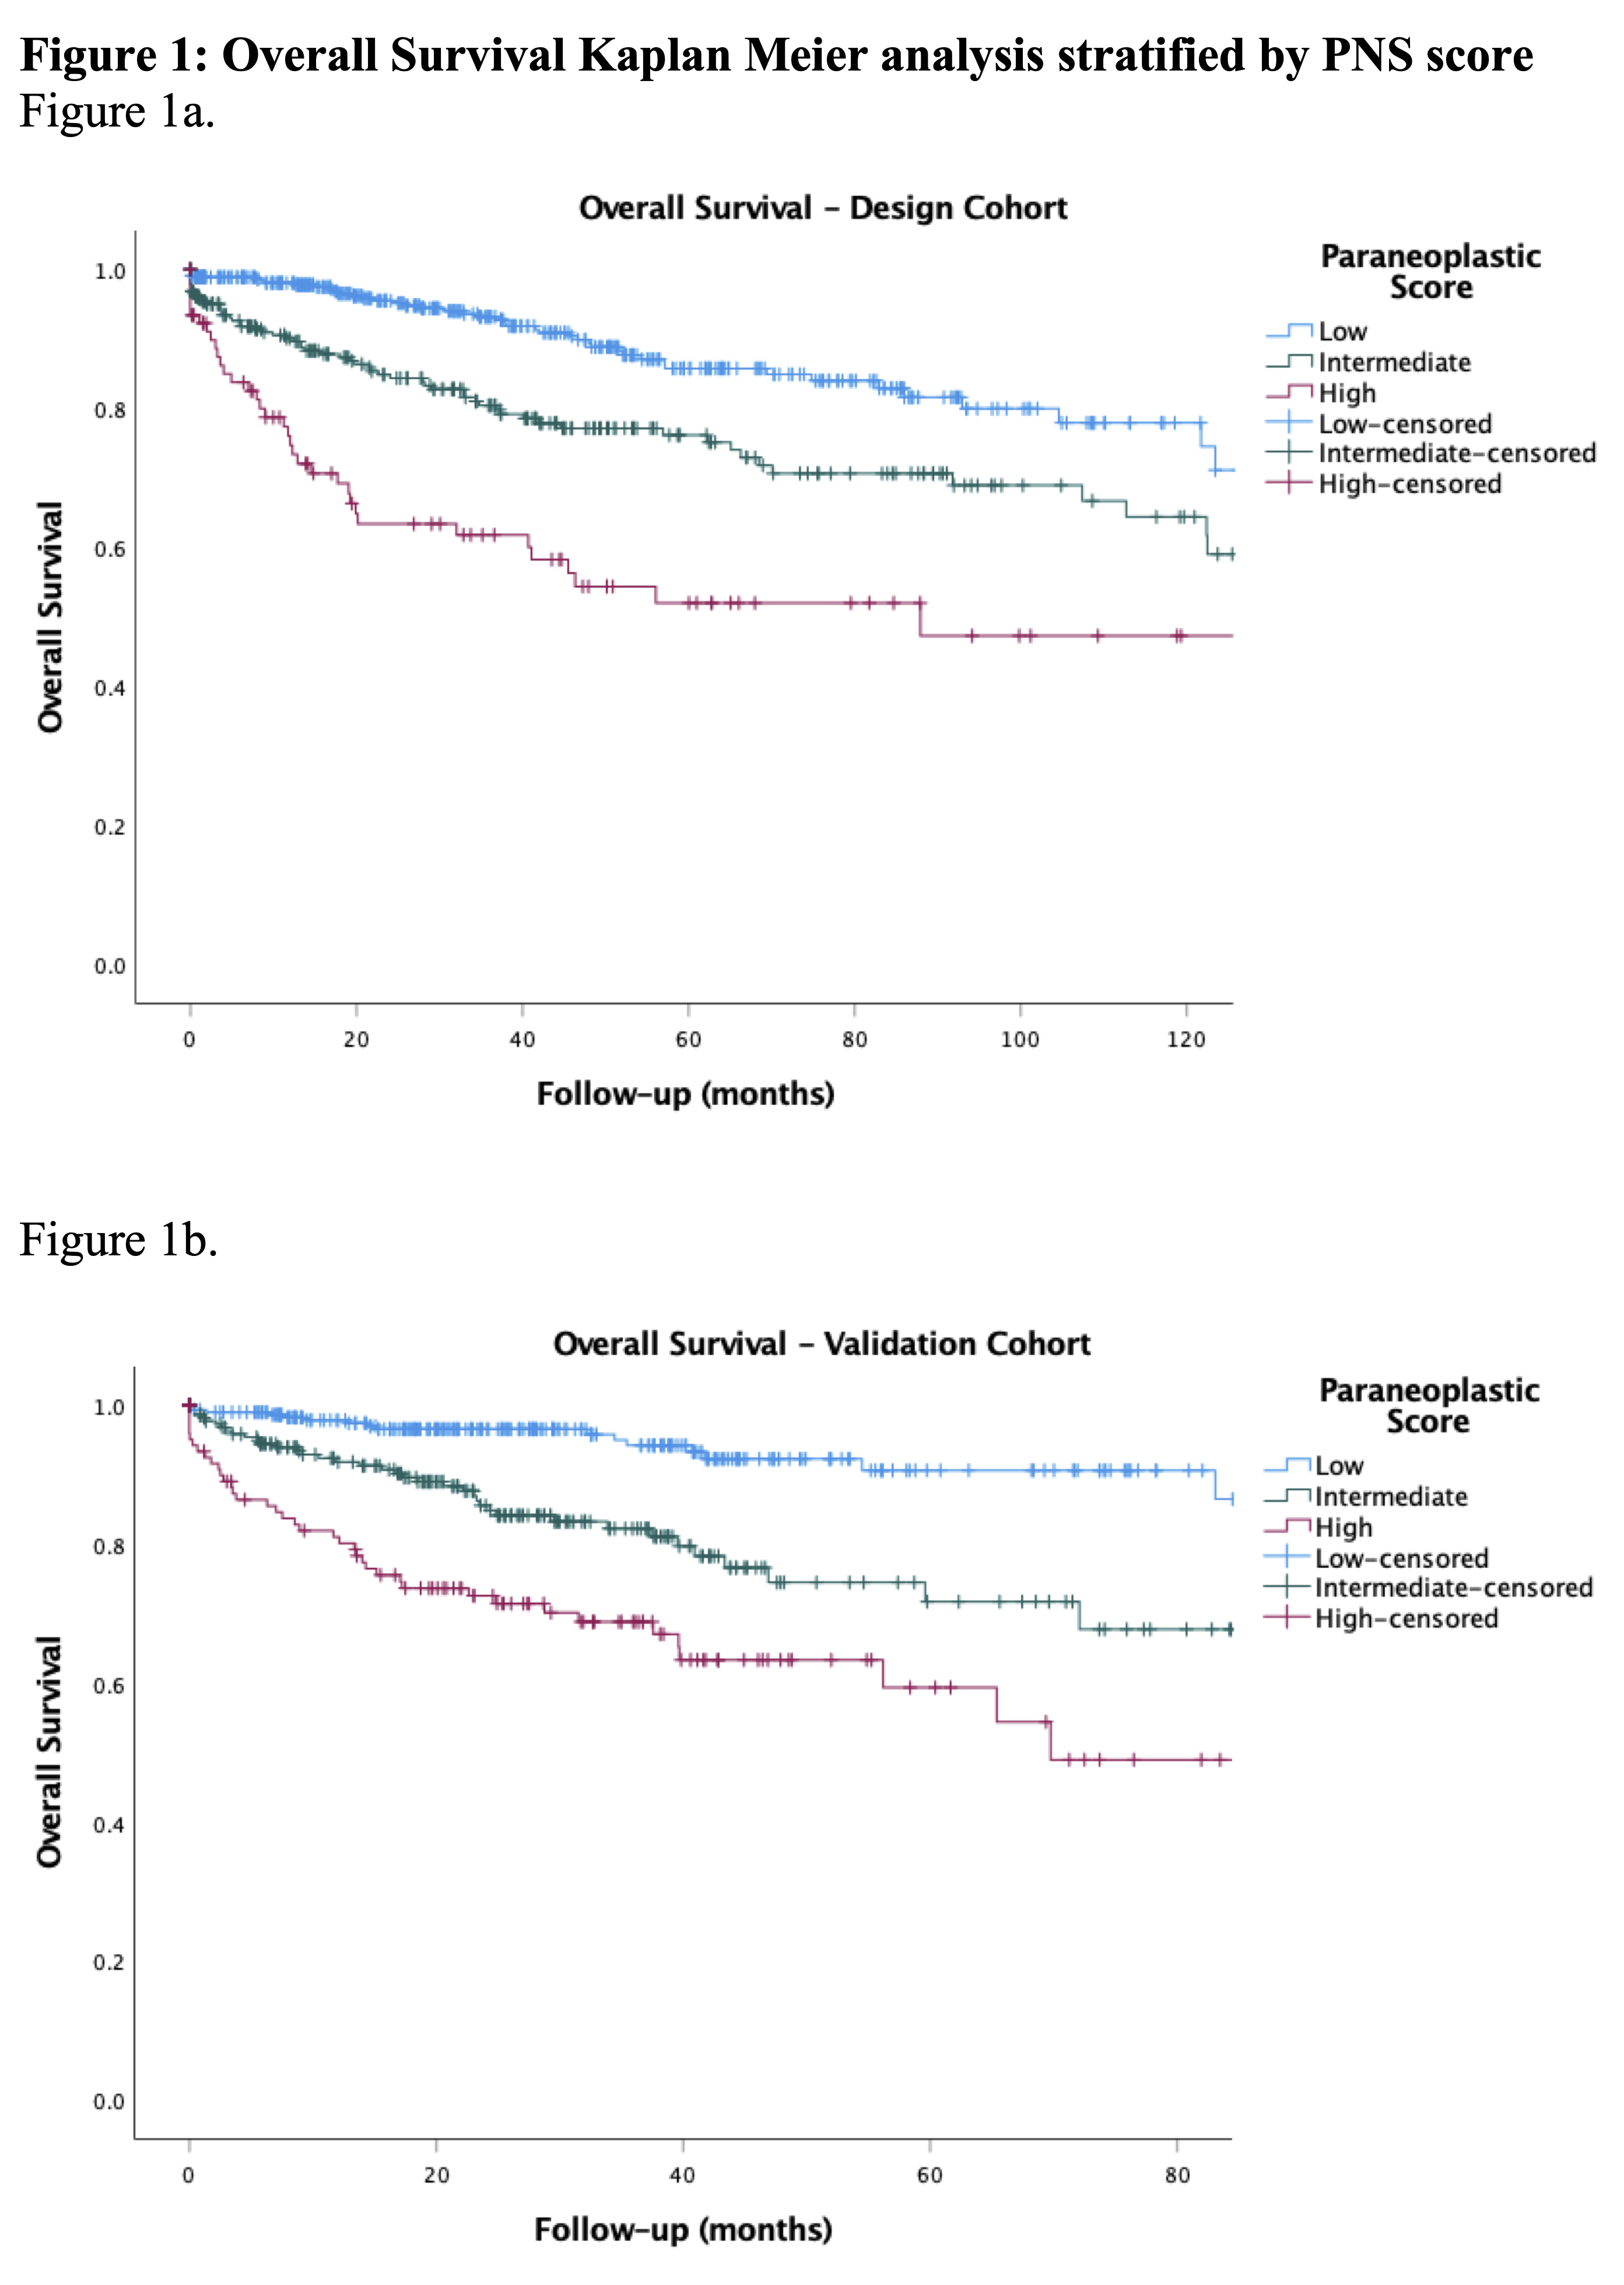
Methods: A retrospective single center cohort (UCSD Health, n=813) was used to design index and data from another center (Spectrum Health, n=694) for validation. Multivariable Cox regression analysis (MVA) was used to evaluate for association of symptoms and lab values with survival outcomes. Using these variables, we created a predictive model for oncological outcomes. We scored patients on a scale of 0-5 based on presence of these variables. We then stratified patients based on PNS scores into three cohorts, low (0), intermediate (1), and high (2-5). Primary outcome was overall survival (OS). Secondary outcomes were cancer specific survival (CSS) and progression free survival (PFS). Kaplan Meier analyses (KMA) was used for OS, CSS, and PFS. Receiver operating characteristic (ROC)/area under curve (AUC) analysis was used to evaluate predictive validity. External validation was then conducted via KMA and ROC/AUC analyses.
Results: MVA for factors associated with OS demonstrated unintentional weight loss >10lbs (p=0.001), hypoalbuminemia <3.4 g/dL (p=0.001), and De Ritis Ratio (AST/ALT>1.25; p<0.001). For CSS, hematuria (p=0.022) and De Ritis (p=0.002), and for PFS, fatigue (p=0.003), hypoalbuminemia (p=0.001), and De Ritis (p < 0.001) were predictive. PNS was constructed with hematuria, weight loss, fatigue, hypoalbuminemia, and De Ritis. Comparing low-, intermediate-, and high-PNS, KMA revealed low-PNS had higher 5-year OS (75% vs. 56% vs. 48%, p<0.001; Figure), CSS (91% vs. 88% vs. 68%, p<0.001) and PFS (82% vs. 64% vs. 70%, p<0.001). ROC analysis for OS, CSS and PFS revealed AUC of 0.66, 0.69, and 0.62. External validation had similar results comparing low-, intermediate-, and high-PNS: 5-year OS (87% vs. 62% vs. 45%, p<0.001; Figure), CSS (99% vs. 98% vs. 95%, p=0.055), and PFS (88% vs. 63% vs. 47%, p<0.001). ROC for OS, CSS, and PFS revealed AUC of 0.72, 0.66, and 0.72.
Conclusions: We developed and validated a novel standardized PNS score for RCC which predicts OS, PFS, and CSS. This index may aid in risk stratification for and be used to inform clinical decision making. More investigation is requisite.
Source of Funding: Stephen Weissman Kidney Cancer Research Fund


.jpg)
.jpg)