Back
Poster, Podium & Video Sessions
Kidney Cancer: Epidemiology & Evaluation/Staging/Surveillance II
PD18-03: Proposal for Reclassification of T1 and T2a Renal Cell Carcinoma: Results of a Multi-Institutional Analysis
Saturday, May 14, 2022
7:20 AM – 7:30 AM
Location: Room 255
Margaret Meagher*, Ava Saidian, San Diego, CA, Riccardo Autorino, Richmond, VA, Brian Lane, Grand Rapids, MI, Yasuhisa Fujii, Tokyo, Japan, Michele Marchioni, Chieti, Italy, Hajime Tanaka, Tokyo, Japan, Dattatraya Patil, Atlanta, GA, Francesco Porpiglia, Turin, Italy, Sabrina Noyes, Grand Rapids, MI, Ryan Nasseri, San Diego, CA, Chandru Sundaram, Indianapolis, IN, James Porter, Seattle, WA, Andrea Minervini, Florence, Italy, Umberto Capitanio, Francesco Montorsi, Milan, Italy, Viraj Master, Atlanta, Georgia, Ithaar Derweesh, San Diego, CA

Margaret Frances Meagher, MD
University of California San Diego
Podium Presenter(s)
Introduction: Outcomes of stage 1 renal cell carcinoma (RCC) are heterogeneous and vary widely. We sought to investigate whether re-alignment of T1 and T2 RCC would lead to a more rational consolidation of similar outcomes that may improve predictive ability of the T staging system.
Methods: We performed a retrospective multicenter analysis of patients undergoing radical (RN) or partial nephrectomy (PN) for pathologic T1-T2aN0M0 RCC. The cohort was divided into tumor size =2cm, >2 cm or <5cm, >5cm or <7 cm, and >7 or <10cm. Primary outcome was all-cause mortality (ACM)/overall survival (OS). Secondary outcomes were cancer-specific mortality (CSM)/cancer-specific survival (CSS) and recurrence/recurrence-free survival (RFS). Cox proportional hazards multivariable analysis (MVA) was used to elucidate predictive factors for ACM, CSM, and RFS. Kaplan Meier Analysis (KMA) was performed to analyze 5-year OS, CSS, and RFS. AUC/ROC analysis was utilized to compare the predictive capability of pT1 disease defined as <5cm and pT2a >5 and <10cm vs. the current pT1 <7cm and pT2a >7 and <10cm.
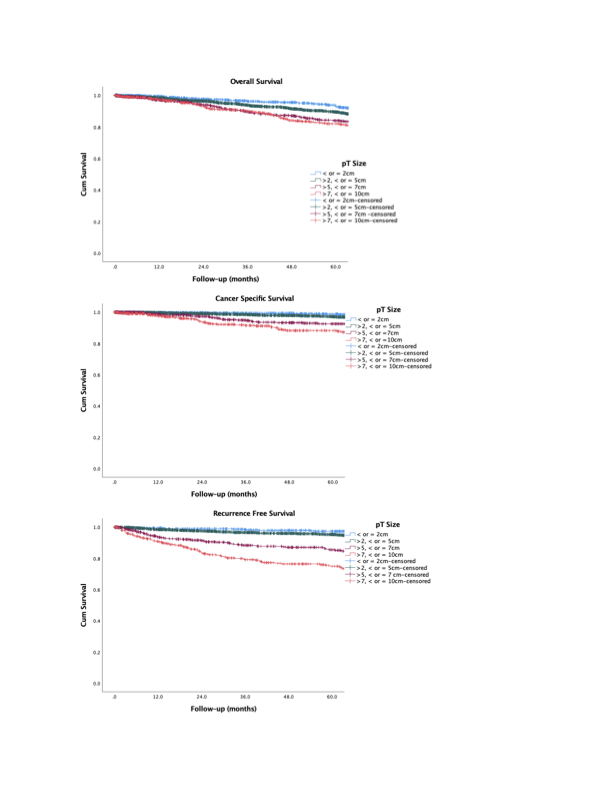
Results: 5126 patients were analyzed (median age 60.2 years, median follow-up 40.9 months). MVA demonstrated increasing pathologic tumor size [vs. <2 cm (referent)] to be independently associated with ACM [>5 to <7cm (HR 1.6, p=0.02), >7 to <10 cm (HR 1.9, p=0.004)], CSM [>7 to <10 cm (HR 4.1, p=0.002)] and recurrence pathologic tumor size [>5 to <7 cm (HR 4.9, p<0.001), >7 to <10 cm (HR 6.5, p<0.001)]. Comparing =2cm, >2 cm or <5cm, >5cm or <7 cm, and >7 or <10cm groups, KMA (Figure) revealed significantly worsened: 5-year OS with larger tumor size: (96% vs. 89% vs. 84%vs. 82%, respectively, p<0.001); 5-year CSS with larger tumor size (99% vs. 97% vs. 92% vs. 88%, respectively, p<0.001); and 5-year RFS with larger tumor size (97% vs. 95% vs. 86%, vs. 75%), p<0.001). AUC analysis revealed greater predictive power for proposed pT1 as <5cm and pT2 >5 and <10cm vs. the current pT1 <7cm and pT2 >7 and <10cm for OS (0.549 vs. 0.528), CSS (0.675 vs. 0.617), and RFS (0.681 vs. 0632).
Conclusions: Revision of T1 RCC into <5 cm and T2a into >5cm and <10cm groups corresponds to distinctive tumor groups whose biological potential aligns more closely and may enhance risk stratification, refine pretreatment counseling, and augment postoperative follow-up protocols.
Source of Funding: Stephen Weissman Kidney Cancer Research Fund


.jpg)
.jpg)