Back
Poster, Podium & Video Sessions
Moderated Poster
MP53: Prostate Cancer: Detection & Screening V
MP53-12: How do PSA-Based Markers Predict Clinically Significant Prostate Cancer (csPCa) on Prostate Biopsy Independent of Prostate Size
Monday, May 16, 2022
7:00 AM – 8:15 AM
Location: Room 225
Max Kuster*, Michelle Ou, Jacob Gaines, Eric Macdonald, Simon Hall, Lake Success, NY

Max Kuster, BA
Clinical Research Assistant
Poster Presenter(s)
Introduction: Both PSA density (PSAD) and PSA based makers (4k and PHI) are used to guide prostate biopsy decisions. In this study we examined the correlation between percent free PSA (%fPSA) and PSAD, as well as their potential combined use in determining csPCa risk.
Methods: We identified 331 patients from an IRB-approved prostate MRI database without a prior diagnosis of prostate cancer, who had an mpMRI, %fPSA and PSAD at the time of imaging, and a subsequent prostate biopsy within 1.5 years. The relationship between %fPSA and PSAD was analyzed using Pearson correlation. Logistic regression and ROC curves were used to test the diagnostic ability of %fPSA, PSAD, and %fPSA + PSAD. Detection rates of csPCa, defined as Gleason grade (GG) group =2, were compared among cohorts.
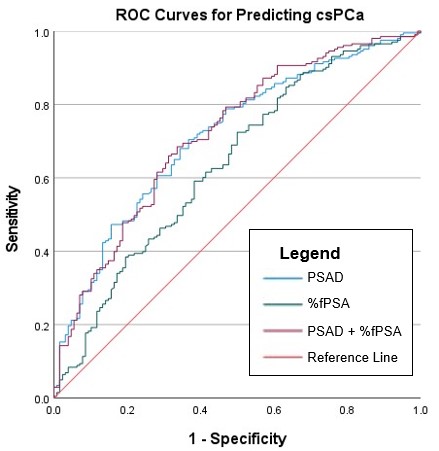
Results: The Pearson correlation coefficient for %fPSA and PSAD was -.349 (p < .001). ROC analysis predicting csPCa yielded an AUC of .712 for PSAD, .638 for %fPSA, and .718 for the combined PSAD+%fPSA model. We noted that there were “outliers” in terms of low %fPSA and low PSAD and vice versa. As such, we analyzed low risk (Cohort 1: %fPSA>20 and PSAD <0.15, N=54) and high risk (Cohort 2: %fPSA <10 and PSAD>0.15, N=79) groups against the restrictive associated “outlier” groups (Cohort 3: %fPSA>20 & PSAD>0.15, N=14 and Cohort 4: %fPSA <10 & PSAD <0.15, N=7). The low-risk cohort showed a csPCa rate of 25.9% while the high-risk cohort showed a rate of 74.7%, a significantly higher rate (p < .001). Cohort 3 showed a significantly higher csPCa rate and average GG group (78.6% and 2.64) than Cohort 1 (25.9% and 1.04, both p < .001). There were no significant differences in csPCa between the two low-%fPSA cohorts (2 and 4), the two high-PSAD cohorts (2 and 3), the two low-PSAD cohorts (1 and 4), or the two outlier cohorts (3 and 4).
Conclusions: This analysis notes an inverse correlation between PSAD and %fPSA and may explain the ability of PSA-based markers utilizing %fPSA to predict cancer risk independent of prostate size. The higher AUC of PSAD compared with %fPSA and the negligible change in diagnostic efficacy when adding %fPSA to a PSAD-based model suggest that PSAD is a more powerful metric than %fPSA for the prediction of csPCa.
Source of Funding: none


.jpg)
.jpg)