Back
Poster, Podium & Video Sessions
Podium
PD24: Urodynamics/Lower Urinary Tract Dysfunction/Female Pelvic Medicine: Neurogenic Voiding Dysfunction
PD24-10: Failure of Cost Containment in Neurogenic Bladder Care: Updated Analysis of the National Emergency Department Sample 2012-2017
Saturday, May 14, 2022
11:00 AM – 11:10 AM
Location: Room 245
Deepansh Dalela*, Detroit, MI, Hei-Kit Chan, Matthew Davis, Argyrios Stampas, Houston, TX, Humphrey Atiemo, Detroit, MI
- DD
Deepansh Dalela, MD
Fellow
Podium Presenter(s)
Introduction: A previous nationwide study (2006-2011) showed increasing utilization of emergency department (ED) by neurogenic bladder (NB) patients. The purpose of our current study was to provide a contemporary update for NB patients presenting to the ED, specifically focusing on the charges associated with these ED visits and utilization of imaging modalities.
Methods: National Emergency Department Sample (NEDS) 2012-2017 was used to identify NB patients presenting to the ED using International Classification of Disease (ICD) 9 (2012-2014) or 10 codes (2016-2017). Temporal trend in median ED charges per encounter, total ED charges (adjusted to 2014 USD) and utilization of imaging (computed tomography [CT] and ultrasonography of abdomen/pelvis [USG]) were analyzed using estimated annual percentage change (EAPC) methodology.
Results: Overall, 711,076 NB patients (median age 63) presented to the ED between 2012-2017 (excluding 2015). The most common underlying neurological condition was spinal cord injury and disease (51.2%), 21.4% had Charlson comorbidity index >=3, 85% had urinary tract infection (UTI) on presentation and 21.6% had associated sepsis or renal failure. About 65% had Medicare insurance, and ~50% presented to urban, teaching hospitals located primarily in South (~40%).
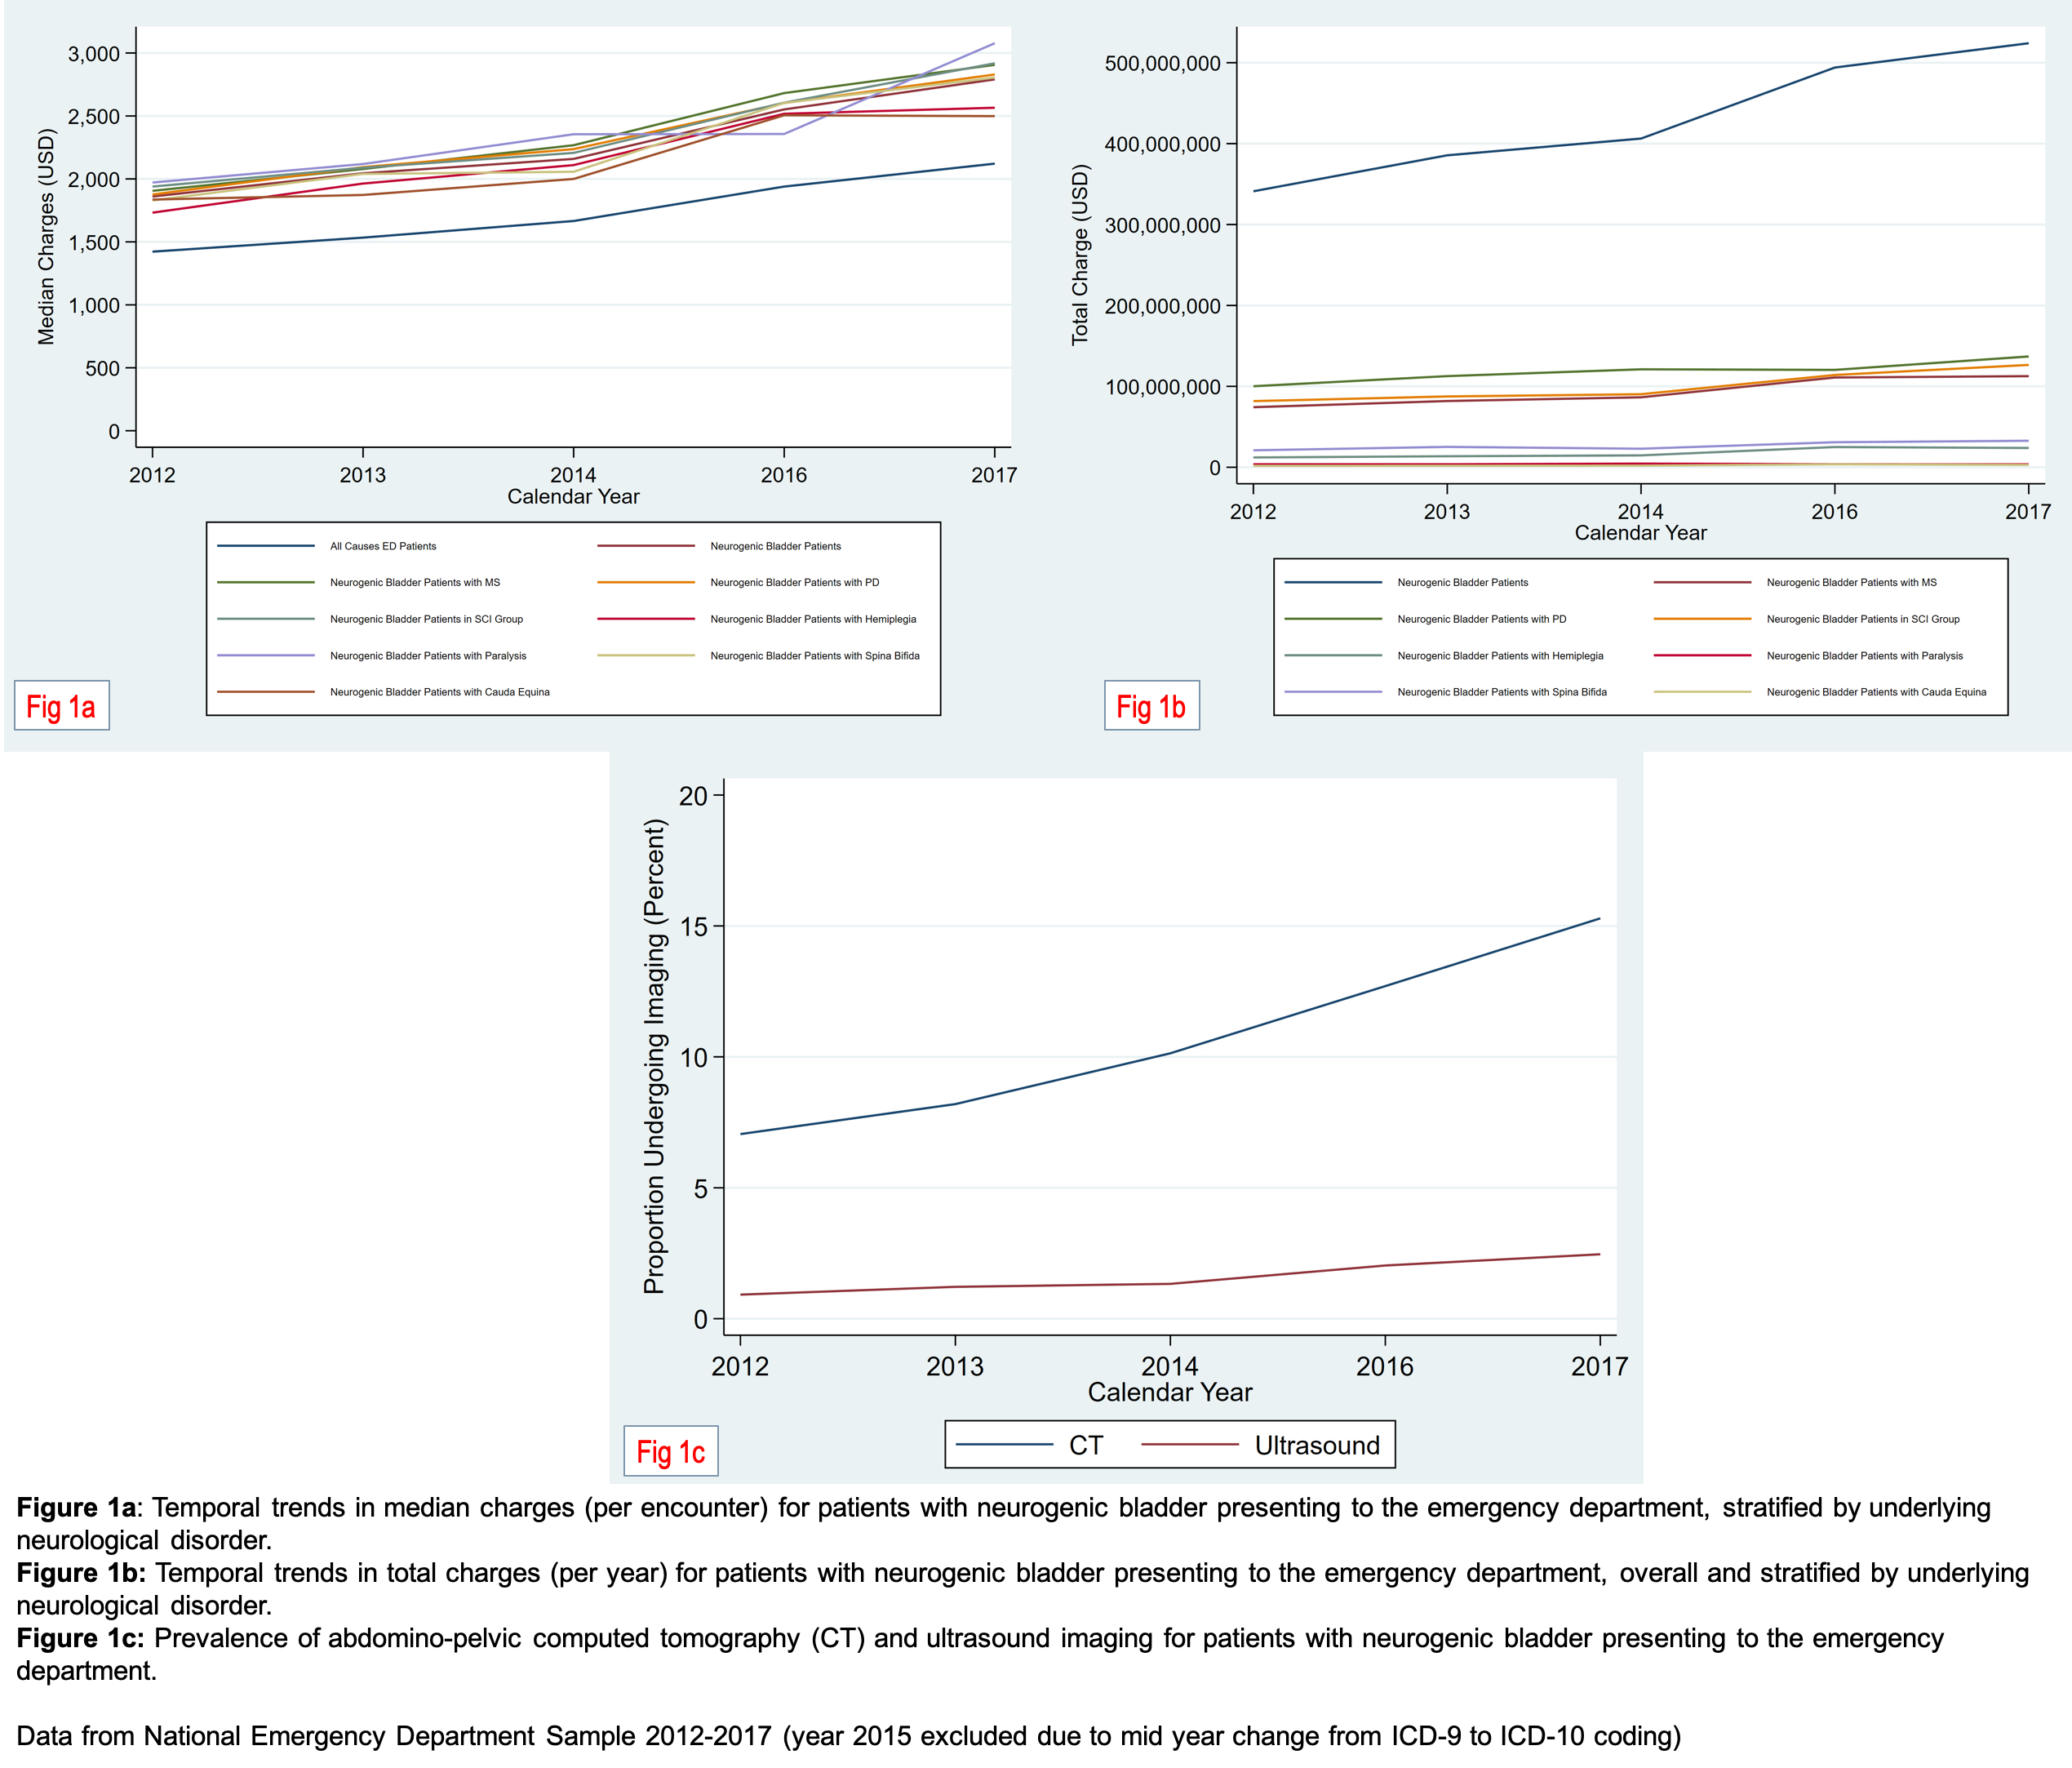
Regardless of the underlying neurological condition, median ED charges for NB patients increased annually (EAPC) by 8.3% (95% CI 7.4-9.2%, p<0.01, Figure 1a), along with concomitant increase in total ED charges (EAPC 8.9%, p<0.01), rising from USD 341 million in 2012 to 524 million in 2017 (Figure 1b). The proportion of NB patients undergoing CT scan doubled from ~7% to 15% (EAPC 16.3%, p<0.01), with a small proportion of patients undergoing USG (Figure 1c)
Conclusions: In this contemporary update of ED utilization by NB patients, both median and total ED charges continue to rise significantly each year (~8-9%), with the latter totaling an exorbitant USD 524 million in 2017. In conjunction, utilization of abdomino-pelvic CT scans doubled over the study period (from 7% in 2012 to 15% in 2017), compared to ~4% in NEDS 2011. Our results highlight the continued rise in health care costs and utilization of ED services by NB patients, and need for future studies to identify gaps in healthcare delivery.
Source of Funding: n/a


.jpg)
.jpg)