Back
Poster, Podium & Video Sessions
Podium
PD57: Prostate Cancer: Detection & Screening VI
PD57-08: Development of a Novel Risk Stratification Nomogram for PIRADS 4 and 5 Prostate Cancer on MRI-Fusion Biopsy
Monday, May 16, 2022
10:40 AM – 10:50 AM
Location: Room 245
Holly Houenstein, Ayat A. Shah, Yousuf Ramahi*, Philippa Doherty, Kristopher Attwood, Zhe Jing, James Mohler, Khurshid A. Guru, Eric C. Kauffman, Ahmed A. Hussein, Buffalo, NY

Yousuf Omar Ramahi, BS
Roswell Park Comprehensive Cancer Center
Podium Presenter(s)
Introduction: We sought to identify clinical variables associated with clinically significant (CS) prostate cancer on fusion biopsy of Prostate Imaging Reporting and Data System (PI-RADS) 4 or 5 lesions and attempted to develop a novel risk stratification nomogram.
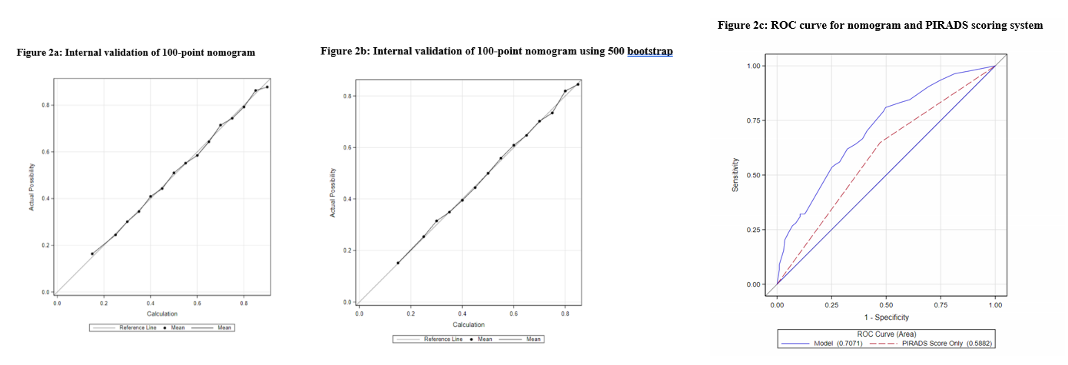
Methods: A retrospective review was conducted of patients who underwent MRI/US guided fusion prostate biopsy for PIRADS 4 or 5 lesions using the UroNav® system between 2017 and 2021. Patients were divided into those with CS disease (Grade Group 2 or higher) versus those without. Multivariable analysis (MVA) was used to identify variables associated with CS disease. A 100-point nomogram was created based on the MVA that was validated internally using 500 bootstrap. Receiver Operating Characteristic (ROC) curve was generated to compare the nomogram to the PIRADS scoring system.
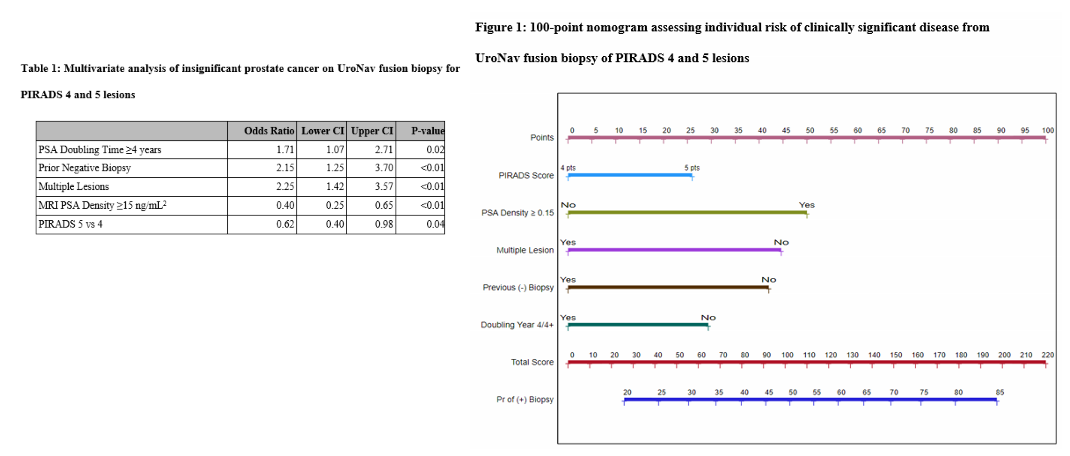
Results: A total of 425 lesions (348 patients) were identified; 239 (56%) were PIRADS 4 and 186 (44%) were PIRADS 5. Of these, 33% of PIRADS 4 and 67% of PIRADS 5 were CS disease. Patients without CS disease on biopsy had larger prostate volume on MRI (52 vs 42cm3, <0.01), lower PSA density (0.15 vs 0.21ng/mL2, p<0.01), >1 PIRADS 4/5 lesions (53% vs 35%, <0.01), prior negative biopsy (29% vs 18%, p=0.02), slower PSA velocity (0.97 vs 1.42 ng/mL/year, p<0.01), and longer PSA doubling time (5.6 vs 3.8 years, p<0.01). On MVA, absence of CS disease was associated with longer PSA doubling time (OR 1.71, 95% CI 1.07-2.71, p=0.02), prior negative biopsy (OR 2.15, 95% CI 1.42-3.70, p<0.01), presence of multiple lesions (OR 2.25, 95% CI 1.42-3.57, p<0.01), higher PSA density on MRI (OR 0.40, 95%CI 0.25-0.65, p<0.01) and PIRADS score 5 vs 4 (OR 0.62, 95%CI 0.40-0.98, p=0.04) (Table 1). Nomogram was constructed (Figure 1). Area under ROC curve was 70% for nomogram compared to 59% for PI-RADS score alone (Figure 2).
Conclusions: We developed and validated a nomogram that may improve specificity of PI-RADS scoring system and improve patient counselling.
Source of Funding: Roswell Park Alliance Foundation


.jpg)
.jpg)