Back

Objectives: The retail food environment can contribute to high rates of obesity, especially in low-income rural areas. The objectives of this work were to 1) explore food access for Supplemental Nutrition Assistance Program (SNAP) recipients in a high-obesity rural county, and 2) create an educational resource for the county’s SNAP recipients to both understand their retail food environment and locate healthy food options covered by SNAP benefits.
Methods: We first identified all SNAP-authorized retailers in the county, using the United States Department of Agriculture data source. Later, we identified the locations of retailers, using Google Maps. We verified these data with our on-the-ground team members in the county. We then separated out the list into retailers that sell fresh produce and those that do not. Using this information, we utilized ArcGIS Online to create an interactive map of county food resources, identifying which retailers sell fresh produce. We also mapped relevant sociodemographic factors (race, income, and vehicle access) by census tract, to assess within-county differences.
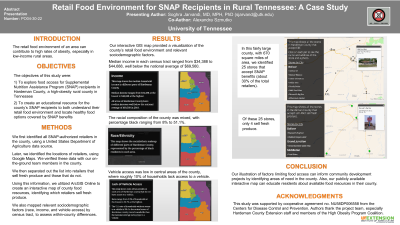
Results: Our interactive GIS map provided a visualization of the county’s retail food environment and relevant sociodemographics. Median income in each census tract ranged from $34,388 to $44,688, well below the national average of $69,560. The racial composition of the county was mixed, with percentage black ranging from 8% to 51.1%. Vehicle access was low in central areas of the county, where roughly 10% of households lack access to a vehicle. In this fairly large county, with 670 square miles of area, we identified 25 stores that accept SNAP benefits (about 30% of the total retailers). Of these 25 stores, only 5 sell fresh produce. Access to these retailers, particularly those which sell fresh produce, is limited for most residents. Some residents of the county have to travel upwards of 20 miles to reach a store that both accepts SNAP and sells fresh produce.
Conclusions: Our illustration of factors limiting food access can inform community development projects by identifying areas of need in the county. Also, our publicly available interactive map can educate residents about available food resources in their county.
Funding Sources: Centers for Disease Control and Prevention (CDC)
Community and Public Health Nutrition
(PO04-30-22) Retail Food Environment for SNAP Recipients in Rural Tennessee: A Case Study

- SJ
Soghra Jarvandi, MD, MPH, PhD
– Assistant Professor, University of Tennessee, Knoxville, Tennessee, United States - AS
Alexandra P. Szmutko
– University of Tennessee
Presenting Author(s)
Co-Author(s)
Disclosure(s):
Soghra Jarvandi, MD, MPH, PhD: No relevant financial relationship(s) with ineligible companies to disclose.
Objectives: The retail food environment can contribute to high rates of obesity, especially in low-income rural areas. The objectives of this work were to 1) explore food access for Supplemental Nutrition Assistance Program (SNAP) recipients in a high-obesity rural county, and 2) create an educational resource for the county’s SNAP recipients to both understand their retail food environment and locate healthy food options covered by SNAP benefits.
Methods: We first identified all SNAP-authorized retailers in the county, using the United States Department of Agriculture data source. Later, we identified the locations of retailers, using Google Maps. We verified these data with our on-the-ground team members in the county. We then separated out the list into retailers that sell fresh produce and those that do not. Using this information, we utilized ArcGIS Online to create an interactive map of county food resources, identifying which retailers sell fresh produce. We also mapped relevant sociodemographic factors (race, income, and vehicle access) by census tract, to assess within-county differences.
Results: Our interactive GIS map provided a visualization of the county’s retail food environment and relevant sociodemographics. Median income in each census tract ranged from $34,388 to $44,688, well below the national average of $69,560. The racial composition of the county was mixed, with percentage black ranging from 8% to 51.1%. Vehicle access was low in central areas of the county, where roughly 10% of households lack access to a vehicle. In this fairly large county, with 670 square miles of area, we identified 25 stores that accept SNAP benefits (about 30% of the total retailers). Of these 25 stores, only 5 sell fresh produce. Access to these retailers, particularly those which sell fresh produce, is limited for most residents. Some residents of the county have to travel upwards of 20 miles to reach a store that both accepts SNAP and sells fresh produce.
Conclusions: Our illustration of factors limiting food access can inform community development projects by identifying areas of need in the county. Also, our publicly available interactive map can educate residents about available food resources in their county.
Funding Sources: Centers for Disease Control and Prevention (CDC)

.png)
