Back
Poster Session C
Imaging
Session: (1228–1266) Imaging of Rheumatic Diseases Poster
1232: Reliability and Validity of Single Axial Slice vs. Multiple Slice Quantitative Measurement of the Volume of Effusion-Synovitis on 3T Knee MRI in Knees with Osteoarthritis
Sunday, November 13, 2022
1:00 PM – 3:00 PM Eastern Time
Location: Virtual Poster Hall
- GG
Greg Gilles, BS
The University of Arizona Arthritis Center
Tucson, AZ, United States
Abstract Poster Presenter(s)
Greg Gilles1, Arjun Vohra1, Chelsea Caruso1, Dagoberto Robles1, Mihra Taljanovic1, Jeffrey Duryea2, Erin Ashbeck1, Edward Bedrick3 and Kent Kwoh4, 1University of Arizona Arthritis Center, Tucson, AZ, 2Brigham and Women's Hospital, Boston, MA, 3Department of Epidemiology and Biostatistics, Mel and Enid Zuckerman College of Public Health, University of Arizona, Tucson, AZ, 4University of Arizona, Tucson, AZ
Background/Purpose: Effusion-synovitis (ES) on knee MRI has been identified as an important biomarker of OA. Semi-automated software methods offer objective measurements of ES volume on MRI, but efficiency is crucial, especially for studies involving many MRIs. We developed a quantitative measurement of ES using the single axial slice with the largest area of ES, evaluated the reliability of the new single-slice quantitative measurement of ES, and correlated this measurement of ES with the previously validated method based on multi-slice quantitative measurement of ES and with a validated semi-quantitative scoring of ES to demonstrate that the single-slice ES method is a valid substitute.
Methods: OAI participants with radiographic OA (i.e., Kellgren-Lawrence [KL] 2,3) in at least 1 knee at baseline with prior semi-quantitative assessment of ES by a MSK radiologist were randomly selected (n=50 knees; 1 knee per participant). Four non-expert readers were trained to use custom semi-automated software and a programmed multi-button mouse (see Figure 1) to measure ES volume on 3T MRI (see Figure 2) under the direction of a MSK radiologist, and then read scans from the KL 2,3 sample blinded to prior assessments (twice for 3 readers; once for 1 reader). Intra- and inter-reader reliability was evaluated based on intraclass correlation coefficients (ICC) from a linear mixed model with random effects for knee, reader, and interaction between knee and reader. We assessed agreement with the mean absolute difference (MAD). In a subset of the FNIH study (n=301), one reader measured single-slice ES volume, blinded to the prior multi-slice quantitative measurements of ES. We estimated the Spearman correlation coefficient between single-slice and multi-slice volume of ES in the FNIH subset. Validity was evaluated based on Spearman correlation between single-slice ES volume and semi-quantitative ES MRI Osteoarthritis Knee Score (MOAKS) in the KL 2,3 sample and the FNIH subset. 95% confidence intervals (CI) were generated from bias-corrected and acceleration-adjusted bootstrap.
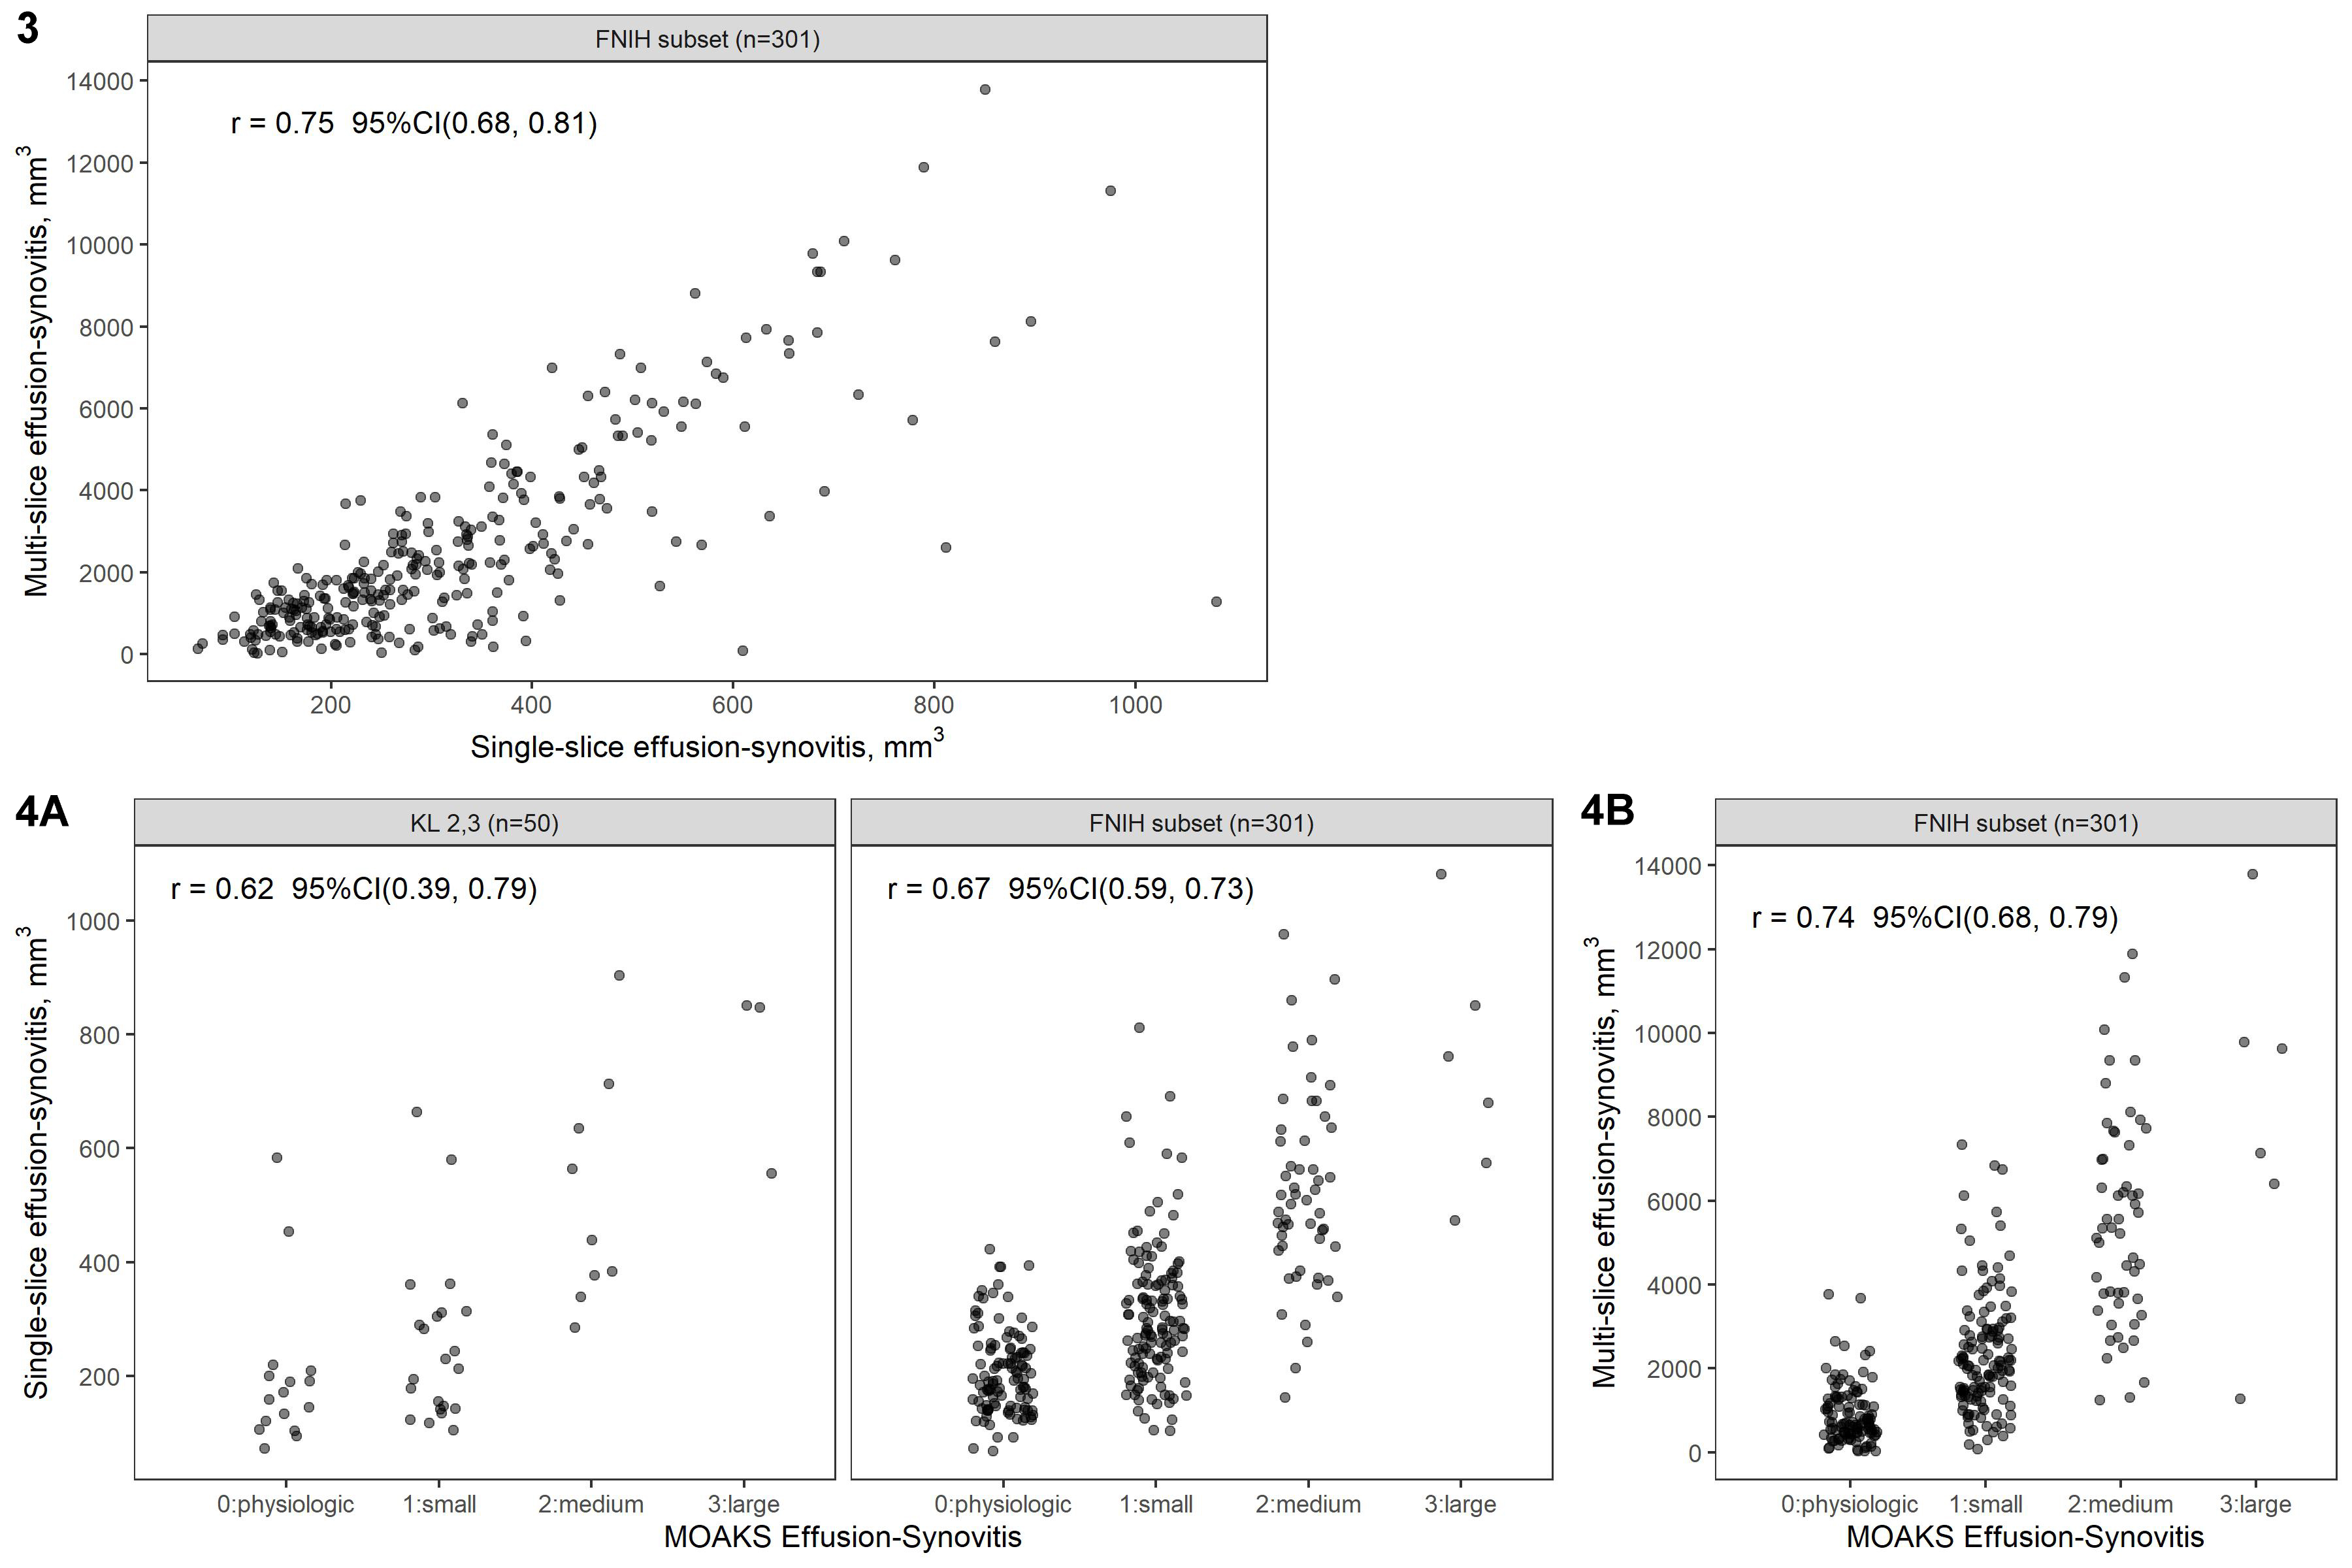
Results: In this sample of KL 2,3 knees, the mean single-slice ES volume was 312.8 mm3 with standard deviation 218.4 mm3. The intra-reader ICC was 0.96 (95%CI 0.93-0.97) and inter-reader ICC was 0.90 (95%CI 0.87-0.95); the intra-reader MAD was 36 mm3 (95%CI 28-44) and inter-reader MAD was 61 mm3 (95%CI 48-75). The estimated correlation between single-slice and multi-slice ES volume was 0.75 (95%CI 0.68-0.81; Figure 3). Correlation between single-slice ES volume and MOAKS ES was 0.62 (95%CI 0.39-0.79) in the KL 2,3 sample and 0.67 (95%CI 0.59-0.73) in the FNIH subset (Figure 4A), while correlation between multi-slice ES volume and MOAKS ES was 0.74 (95%CI 0.68-0.79) in the FNIH subset (Figure 4B).
Conclusion: The more efficient single-slice quantitative measurement of ES had excellent intra-and inter-reader reliability with non-expert readers, and good correlation with both the multi-slice quantitative ES measurement and MOAKS semi-quantitative assessment of ES. Single-slice quantitative measurement is an efficient surrogate for multi-slice assessment, having shown similar validity based on comparison to semi-quantitative scoring by experienced MSK radiologists.
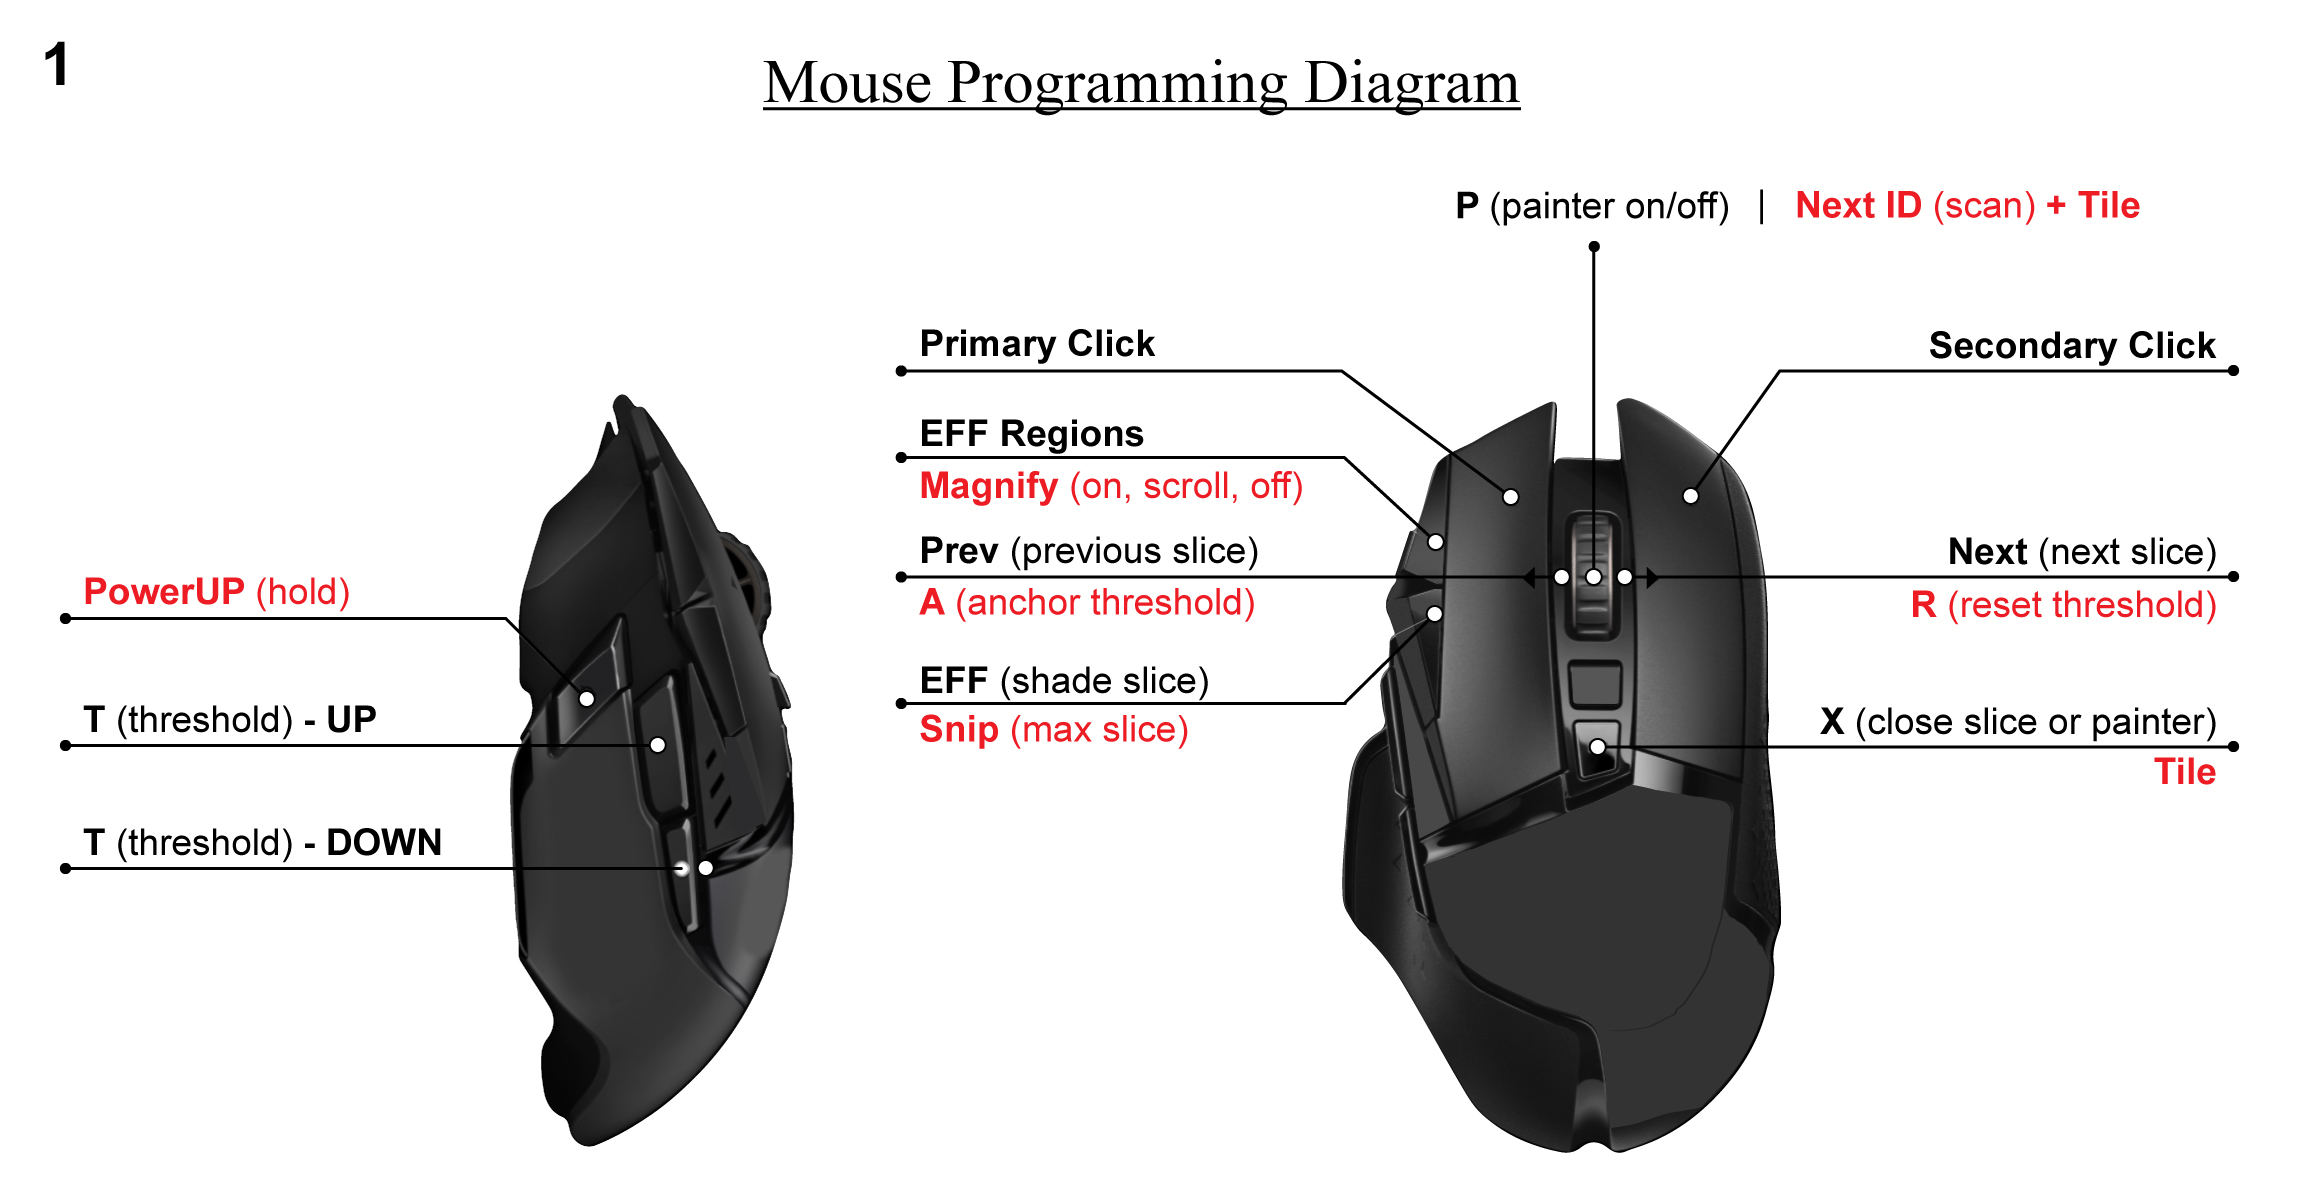
 Figure 1: Diagram of mouse displaying 20 software functions programmed as buttons that can be performed rapidly to generate effusion-synovitis shadings and subregional divisions.
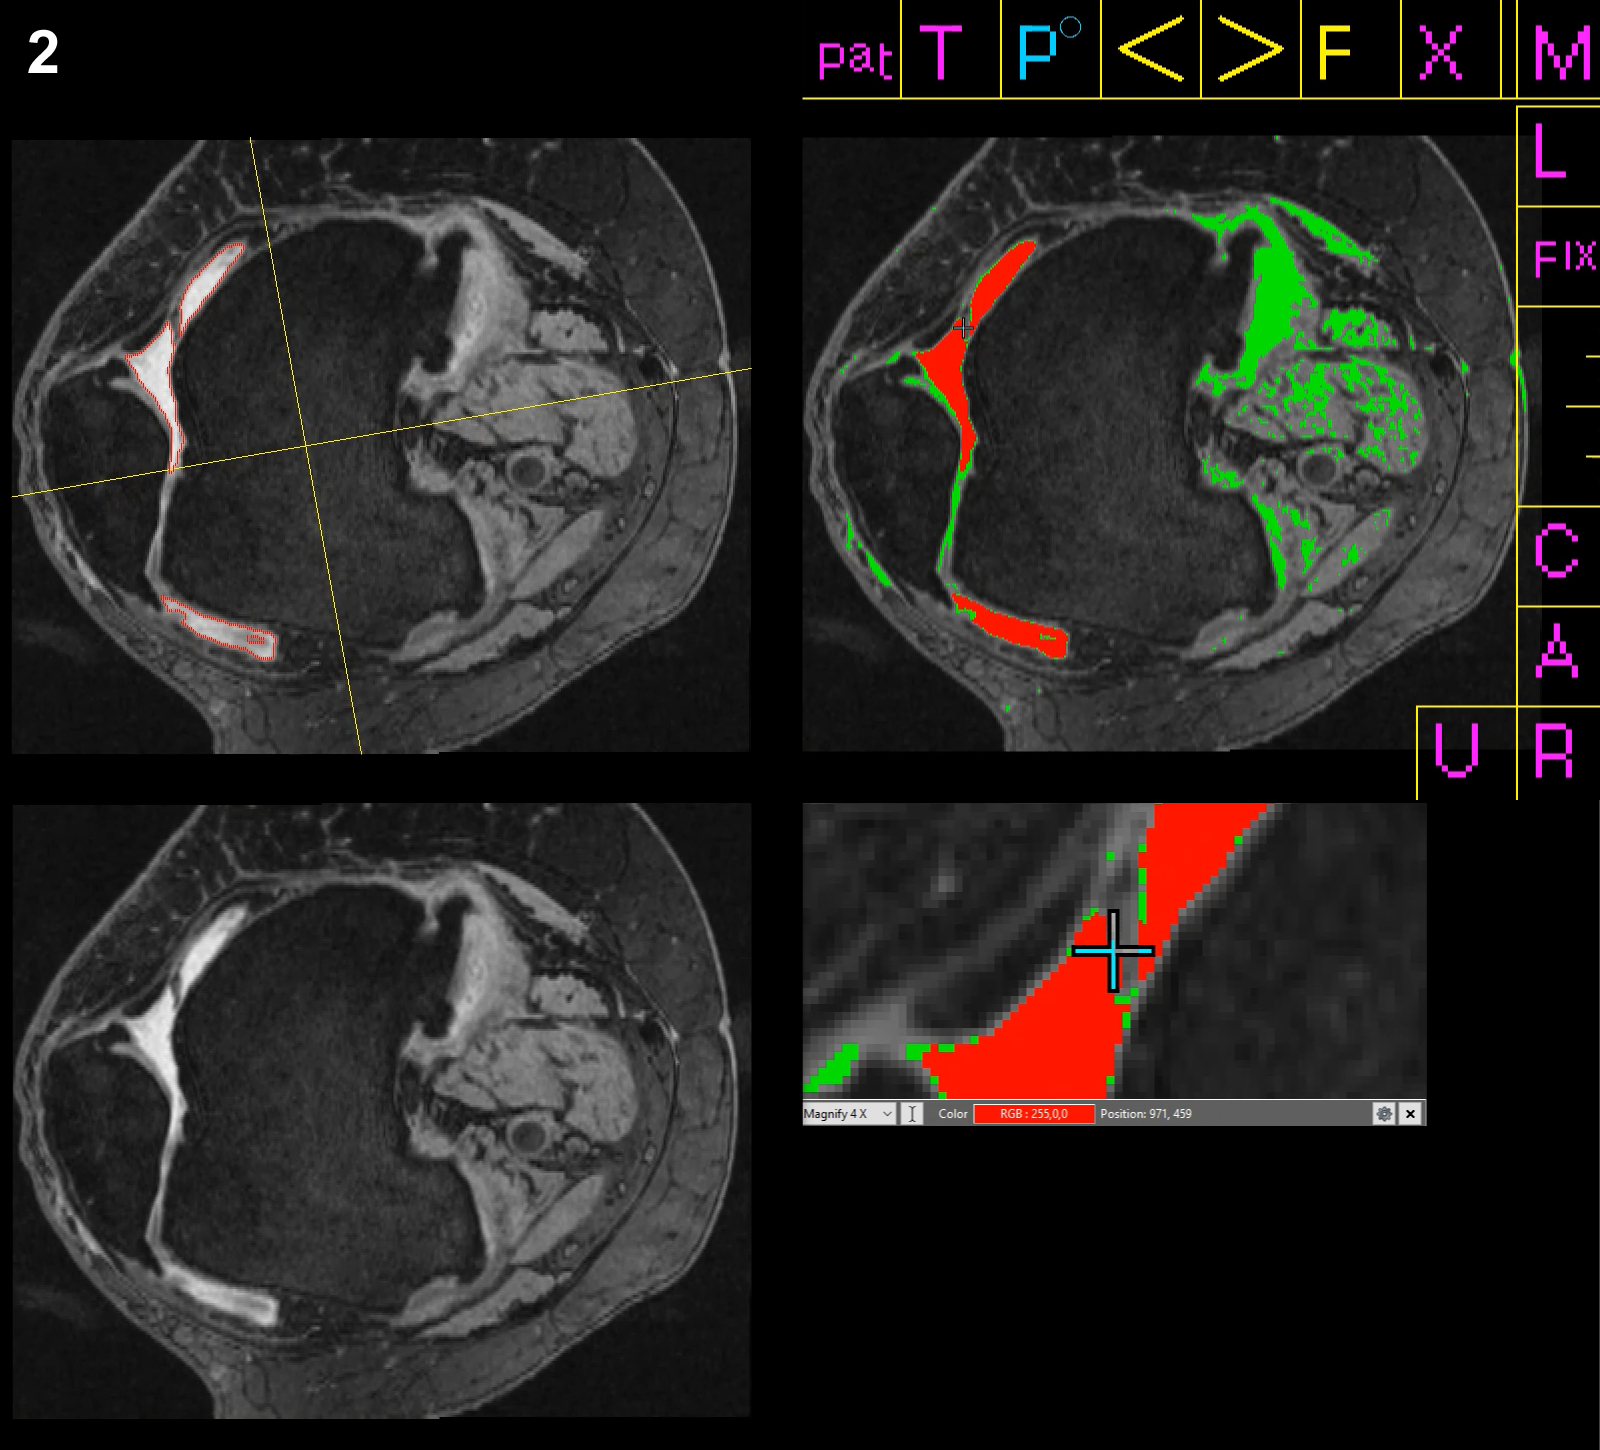
 Figure 2: Coordinated software system and effusion-synovitis measurement method used to generate effusion-synovitis shadings and subregional divisions and verify/revise areas of fine detail. Original slice shown in bottom left corner; preview of shadings and regions generated in top left corner; active program in top right corner; magnifier on cursor below active program.
 Figure 3: Single-slice vs multi-slice measurement of effusion-synovitis volume.
Figure 4A: Single-slice effusion-synovitis volume vs semi-quantitative MOAKS effusion-synovitis scores; 4B: Multi-slice effusion-synovitis volume vs semi-quantitative MOAKS effusion-synovitis scores.
Disclosures: G. Gilles, None; A. Vohra, None; C. Caruso, None; D. Robles, None; M. Taljanovic, None; J. Duryea, None; E. Ashbeck, None; E. Bedrick, None; K. Kwoh, Express Scripts, Kolon TissueGene, Avalor Therapeutics, Cumberland Pharmaceuticals, Regeneron, LG Chem, Novartis, AbbVie/Abbott, GlaxoSmithKlein(GSK).
Background/Purpose: Effusion-synovitis (ES) on knee MRI has been identified as an important biomarker of OA. Semi-automated software methods offer objective measurements of ES volume on MRI, but efficiency is crucial, especially for studies involving many MRIs. We developed a quantitative measurement of ES using the single axial slice with the largest area of ES, evaluated the reliability of the new single-slice quantitative measurement of ES, and correlated this measurement of ES with the previously validated method based on multi-slice quantitative measurement of ES and with a validated semi-quantitative scoring of ES to demonstrate that the single-slice ES method is a valid substitute.
Methods: OAI participants with radiographic OA (i.e., Kellgren-Lawrence [KL] 2,3) in at least 1 knee at baseline with prior semi-quantitative assessment of ES by a MSK radiologist were randomly selected (n=50 knees; 1 knee per participant). Four non-expert readers were trained to use custom semi-automated software and a programmed multi-button mouse (see Figure 1) to measure ES volume on 3T MRI (see Figure 2) under the direction of a MSK radiologist, and then read scans from the KL 2,3 sample blinded to prior assessments (twice for 3 readers; once for 1 reader). Intra- and inter-reader reliability was evaluated based on intraclass correlation coefficients (ICC) from a linear mixed model with random effects for knee, reader, and interaction between knee and reader. We assessed agreement with the mean absolute difference (MAD). In a subset of the FNIH study (n=301), one reader measured single-slice ES volume, blinded to the prior multi-slice quantitative measurements of ES. We estimated the Spearman correlation coefficient between single-slice and multi-slice volume of ES in the FNIH subset. Validity was evaluated based on Spearman correlation between single-slice ES volume and semi-quantitative ES MRI Osteoarthritis Knee Score (MOAKS) in the KL 2,3 sample and the FNIH subset. 95% confidence intervals (CI) were generated from bias-corrected and acceleration-adjusted bootstrap.
Results: In this sample of KL 2,3 knees, the mean single-slice ES volume was 312.8 mm3 with standard deviation 218.4 mm3. The intra-reader ICC was 0.96 (95%CI 0.93-0.97) and inter-reader ICC was 0.90 (95%CI 0.87-0.95); the intra-reader MAD was 36 mm3 (95%CI 28-44) and inter-reader MAD was 61 mm3 (95%CI 48-75). The estimated correlation between single-slice and multi-slice ES volume was 0.75 (95%CI 0.68-0.81; Figure 3). Correlation between single-slice ES volume and MOAKS ES was 0.62 (95%CI 0.39-0.79) in the KL 2,3 sample and 0.67 (95%CI 0.59-0.73) in the FNIH subset (Figure 4A), while correlation between multi-slice ES volume and MOAKS ES was 0.74 (95%CI 0.68-0.79) in the FNIH subset (Figure 4B).
Conclusion: The more efficient single-slice quantitative measurement of ES had excellent intra-and inter-reader reliability with non-expert readers, and good correlation with both the multi-slice quantitative ES measurement and MOAKS semi-quantitative assessment of ES. Single-slice quantitative measurement is an efficient surrogate for multi-slice assessment, having shown similar validity based on comparison to semi-quantitative scoring by experienced MSK radiologists.
 Figure 1: Diagram of mouse displaying 20 software functions programmed as buttons that can be performed rapidly to generate effusion-synovitis shadings and subregional divisions.
 Figure 2: Coordinated software system and effusion-synovitis measurement method used to generate effusion-synovitis shadings and subregional divisions and verify/revise areas of fine detail. Original slice shown in bottom left corner; preview of shadings and regions generated in top left corner; active program in top right corner; magnifier on cursor below active program.
 Figure 3: Single-slice vs multi-slice measurement of effusion-synovitis volume.
Figure 4A: Single-slice effusion-synovitis volume vs semi-quantitative MOAKS effusion-synovitis scores; 4B: Multi-slice effusion-synovitis volume vs semi-quantitative MOAKS effusion-synovitis scores.
Disclosures: G. Gilles, None; A. Vohra, None; C. Caruso, None; D. Robles, None; M. Taljanovic, None; J. Duryea, None; E. Ashbeck, None; E. Bedrick, None; K. Kwoh, Express Scripts, Kolon TissueGene, Avalor Therapeutics, Cumberland Pharmaceuticals, Regeneron, LG Chem, Novartis, AbbVie/Abbott, GlaxoSmithKlein(GSK).

