Back
Abstract Session
Rheumatoid arthritis (RA)
Session: Abstracts: RA – Etiology and Pathogenesis (0498–0501)
0500: T Cell and Macrophage Synergy Drive Inflammatory Synovial Fibroblasts in Rheumatoid but Not Psoriatic Arthritis
Saturday, November 12, 2022
3:30 PM – 3:40 PM Eastern Time
Location: Room 204

Achilleas Floudas, PhD
Molecular Rheumatology Trinity Biomedical Sciences Institute
Dublin, Dublin, Ireland
Presenting Author(s)
Achilleas Floudas1, conor Smith2, Orla Tynan3, Nuno Neto4, Krishna Vinod5, Sarah Wade6, Megan Hanlon7, Clare Cunningham4, Viviana Marzaioli8, Mary Canavan9, Jean Fletcher3, Ronan Mullan10, Suzanne Cole11, Ling-Yang Hao12, Michael Monaghan4, Sunil Nagpal13, Douglas Veale14 and Ursula Fearon4, 1Molecular Rheumatology Trinity Biomedical Sciences Institute, Dublin, Ireland, 2bTrinity College Dublin, Dublin, Ireland, 3Trinity Biomedical Sciences Institute, Dublin, Ireland, 4Trinity College Dublin, Dublin, Ireland, 5Janssen, Spring House, PA, 6Trinity Biomedical Sciences Institute, Wexford, Ireland, 7Molecular Rheumatology, Dublin, Ireland, 8Trinity College Dublin and University College Dublin, Dublin, Ireland, 9Trinity College, Dublin, Ireland, 10Tallaght University Hospital, Dublin, Ireland, 11Rheumatic Disease Associates, Warminster, PA, 12Janssen Research and Development, LLC, Spring House, PA, 13Janssen Research, Collegeville, PA, 14St. Vincent's University Hospital, Blackrock, Dublin, Ireland
Background/Purpose: Rheumatoid (RA) and psoriatic arthritis (PsA) are common autoimmune diseases of unknown aetiology characterised by complex synovial pathology with a detrimental effect on the patient's quality of life. Significant differences in pathophysiology may explain distinct clinical manifestations and account for differential responses to specific therapeutics. Recent implementation of single cell transcriptomic analysis of sorted synovial cells has revealed the diverse cellular landscape of the RA synovial stromal and immune cell compartments, however, a complete analysis of immune and stromal cells in tandem, for RA and PsA patient synovial tissue has not been performed.
Methods: Single cell transcriptomic profiling of 178,000 synovial tissue cells from 5 PsA and 4 RA patients, importantly, without prior sorting of immune and stromal cells. This approach enabled the generation of a unique cell atlas of intact synovial tissue identifying immune and stromal cell interactions. State of the art data integration and annotation techniques identified and characterised 18 stromal and 14 immune cell clusters. Bioinformatic examination of cell-cell communication via construction of receptor-ligand interaction networks with further in vitro validation of stromal and immune cell crosstalk through flow cytometric analysis, multiplex ELISA and mitochondrial and single cell metabolic profiling by multiphoton and florescent lifetime imaging microscopy, seahorse.
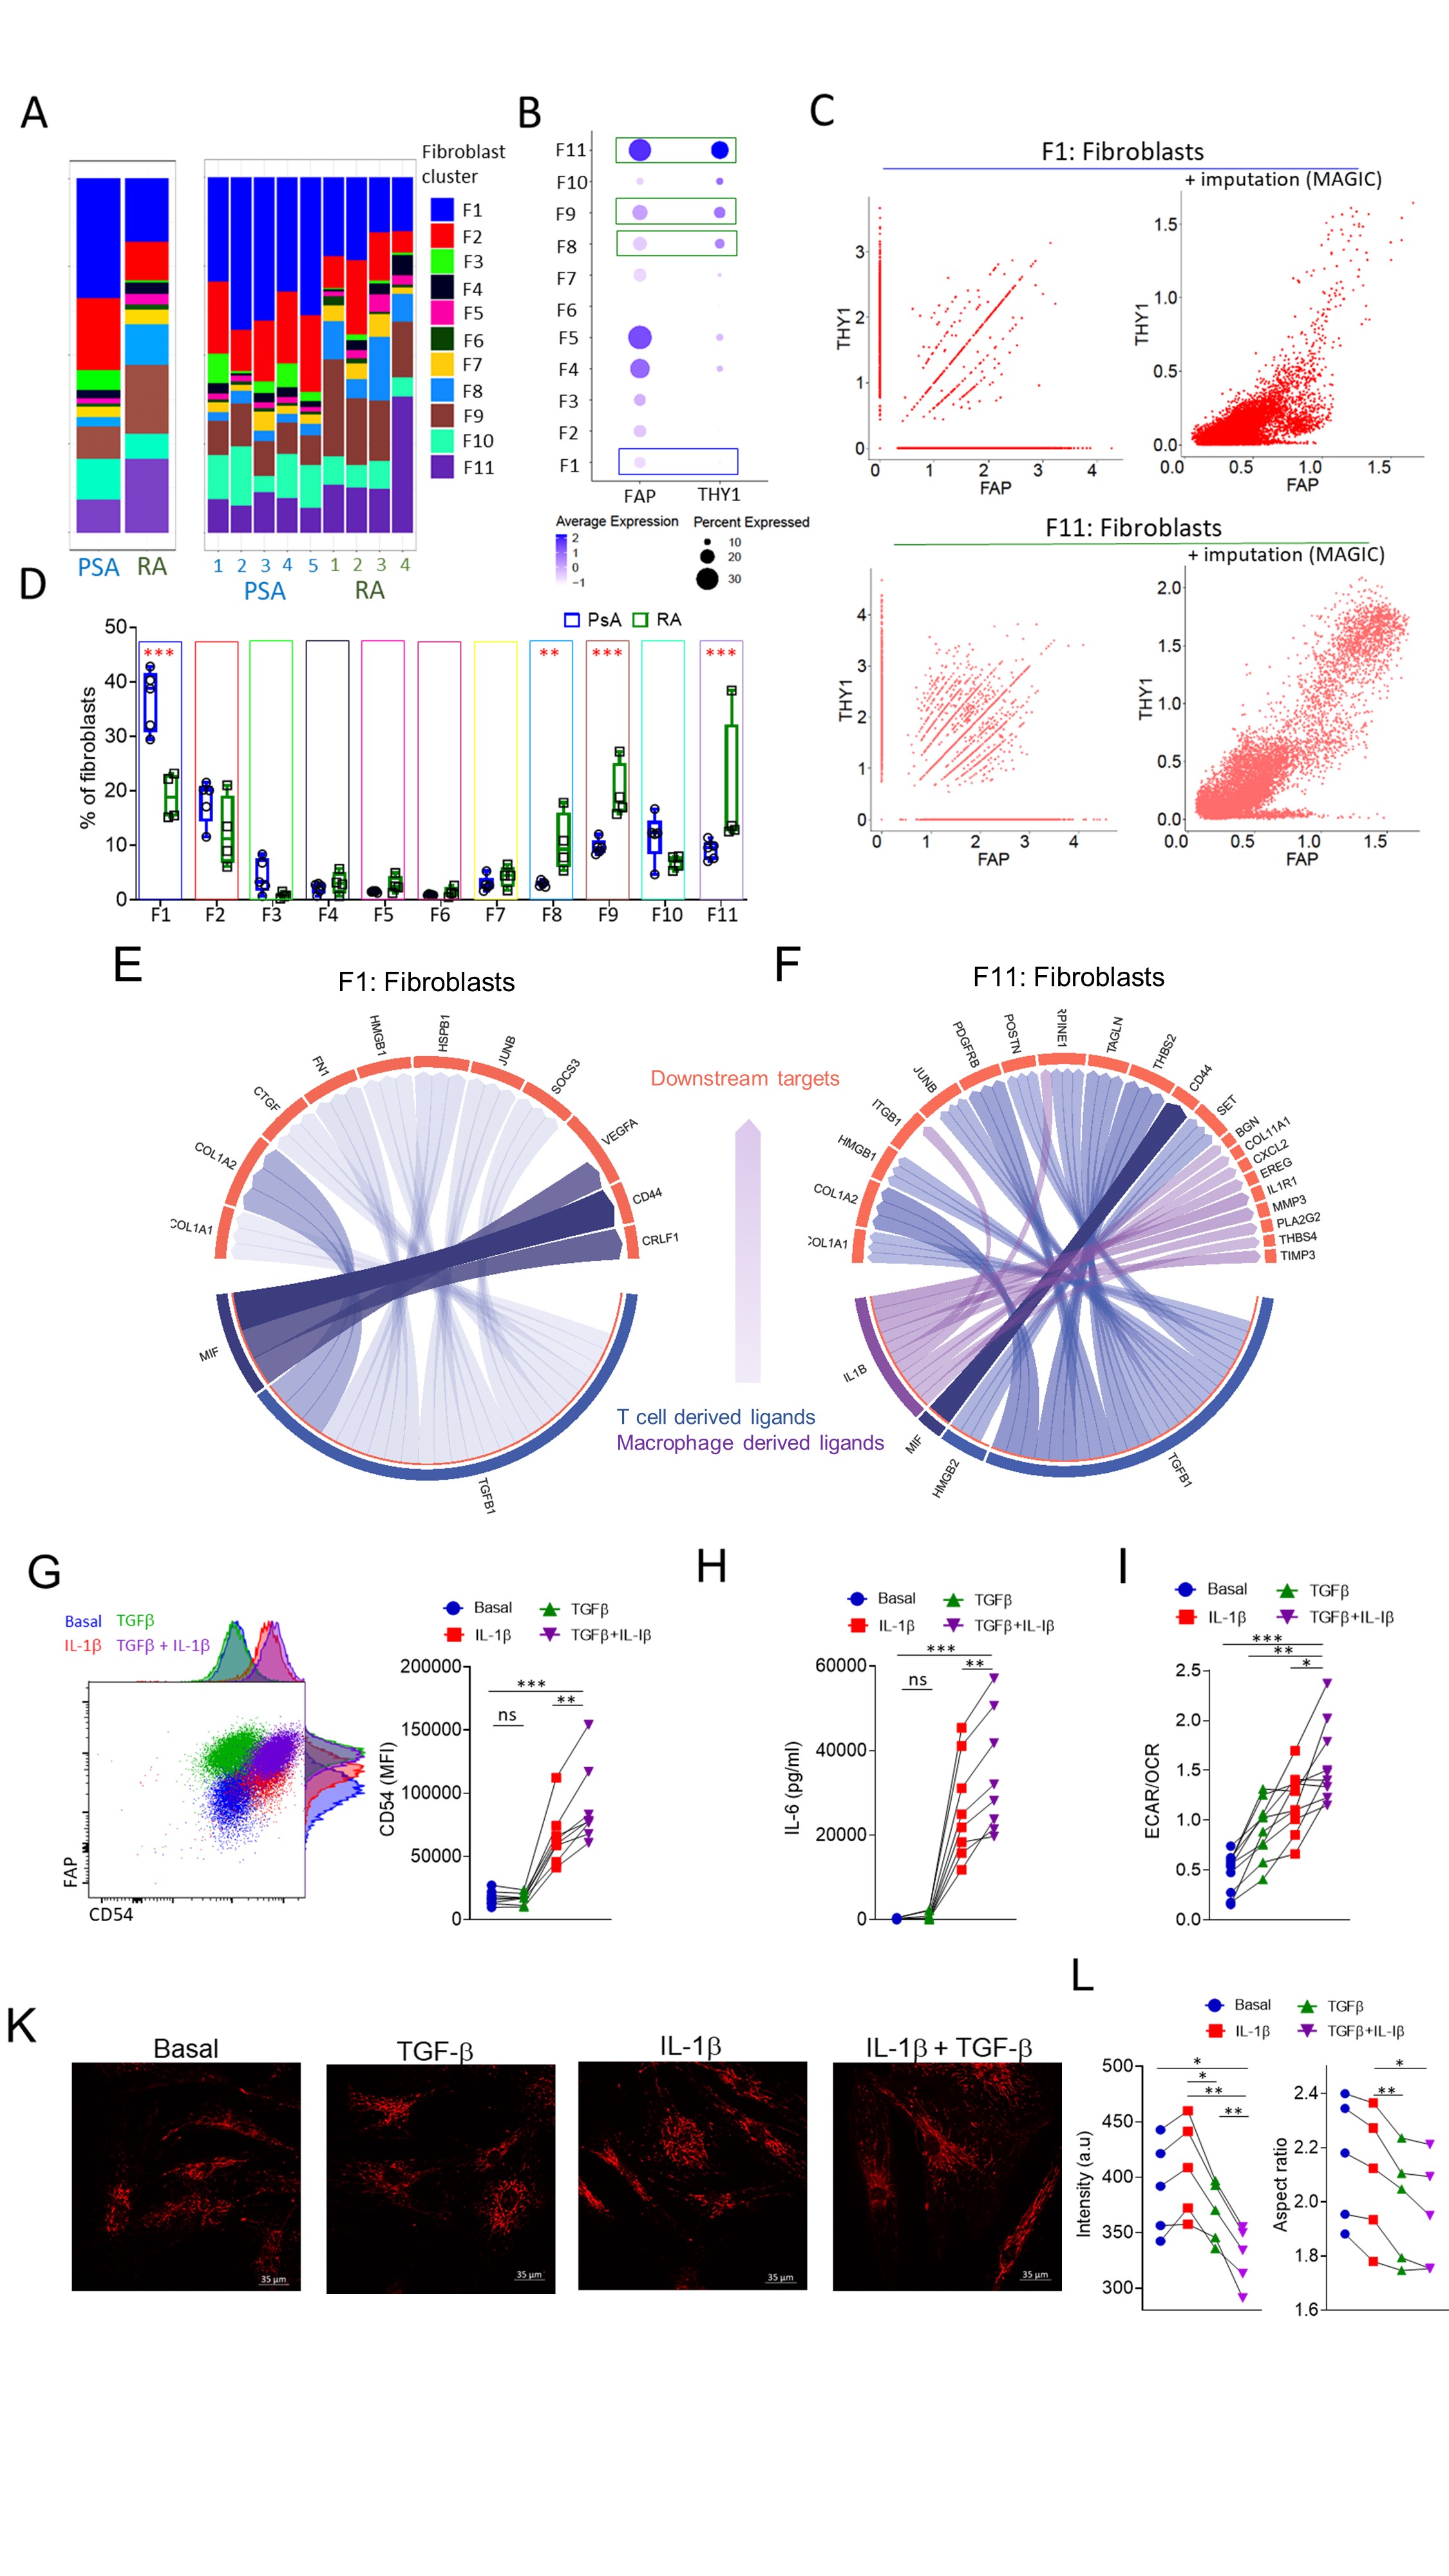
Results: Following quality control and data integration the PsA and RA cellular landscape was generated. Distinct points of transcriptomic deviation and convergence between RA and PsA were identified for each of the major cell types of the joint. Specifically, the differential usage of immunoglobulin light chains by memory and plasma cells indicates that plasma cells are potentially not derived from the local memory B cell pool of the synovial tissue. Importantly, we report distinct fibroblast and endothelial cell transcriptomes indicating differentially abundant subpopulations in RA and PsA characterised by distinct transcription factor usage and signalling pathway enrichment. In order to identify potential cell-cell communication driving inflammation in RA and PsA, novel receptor–ligand interaction networks were generated and downstream of the receptor, target characterisation was performed. Herein we identify RA-specific synovial T cell-derived TGF-b and macrophage IL-1b synergy in driving the transcriptional profile of FAPα+THY1+ invasive synovial-fibroblasts, expanded in RA compared to PsA synovial tissue. Ex vivo treatment of RA patient synovial fibroblasts identified TGF-b and IL-1b synergy are a major driver of IL-6 production, fibroblast activation and adhesion molecule expression. Interestingly, the aforementioned proinflammatory changes of RA patient synovial fibroblasts were coupled with significant alterations in mitochondrial eccentricity and size and a marked metabolic adaptation towards a strongly glycolytic profile (Figure).
Conclusion: Disrupting specific immune and stromal cell interactions offers novel opportunities for targeted therapeutic intervention in RA and PsA.
 Figure: Immune-stromal cell crosstalk as a driver of synovial inflammation.
A. Abundance of fibroblast clusters in RA and PsA patient synovial biopsies. B. Expression and percentage of positive cells per fibroblast cluster for FAP and THY1. C. Scatterplots for showing the relation between THY1 and FAP expressing cells before and after data imputation for RA and PsA fibroblast cluster 1 and fibroblast cluster 11. Fibroblast clusters with significantly different abundances between RA and PsA are indicated by green (higher in RA) and blue (higher in PsA) boxes. D. Frequency of fibroblast clusters in PsA and RA patient synovial biopsies (n=4-5), data are presented as Box and whiskers plots (min to max), symbols represent individual samples. E,F. Circo plot depicting the top ligand and downstream target interaction for enriched in PsA synovial fibroblast cluster F1 and enriched in RA, invasive synovial fibroblast cluster F11. G. Flow cytometric analysis of CD54 (ICAM-1) expression by RA patient synovial fibroblasts following treatment with IL-1β, TGF- β or a combination of both. Statistical significance was determined by one-way ANOVA, symbols indicate individual samples (n=8), **p= 0.0047, ***p=0.0007. H. IL-6 secretion by RA patient synovial fibroblasts treated under the conditions indicated. Statistical significance was determined by one-way ANOVA, symbols indicate individual samples (n=8), **p= 0.0018, ***p=0.0008. I. ECAR to OCR ratio of RA patient fibroblasts for the indicated conditions, statistical significance was determined by one-way ANOVA, n=10, **p=0.0014, *p=0.019, ***p < 0.0001. K. Representative multiphoton microscope images of TMRM stained synovial fibroblast mitochondria under the indicated conditions. L. Fluorescent intensity of TMRN and mitochondrial aspect ratio. Statistical significance was determined with one-way ANOVA, p < 0.05 were considered significant.
Disclosures: A. Floudas, None; c. Smith, None; O. Tynan, None; N. Neto, None; K. Vinod, None; S. Wade, None; M. Hanlon, None; C. Cunningham, None; V. Marzaioli, None; M. Canavan, None; J. Fletcher, None; R. Mullan, None; S. Cole, None; L. Hao, None; M. Monaghan, None; S. Nagpal, Janssen; D. Veale, AbbVie/Abbott, Pfizer, Eli Lilly, Novartis, Gilead; U. Fearon, AbbVie/Abbott, Pfizer, Janssen, Eli Lilly, GlaxoSmithKlein(GSK).
Background/Purpose: Rheumatoid (RA) and psoriatic arthritis (PsA) are common autoimmune diseases of unknown aetiology characterised by complex synovial pathology with a detrimental effect on the patient's quality of life. Significant differences in pathophysiology may explain distinct clinical manifestations and account for differential responses to specific therapeutics. Recent implementation of single cell transcriptomic analysis of sorted synovial cells has revealed the diverse cellular landscape of the RA synovial stromal and immune cell compartments, however, a complete analysis of immune and stromal cells in tandem, for RA and PsA patient synovial tissue has not been performed.
Methods: Single cell transcriptomic profiling of 178,000 synovial tissue cells from 5 PsA and 4 RA patients, importantly, without prior sorting of immune and stromal cells. This approach enabled the generation of a unique cell atlas of intact synovial tissue identifying immune and stromal cell interactions. State of the art data integration and annotation techniques identified and characterised 18 stromal and 14 immune cell clusters. Bioinformatic examination of cell-cell communication via construction of receptor-ligand interaction networks with further in vitro validation of stromal and immune cell crosstalk through flow cytometric analysis, multiplex ELISA and mitochondrial and single cell metabolic profiling by multiphoton and florescent lifetime imaging microscopy, seahorse.
Results: Following quality control and data integration the PsA and RA cellular landscape was generated. Distinct points of transcriptomic deviation and convergence between RA and PsA were identified for each of the major cell types of the joint. Specifically, the differential usage of immunoglobulin light chains by memory and plasma cells indicates that plasma cells are potentially not derived from the local memory B cell pool of the synovial tissue. Importantly, we report distinct fibroblast and endothelial cell transcriptomes indicating differentially abundant subpopulations in RA and PsA characterised by distinct transcription factor usage and signalling pathway enrichment. In order to identify potential cell-cell communication driving inflammation in RA and PsA, novel receptor–ligand interaction networks were generated and downstream of the receptor, target characterisation was performed. Herein we identify RA-specific synovial T cell-derived TGF-b and macrophage IL-1b synergy in driving the transcriptional profile of FAPα+THY1+ invasive synovial-fibroblasts, expanded in RA compared to PsA synovial tissue. Ex vivo treatment of RA patient synovial fibroblasts identified TGF-b and IL-1b synergy are a major driver of IL-6 production, fibroblast activation and adhesion molecule expression. Interestingly, the aforementioned proinflammatory changes of RA patient synovial fibroblasts were coupled with significant alterations in mitochondrial eccentricity and size and a marked metabolic adaptation towards a strongly glycolytic profile (Figure).
Conclusion: Disrupting specific immune and stromal cell interactions offers novel opportunities for targeted therapeutic intervention in RA and PsA.
 Figure: Immune-stromal cell crosstalk as a driver of synovial inflammation.
A. Abundance of fibroblast clusters in RA and PsA patient synovial biopsies. B. Expression and percentage of positive cells per fibroblast cluster for FAP and THY1. C. Scatterplots for showing the relation between THY1 and FAP expressing cells before and after data imputation for RA and PsA fibroblast cluster 1 and fibroblast cluster 11. Fibroblast clusters with significantly different abundances between RA and PsA are indicated by green (higher in RA) and blue (higher in PsA) boxes. D. Frequency of fibroblast clusters in PsA and RA patient synovial biopsies (n=4-5), data are presented as Box and whiskers plots (min to max), symbols represent individual samples. E,F. Circo plot depicting the top ligand and downstream target interaction for enriched in PsA synovial fibroblast cluster F1 and enriched in RA, invasive synovial fibroblast cluster F11. G. Flow cytometric analysis of CD54 (ICAM-1) expression by RA patient synovial fibroblasts following treatment with IL-1β, TGF- β or a combination of both. Statistical significance was determined by one-way ANOVA, symbols indicate individual samples (n=8), **p= 0.0047, ***p=0.0007. H. IL-6 secretion by RA patient synovial fibroblasts treated under the conditions indicated. Statistical significance was determined by one-way ANOVA, symbols indicate individual samples (n=8), **p= 0.0018, ***p=0.0008. I. ECAR to OCR ratio of RA patient fibroblasts for the indicated conditions, statistical significance was determined by one-way ANOVA, n=10, **p=0.0014, *p=0.019, ***p < 0.0001. K. Representative multiphoton microscope images of TMRM stained synovial fibroblast mitochondria under the indicated conditions. L. Fluorescent intensity of TMRN and mitochondrial aspect ratio. Statistical significance was determined with one-way ANOVA, p < 0.05 were considered significant.
Disclosures: A. Floudas, None; c. Smith, None; O. Tynan, None; N. Neto, None; K. Vinod, None; S. Wade, None; M. Hanlon, None; C. Cunningham, None; V. Marzaioli, None; M. Canavan, None; J. Fletcher, None; R. Mullan, None; S. Cole, None; L. Hao, None; M. Monaghan, None; S. Nagpal, Janssen; D. Veale, AbbVie/Abbott, Pfizer, Eli Lilly, Novartis, Gilead; U. Fearon, AbbVie/Abbott, Pfizer, Janssen, Eli Lilly, GlaxoSmithKlein(GSK).

