Back
Poster Session B
Spondyloarthritis (SpA) including psoriatic arthritis (PsA)
Session: (1004–1034) Spondyloarthritis Including PsA – Diagnosis, Manifestations, and Outcomes Poster II
1027: Low Dose Computed Tomography Hounsfield Units: A Reliable Methodology for Assessing Changes in Vertebral Bone Density in Radiographic Axial Spondyloarthritis
Sunday, November 13, 2022
9:00 AM – 10:30 AM Eastern Time
Location: Virtual Poster Hall

Mary Lucy Marques, MD, MSc
Leiden University Medical Center
Coimbra, Portugal
Abstract Poster Presenter(s)
Mary Lucy Marques1, Nuno Pereira da Silva2, Désirée van der Heijde3, Monique Reijnierse4, Juergen Braun5, Xenofon Baraliakos6, floris van Gaalen4 and Sofia Ramiro4, 1Leiden University Medical Center, Coimbra, Portugal, 2Radiology Department, Centro Hospitalar e Universitário de Coimbra, Coimbra, Portugal, 3Department of Rheumatology, Leiden University Medical Center, Leiden, The Netherlands, Leiden, Netherlands, 4Leiden University Medical Center, Leiden, Netherlands, 5Rheumazentrum Ruhrgebiet, Herne, Germany, 6Rheumazentrum Ruhrgebiet Herne, Herne, Germany
Background/Purpose: In radiographic axial Spondyloarthritis (r-axSpA), low dose Computed Tomography (ldCT) Hounsfield Units (HU) were shown to cross-sectionally reliably assess bone density at each vertebra from C3 to L5.1 HU change scores have never been studied. In the present study we aimed to describe ldCT HU 2-year change scores and analyse inter-reader reliability per vertebra.
Methods: We used 49 patients with r-axSpA from the multicentre 2-year Sensitive Imaging in Ankylosing Spondylitis (SIAS) study. A standardized protocol and automatic exposure control calibration in ldCT imaging acquisition were used. HU measurements at each vertebra (from C3 to L5) were independently assessed by two trained readers at baseline and two years (independent reading sessions ≥3 months apart), according to the methodology described in Figure 1. Mean (standard deviation, SD) for the change-from-baseline HU scores were provided per vertebra by reader. Intraclass correlation coefficients (ICC; absolute agreement, two-way random effects), Bland-Altman plots and smallest detectable change (SDC) were obtained. Also, percentages of vertebrae in which readers agreed on the direction of change and on change scores >|SDC| were computed.
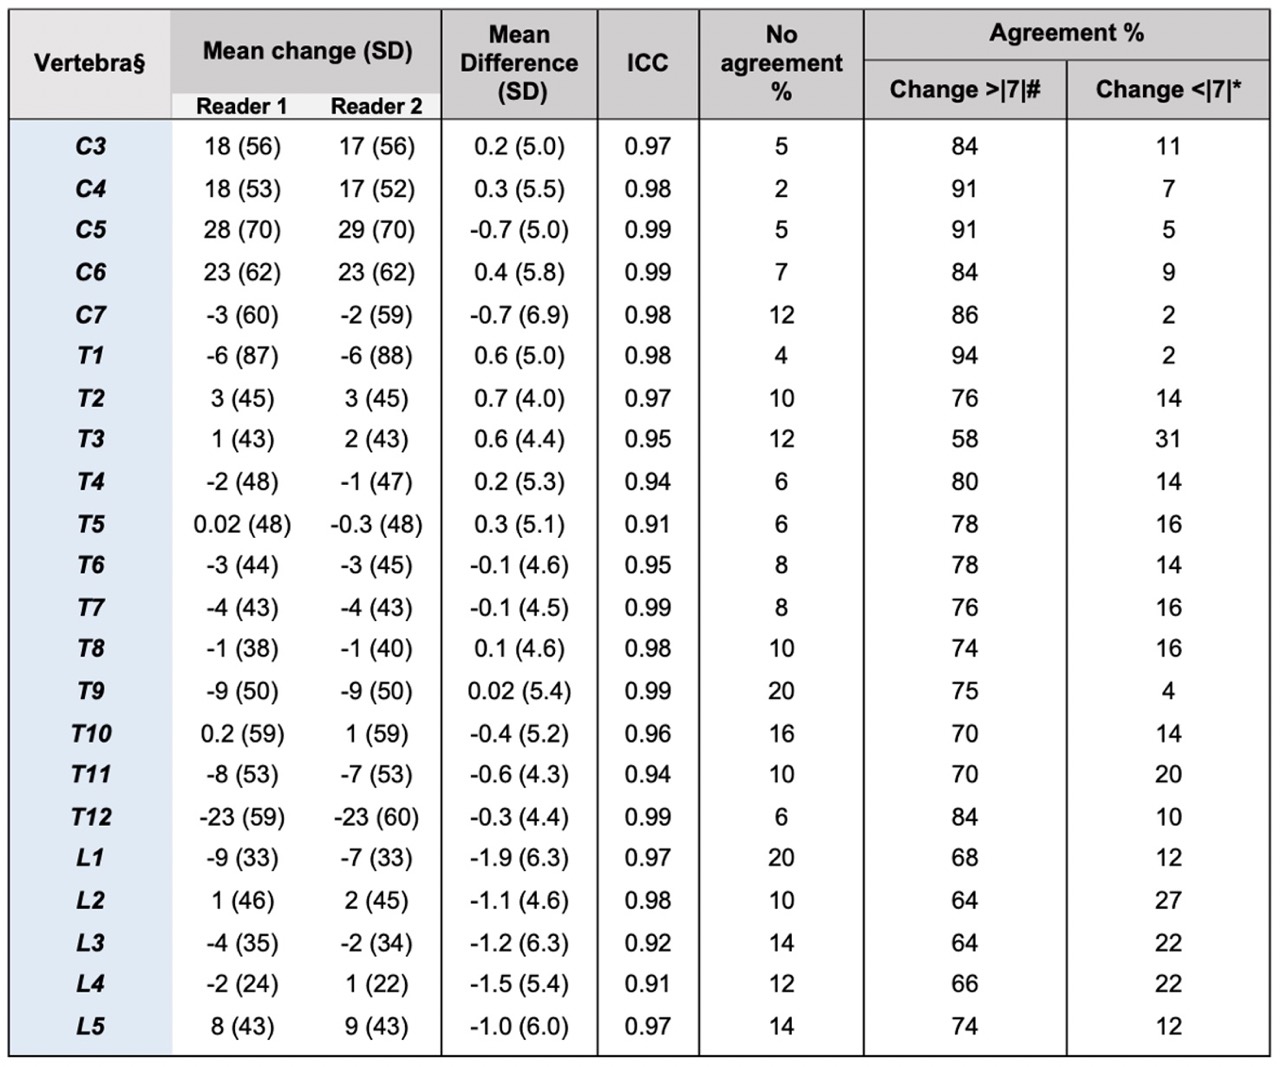
Results: Overall, 1,053 (98% of all possible) vertebrae were assessed at both time-points by each reader. Over two years, HU mean change values varied from -23 to 28 and 29 for reader 1 and 2, respectively – Table 1. Inter-reader reliability for the change-from-baseline scores per vertebra was excellent: ICC: 0.91 to 0.99; SDC: 6 to 10; Bland-Altman plots were homoscedastic, with negligible systematic error between readers. Readers agreed on the direction of the change-score in 88-96% and on change-scores >|SDC| in 58-94% of vertebrae, per vertebral level, from C3 to L5. Overall, similar results were obtained across all vertebrae.
Conclusion: LdCT measurement of HU is a reliable method to assess changes in bone density at each vertebra from C3 to L5. Being reliable across all vertebrae, this methodology can aid the study of bone density changes in r-axSpA, a disease affecting the whole spine.
References: 1. Marques ML, et al. Arthritis Rheumatol. 2021; 73 (suppl 10).
SIAS study was funded by the Dutch Rheumatism Association ("ReumaNederland"). MLM is supported by the Fundação para a Ciência e Tecnologia (FCT) grant SFRH/BD/143744/2019.
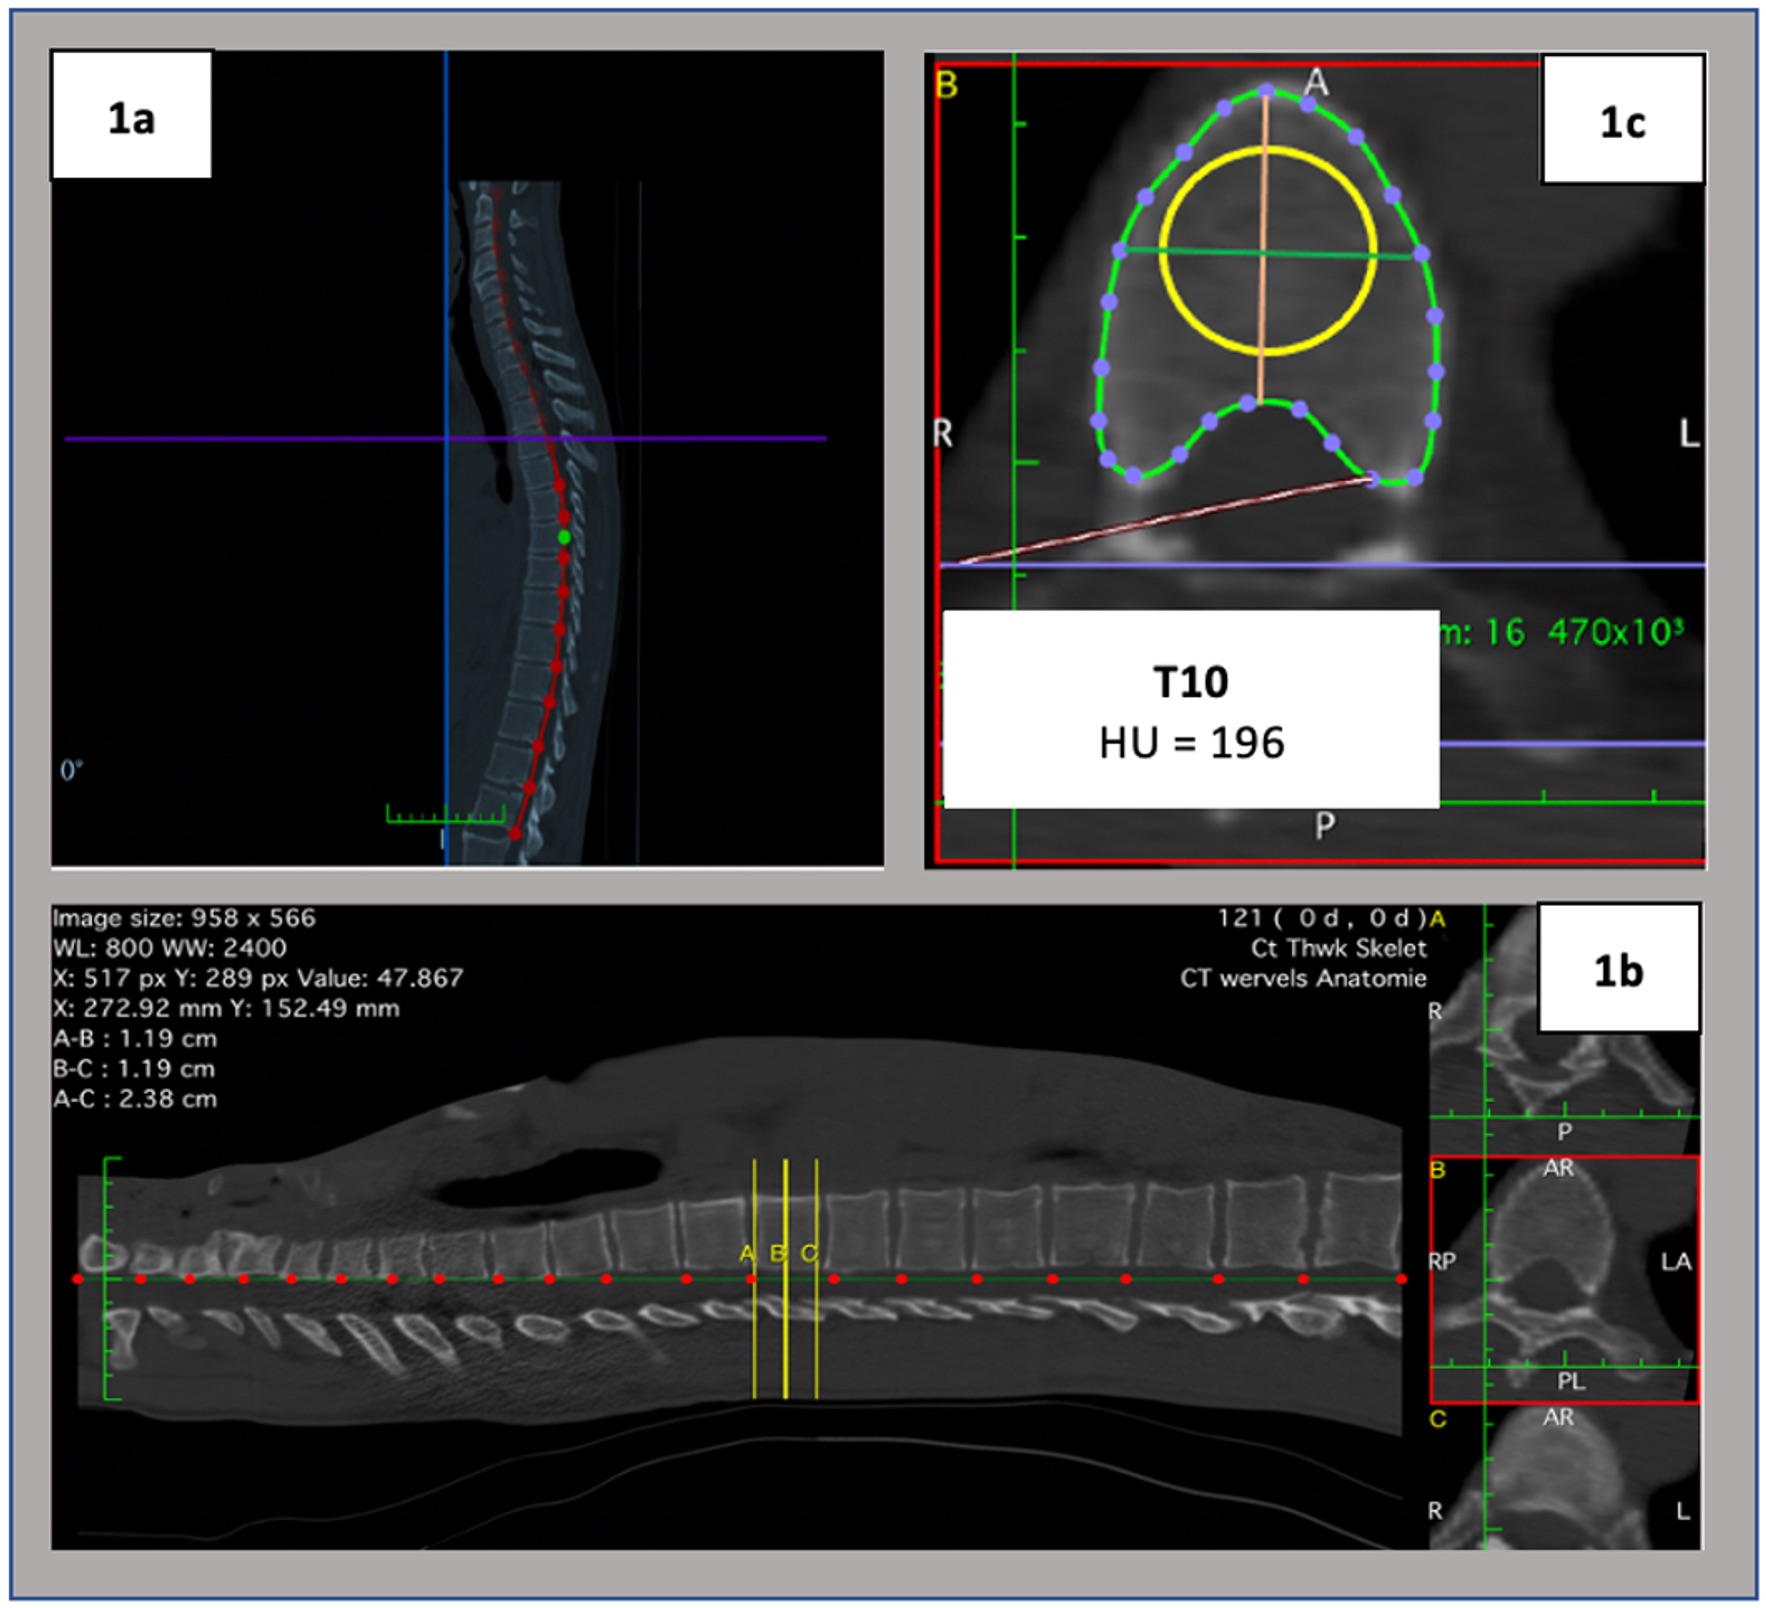
 Figure 1. Methodology of low dose Computed Tomography Hounsfield Units (HU) measurement. 1a: Using a
three-dimensional curved multiplanar reconstruction, the curve of the spine adjacent to the spinal canal was delimited.
1b: On the obtained sagittal image, each vertebra (from C3 to L5) was identifiable. At each vertebra, two lines of
reference were positioned at the superior (yellow line A) and inferior (yellow line C) limits of the vertebra. Equidistant to
A and C, the yellow line B was positioned by the software at the center of the vertebral body. 1c: Vertebral
HU measurements were taken from the reconstructed cross-sectional slice positioned at the center of the vertebra. A
region of interest was manually selected, having a diameter equal to 75% of the average of anteroposterior and
transverse diameters. The density of the vertebra was displayed by the software as the average image intensity within
the sample region, reported in HU.
 Table 1. Change scores for each reader, mean differences between readers, intraclass correlation coefficients (ICC), and agreement on changes beyond measurement error, from C3 to L5. § C3-C7: n=44; T1-L5: n=49. # Percentages of agreement on changes beyond measurement error, i.e., above the absolute value of the smallest detectable change (>|SDC|= >SDC and
Disclosures: M. Marques, None; N. Pereira da Silva, None; D. van der Heijde, AbbVie, Bayer, BMS, Cyxone, Eisai, Galapagos, Gilead, Glaxo-Smith-Kline, Janssen, Novartis, Pfizer, UCB, Imaging Rheumatology bv, Lilly; M. Reijnierse, ASAS, International Skeletal Society; J. Braun, None; X. Baraliakos, AbbVie, Lilly, Galapagos, MSD, Novartis, Pfizer, UCB, Bristol-Myers Squibb, Janssen, Roche, Sandoz, Sanofi; f. van Gaalen, Stichting vrienden van Sole Mio, Stichting ASAS, Jacobus stichting, Novartis, UCB, MSD, AbbVie, Bristol Myers Squibb, Eli Lilly; S. Ramiro, AbbVie/Abbott, Eli Lilly, Galapagos, Merck/MSD, Novartis, Pfizer, UCB, Sanofi.
Background/Purpose: In radiographic axial Spondyloarthritis (r-axSpA), low dose Computed Tomography (ldCT) Hounsfield Units (HU) were shown to cross-sectionally reliably assess bone density at each vertebra from C3 to L5.1 HU change scores have never been studied. In the present study we aimed to describe ldCT HU 2-year change scores and analyse inter-reader reliability per vertebra.
Methods: We used 49 patients with r-axSpA from the multicentre 2-year Sensitive Imaging in Ankylosing Spondylitis (SIAS) study. A standardized protocol and automatic exposure control calibration in ldCT imaging acquisition were used. HU measurements at each vertebra (from C3 to L5) were independently assessed by two trained readers at baseline and two years (independent reading sessions ≥3 months apart), according to the methodology described in Figure 1. Mean (standard deviation, SD) for the change-from-baseline HU scores were provided per vertebra by reader. Intraclass correlation coefficients (ICC; absolute agreement, two-way random effects), Bland-Altman plots and smallest detectable change (SDC) were obtained. Also, percentages of vertebrae in which readers agreed on the direction of change and on change scores >|SDC| were computed.
Results: Overall, 1,053 (98% of all possible) vertebrae were assessed at both time-points by each reader. Over two years, HU mean change values varied from -23 to 28 and 29 for reader 1 and 2, respectively – Table 1. Inter-reader reliability for the change-from-baseline scores per vertebra was excellent: ICC: 0.91 to 0.99; SDC: 6 to 10; Bland-Altman plots were homoscedastic, with negligible systematic error between readers. Readers agreed on the direction of the change-score in 88-96% and on change-scores >|SDC| in 58-94% of vertebrae, per vertebral level, from C3 to L5. Overall, similar results were obtained across all vertebrae.
Conclusion: LdCT measurement of HU is a reliable method to assess changes in bone density at each vertebra from C3 to L5. Being reliable across all vertebrae, this methodology can aid the study of bone density changes in r-axSpA, a disease affecting the whole spine.
References: 1. Marques ML, et al. Arthritis Rheumatol. 2021; 73 (suppl 10).
SIAS study was funded by the Dutch Rheumatism Association ("ReumaNederland"). MLM is supported by the Fundação para a Ciência e Tecnologia (FCT) grant SFRH/BD/143744/2019.
 Figure 1. Methodology of low dose Computed Tomography Hounsfield Units (HU) measurement. 1a: Using a
three-dimensional curved multiplanar reconstruction, the curve of the spine adjacent to the spinal canal was delimited.
1b: On the obtained sagittal image, each vertebra (from C3 to L5) was identifiable. At each vertebra, two lines of
reference were positioned at the superior (yellow line A) and inferior (yellow line C) limits of the vertebra. Equidistant to
A and C, the yellow line B was positioned by the software at the center of the vertebral body. 1c: Vertebral
HU measurements were taken from the reconstructed cross-sectional slice positioned at the center of the vertebra. A
region of interest was manually selected, having a diameter equal to 75% of the average of anteroposterior and
transverse diameters. The density of the vertebra was displayed by the software as the average image intensity within
the sample region, reported in HU.
 Table 1. Change scores for each reader, mean differences between readers, intraclass correlation coefficients (ICC), and agreement on changes beyond measurement error, from C3 to L5. § C3-C7: n=44; T1-L5: n=49. # Percentages of agreement on changes beyond measurement error, i.e., above the absolute value of the smallest detectable change (>|SDC|= >SDC and
 Disclosures: M. Marques, None; N. Pereira da Silva, None; D. van der Heijde, AbbVie, Bayer, BMS, Cyxone, Eisai, Galapagos, Gilead, Glaxo-Smith-Kline, Janssen, Novartis, Pfizer, UCB, Imaging Rheumatology bv, Lilly; M. Reijnierse, ASAS, International Skeletal Society; J. Braun, None; X. Baraliakos, AbbVie, Lilly, Galapagos, MSD, Novartis, Pfizer, UCB, Bristol-Myers Squibb, Janssen, Roche, Sandoz, Sanofi; f. van Gaalen, Stichting vrienden van Sole Mio, Stichting ASAS, Jacobus stichting, Novartis, UCB, MSD, AbbVie, Bristol Myers Squibb, Eli Lilly; S. Ramiro, AbbVie/Abbott, Eli Lilly, Galapagos, Merck/MSD, Novartis, Pfizer, UCB, Sanofi.

