Back
Poster Session B
Rheumatoid arthritis (RA)
Session: (0589–0628) RA – Etiology and Pathogenesis Poster
0614: Post-translationally Modified Fibrinogen Activated Macrophages Drive the Expression of Fibrotic Genes in Rheumatoid Arthritis Fibroblast-Like Synoviocytes
Sunday, November 13, 2022
9:00 AM – 10:30 AM Eastern Time
Location: Virtual Poster Hall
.jpg)
Nozima Aripova, BS
University of Nebraska Medical Center
Omaha, NE, United States
Abstract Poster Presenter(s)
nozima Aripova1, Michael Duryee1, carlos hunter1, Eric Daubach1, Evan Ryan1, Geoffrey Thiele1 and Ted Mikuls2, 1University of Nebraska Medical Center, Omaha, NE, 2Division of Rheumatology, University of Nebraska Medical Center, Omaha, NE
Background/Purpose: Cellular interactions between synovial macrophages and human fibroblast-like synoviocytes (HFLS) contribute to articular inflammation and fibrosis in rheumatoid arthritis (RA), leading to subsequent joint destruction. We have previously shown that malondialdehyde-acetaldehyde (MAA) and citrulline (CIT) modified antigens co-localize in RA synovial tissues. However, the mechanisms by which MAA and CIT modified proteins affect cellular interactions between macrophages and fibroblasts have not been well delineated. The purpose of this study was to identify fibrotic gene expression by HFLS-RA cells in response to: 1) Direct stimulation with MAA and/or CIT modified fibrinogen (FIB); or, 2) Indirect stimulation using secreted soluble factors from macrophages stimulated with MAA and/or CIT modified FIB.
Methods: In a previous study of HFLS-RA cells, the expression of 763 genes using the NanoString® Human Fibrosis Panel was evaluated and top 9 genes expressed were used for further evaluation (Maloley P et.al, 2021). In this study, HFLS-RA cell line was treated with either MAA and/or CIT modified FIB or with supernatants from human macrophage (U-937 cells) that had been collected after stimulation with modified FIB. RNA was isolated 8 hours post-treatment to determine the mRNA levels using RT-PCR. Genes were categorized into four groups (inflammation, initiation, modification, and proliferation) based on their role in the fibrotic pathway, with several genes exerting influence on multiple pathways. The mean of the relative quantity (Rq) of expression for each gene was reported. All the values were compared to the stimulation with native FIB.
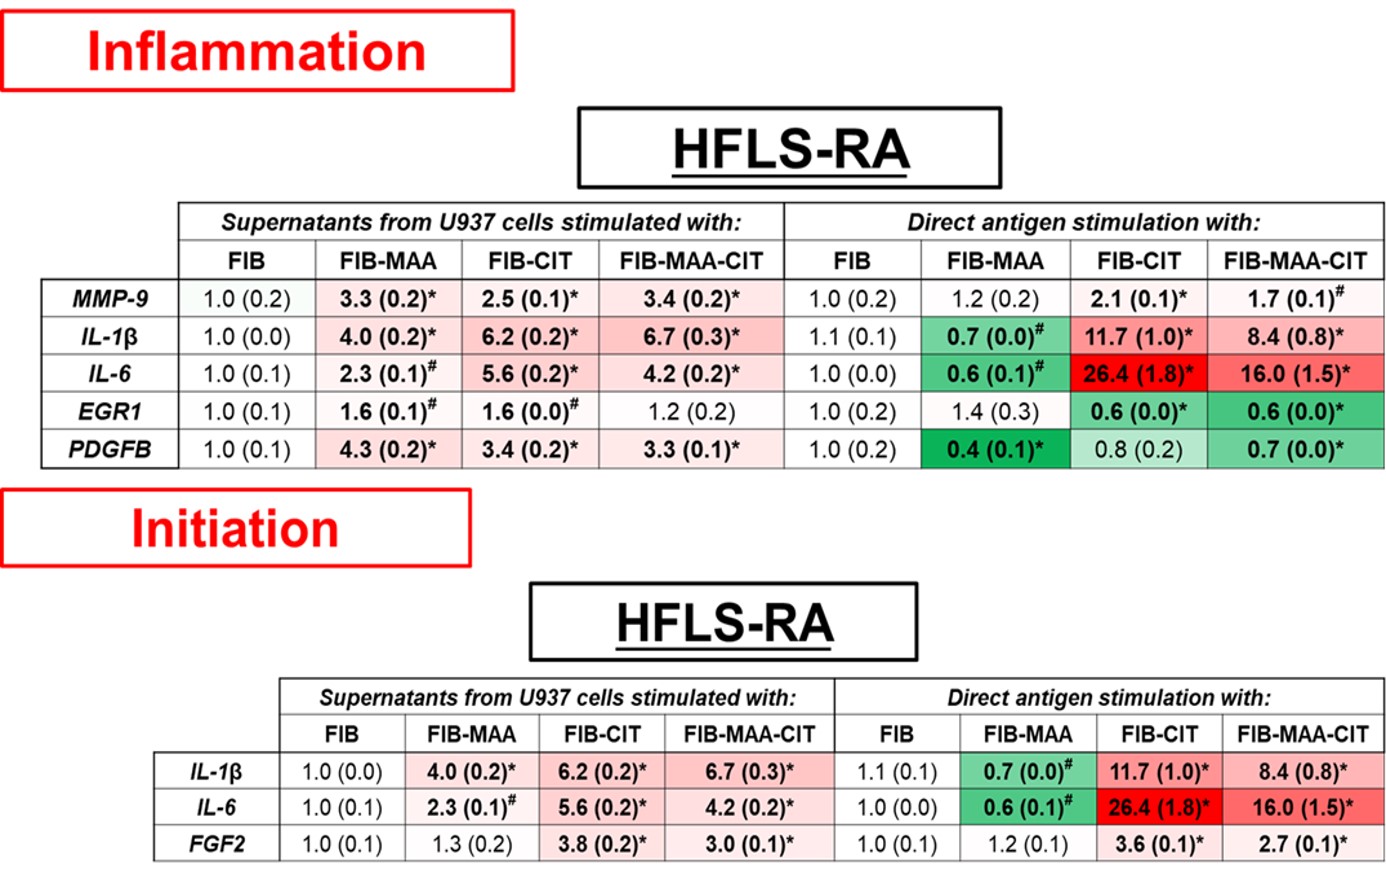
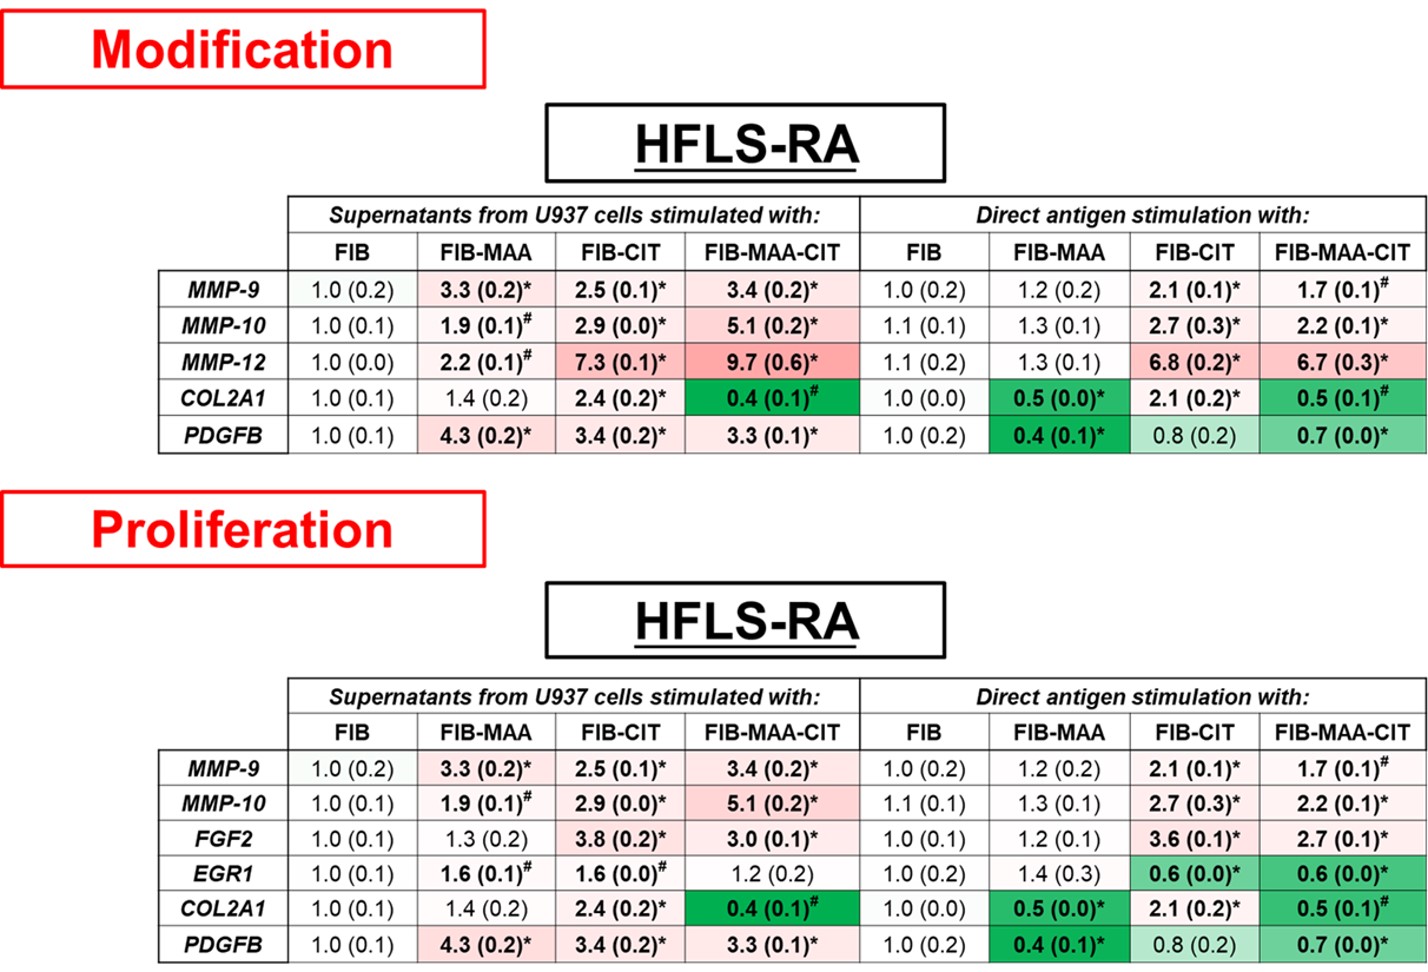
Results: Direct antigen stimulation of HFLS-RA with FIB-CIT demonstrated an amplification of inflammation and initiation genes (Fig.1); MMP-9 (2-fold, p< 0.001 vs. FIB), IL-1β (12-fold, p< 0.001), IL-6 (26-fold, p< 0.001), and FGF2 (4-fold, p< 0.001). HFLS-RA treated with FIB-MAA-CIT amplified the same genes as FIB-CIT, but to a lesser extent. Direct stimulation of HFLS-RA with FIB-MAA significantly decreased IL-1β and IL-6 gene expression (Fig.1). In contrast, exposure of HFLS-RA to macrophage supernatants generated from stimulation with FIB-CIT or FIB-MAA-CIT led to increased expression of modification and proliferation genes; MMP-9, MMP-10, MMP-12, FGF2, EGR1, and PDGFB (Fig.2). When HFLS-RA were treated with U937 supernatants from FIB-MAA stimulated macrophages, MMP-9, IL-1β, IL-6, EGR1, PDGFB, and MMP-10, MMP-12 genes were increased compared to native FIB.
Conclusion: Our studies demonstrate that HFLS-RA cells exposed to MAA and/or CIT modified FIB primarily upregulated markers of inflammation and initiation. However, treatment with macrophage supernatants generated following stimulation with the same modified antigens shifted fibroblast gene expression towards modification and proliferation. These studies showed clearly differentiated responses that both direct antigen stimulation and macrophage interactions are necessary to engage all 4 relevant pathways involved in fibroblast-mediated joint damage that characterizes RA.
 Figure 1. PCR for mRNA levels of inflammation and initiation fibrosis markers from stimulated HFLS-RA cells. HFLS-RA cells were stimulated with either supernatants from modified antigens treated U937 cells or with directly modified antigens. The data is represented as mean (standard deviation) of relative quantity (Rq) of fibrosis markers. All the values are compared to native protein. #p < 0.05, *p < 0.001, n=3.
 Figure 2. PCR for mRNA levels of modification and proliferation fibrosis markers from stimulated HFLS-RA cells. HFLS-RA cells were stimulated with either supernatants from modified antigens treated U937 cells or with directly modified antigens. The data is represented as mean (standard deviation) of relative quantity (Rq) of fibrosis markers. All the values are compared to native protein. #p < 0.05, *p < 0.001, n=3.
Disclosures: n. Aripova, None; M. Duryee, None; c. hunter, None; E. Daubach, None; E. Ryan, None; G. Thiele, None; T. Mikuls, Gilead Sciences, Bristol-Myers Squibb, Horizon, Sanofi, Pfizer Inc.
Background/Purpose: Cellular interactions between synovial macrophages and human fibroblast-like synoviocytes (HFLS) contribute to articular inflammation and fibrosis in rheumatoid arthritis (RA), leading to subsequent joint destruction. We have previously shown that malondialdehyde-acetaldehyde (MAA) and citrulline (CIT) modified antigens co-localize in RA synovial tissues. However, the mechanisms by which MAA and CIT modified proteins affect cellular interactions between macrophages and fibroblasts have not been well delineated. The purpose of this study was to identify fibrotic gene expression by HFLS-RA cells in response to: 1) Direct stimulation with MAA and/or CIT modified fibrinogen (FIB); or, 2) Indirect stimulation using secreted soluble factors from macrophages stimulated with MAA and/or CIT modified FIB.
Methods: In a previous study of HFLS-RA cells, the expression of 763 genes using the NanoString® Human Fibrosis Panel was evaluated and top 9 genes expressed were used for further evaluation (Maloley P et.al, 2021). In this study, HFLS-RA cell line was treated with either MAA and/or CIT modified FIB or with supernatants from human macrophage (U-937 cells) that had been collected after stimulation with modified FIB. RNA was isolated 8 hours post-treatment to determine the mRNA levels using RT-PCR. Genes were categorized into four groups (inflammation, initiation, modification, and proliferation) based on their role in the fibrotic pathway, with several genes exerting influence on multiple pathways. The mean of the relative quantity (Rq) of expression for each gene was reported. All the values were compared to the stimulation with native FIB.
Results: Direct antigen stimulation of HFLS-RA with FIB-CIT demonstrated an amplification of inflammation and initiation genes (Fig.1); MMP-9 (2-fold, p< 0.001 vs. FIB), IL-1β (12-fold, p< 0.001), IL-6 (26-fold, p< 0.001), and FGF2 (4-fold, p< 0.001). HFLS-RA treated with FIB-MAA-CIT amplified the same genes as FIB-CIT, but to a lesser extent. Direct stimulation of HFLS-RA with FIB-MAA significantly decreased IL-1β and IL-6 gene expression (Fig.1). In contrast, exposure of HFLS-RA to macrophage supernatants generated from stimulation with FIB-CIT or FIB-MAA-CIT led to increased expression of modification and proliferation genes; MMP-9, MMP-10, MMP-12, FGF2, EGR1, and PDGFB (Fig.2). When HFLS-RA were treated with U937 supernatants from FIB-MAA stimulated macrophages, MMP-9, IL-1β, IL-6, EGR1, PDGFB, and MMP-10, MMP-12 genes were increased compared to native FIB.
Conclusion: Our studies demonstrate that HFLS-RA cells exposed to MAA and/or CIT modified FIB primarily upregulated markers of inflammation and initiation. However, treatment with macrophage supernatants generated following stimulation with the same modified antigens shifted fibroblast gene expression towards modification and proliferation. These studies showed clearly differentiated responses that both direct antigen stimulation and macrophage interactions are necessary to engage all 4 relevant pathways involved in fibroblast-mediated joint damage that characterizes RA.
 Figure 1. PCR for mRNA levels of inflammation and initiation fibrosis markers from stimulated HFLS-RA cells. HFLS-RA cells were stimulated with either supernatants from modified antigens treated U937 cells or with directly modified antigens. The data is represented as mean (standard deviation) of relative quantity (Rq) of fibrosis markers. All the values are compared to native protein. #p < 0.05, *p < 0.001, n=3.
 Figure 2. PCR for mRNA levels of modification and proliferation fibrosis markers from stimulated HFLS-RA cells. HFLS-RA cells were stimulated with either supernatants from modified antigens treated U937 cells or with directly modified antigens. The data is represented as mean (standard deviation) of relative quantity (Rq) of fibrosis markers. All the values are compared to native protein. #p < 0.05, *p < 0.001, n=3.
Disclosures: n. Aripova, None; M. Duryee, None; c. hunter, None; E. Daubach, None; E. Ryan, None; G. Thiele, None; T. Mikuls, Gilead Sciences, Bristol-Myers Squibb, Horizon, Sanofi, Pfizer Inc.

