Back
Plenary Session
Osteoarthritis (OA) and related disorders
Session: Plenary II
1116: Peripheral Blood DNA Methylation-based Machine Learning Models for Prediction of Knee Osteoarthritis Progression: Biospecimens and Data from the Osteoarthritis Initiative and Johnston County Osteoarthritis Project
Sunday, November 13, 2022
12:30 PM – 12:40 PM Eastern Time
Location: Exhibit Hall A
- MJ
Matlock A. Jeffries, MD, FACP, FACR
Oklahoma Medical Research Foundation
Oklahoma City, OK, United States
Presenting Author(s)
Chris Dunn1, Cassandra Sturdy2, Cassandra Velasco3, Leoni Schlupp2, Emmaline Prinz2, Vladislav Izda4, Liubov Arbeeva5, Yvonne Golightly6, Amanda Nelson7 and Matlock Jeffries2, 1University of Oklahoma Health Sciences Center, Edmond, OK, 2Oklahoma Medical Research Foundation, Oklahoma City, OK, 3University of Oklahoma Health Sciences Center, Oklahoma City, OK, 4Oklahoma Medical Research Foundation, New York, NY, 5University of North Carolina Chapel Hill, Chapel Hill, NC, 6University of Nebraska Medical Center, Omaha, NE, 7University of North Carolina at Chapel Hill, Chapel Hill, NC
Background/Purpose: Knee osteoarthritis (OA) is a heterogeneous disease characterized by a variety of clinical and molecular phenotypes, for which there exist no widely-available biomarkers. We have previously published a pilot analysis of baseline peripheral blood cell DNA methylation patterns as biomarkers of future radiographic progression. In the current study, we apply this method to the FNIH OsteoArthritis Biomarkers Consortium (OABC) subcohort of the OAI including pain-, radiographic-, and dual- (pain+radiographic) progressors compared to nonprogressors and to similarly constructed groups in the Johnston County Osteoarthritis Project (JoCoOA) and an independent OAI cohort from our prior work.
Methods: Buffy coat DNA was obtained from the OAI cohort from baseline visits of OABC participants (n=554). 500ng of DNA was bisulfite treated and loaded onto Illumina EPIC arrays then imaged by the Clinical Genomics Center at the Oklahoma Medical Research Foundation. Raw data were extracted and BMIQ normalized using the ChAMP package. Elastic net-penalized generalized linear models (GLMs) were then developed using 40 cycles of a 70%-development, 30%-validation data split. Parsimonious models were developed by reducing the dataset to include DNA methylation sites selected in ≥10/40 development rounds (n=13 CpGs). Parsimonious models were tested on an independent radiographic progressor validation cohort from the JoCoOA, including 85 future progressors (≥1 K/L grade worsening at 48 mo or joint replacement) and 56 non-progressors (no- or within-grade K/L worsening) and on DNA methylation data from our previous peripheral blood methylation work including an indepdent set of 27 radiographic-only and 28 non-progressors within the OAI.
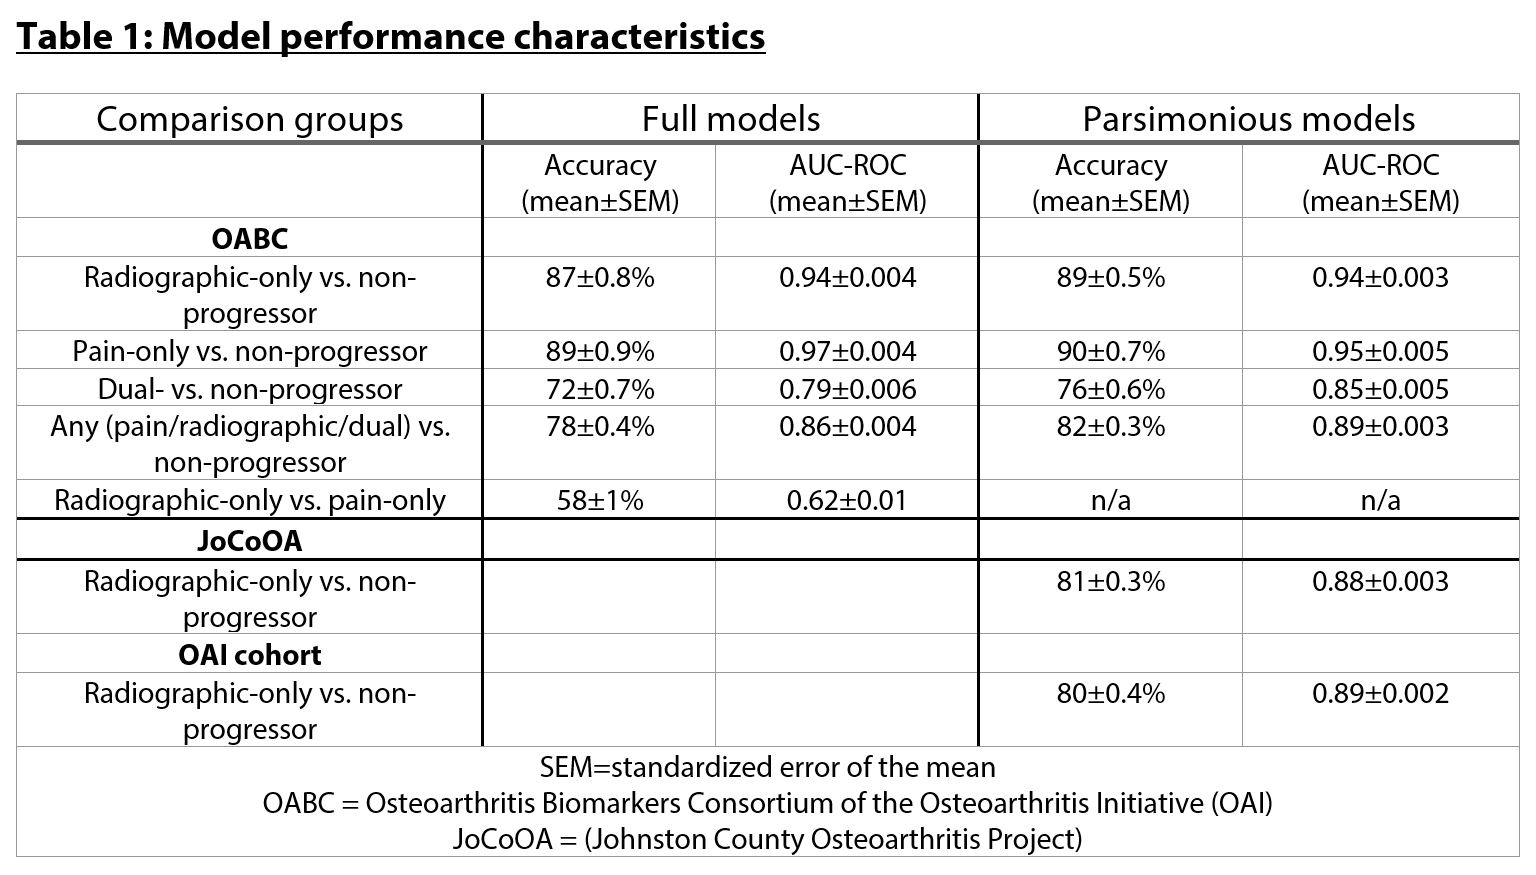
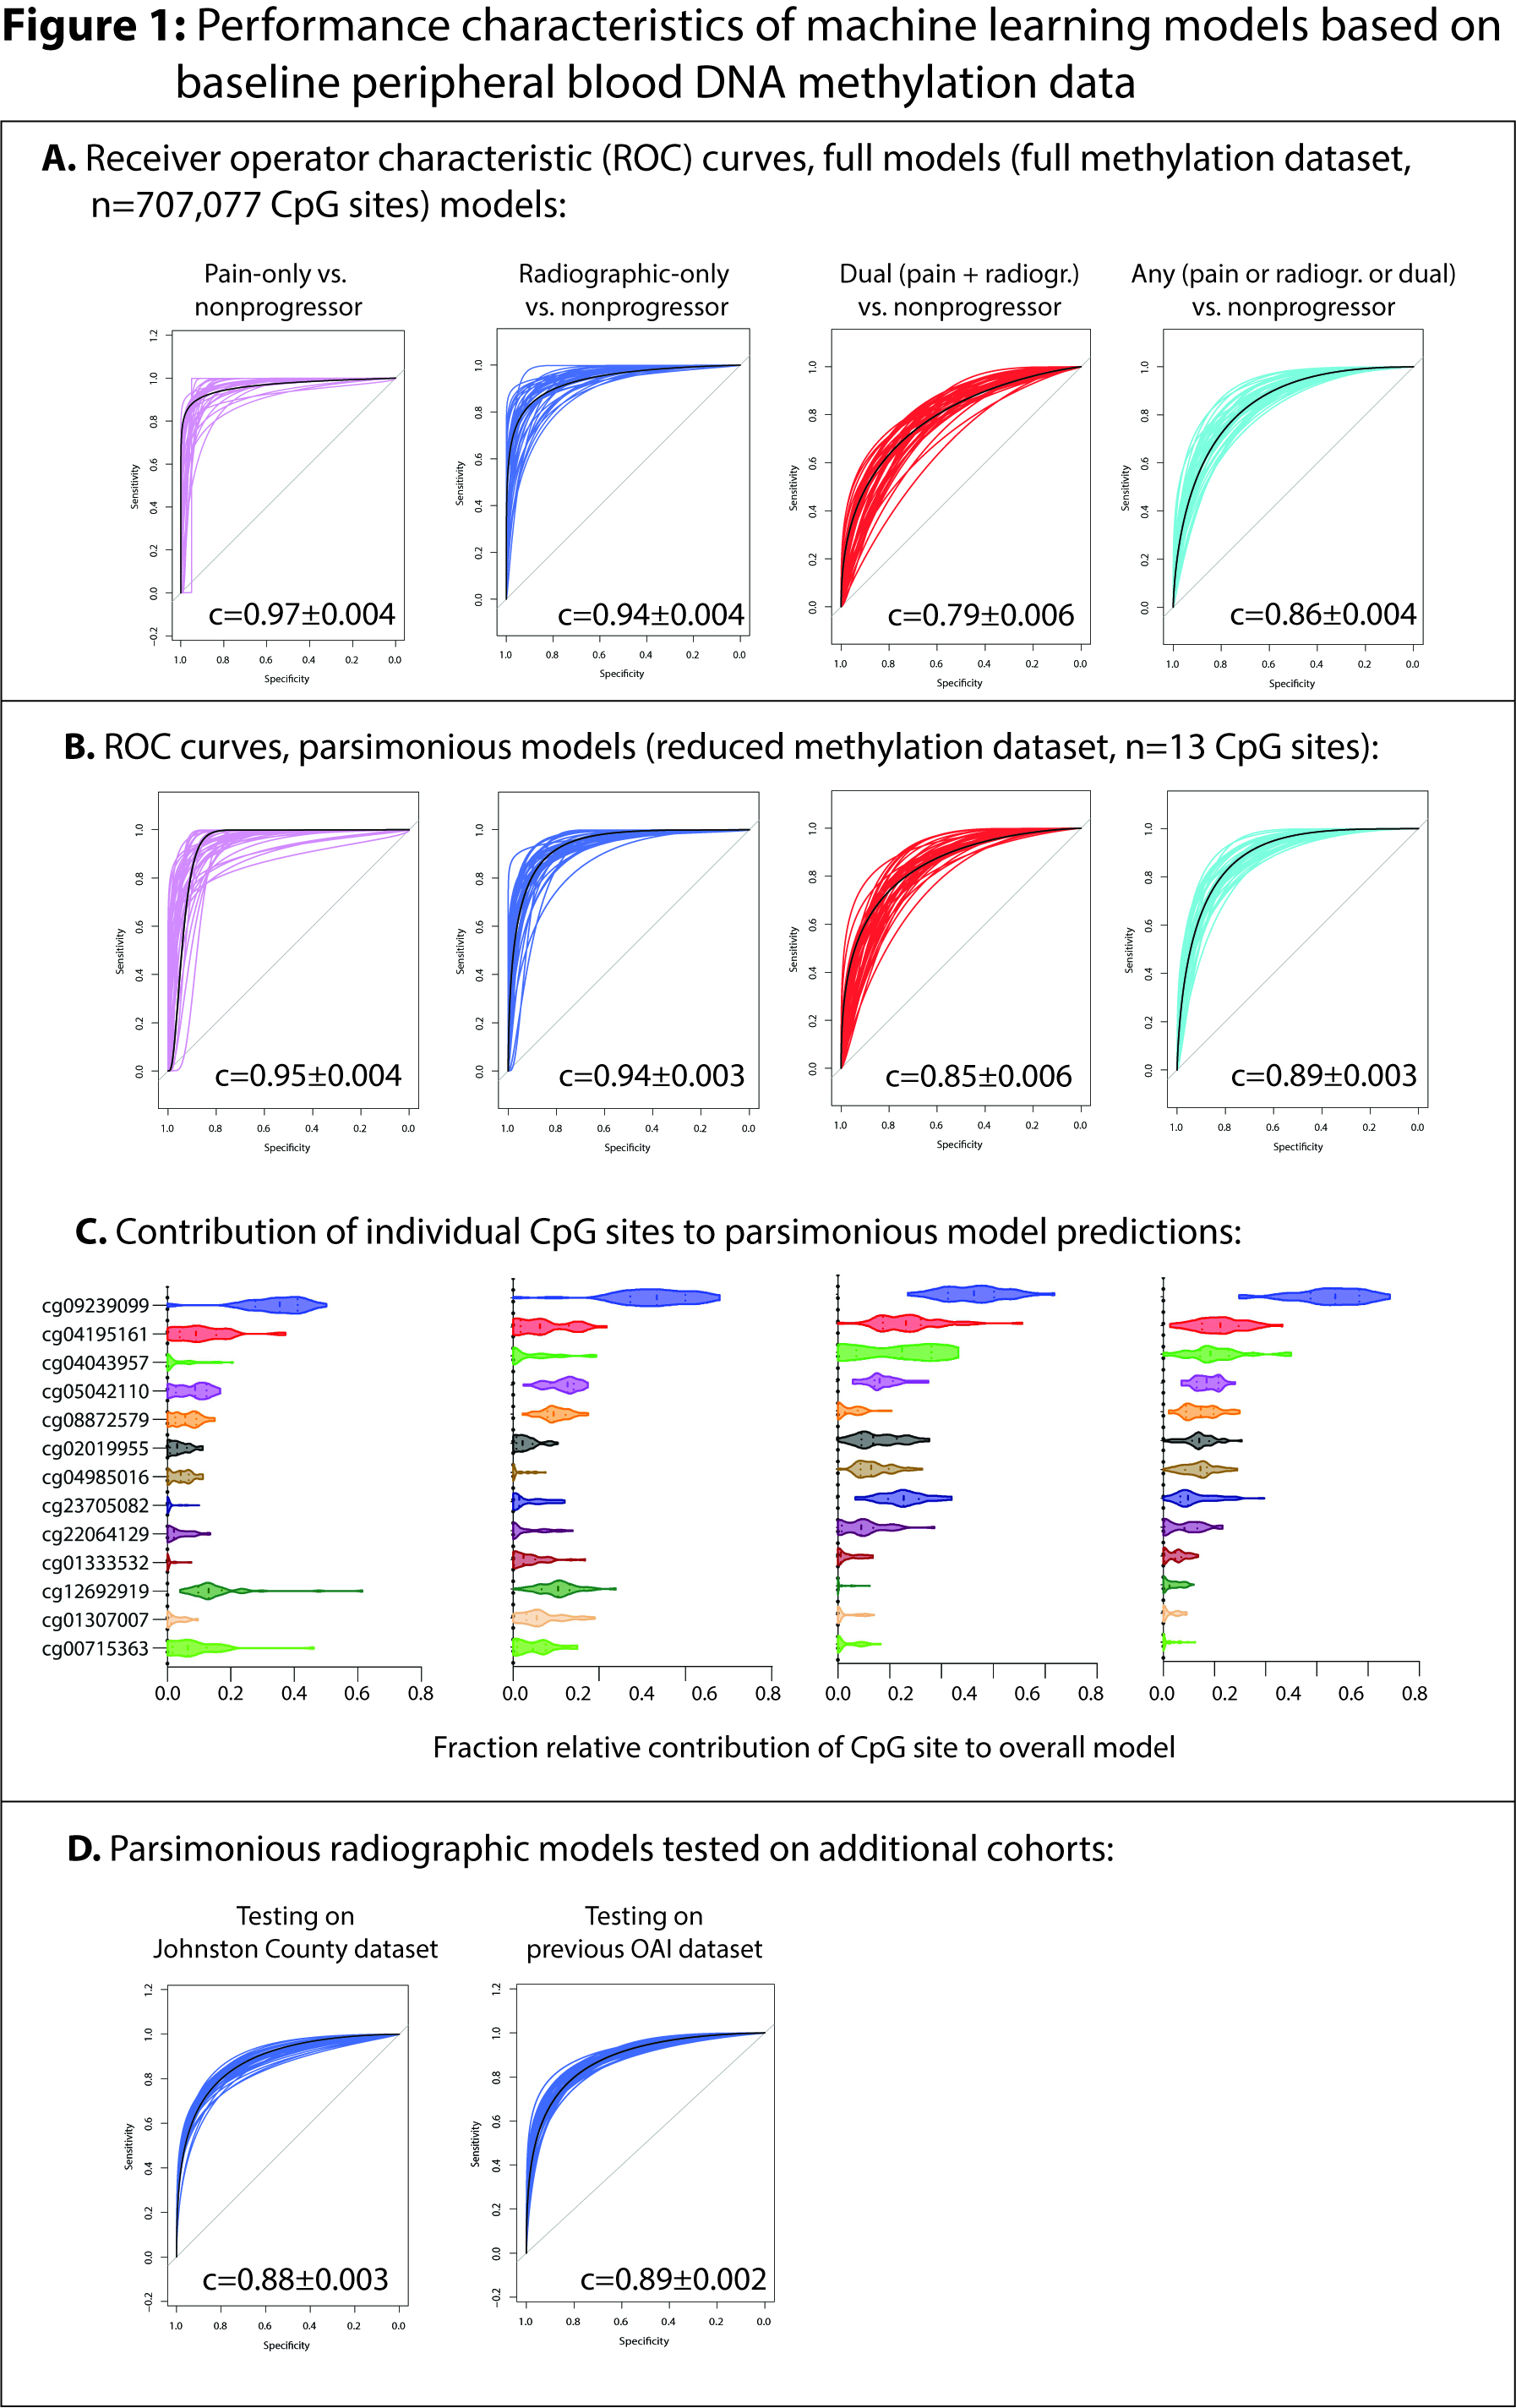
Results: Baseline buffy coat DNA methylation patterns accurately predicted future radiographic (accuracy 87±0.8% mean±standard error of mean [SEM], Table 1), pain (89±0.9%), dual radiographic+pain (72±0.7%), and 'any' progressors (radiographic, pain, or dual, 78±0.4%). Intriguingly, pain-only and radiographic-only progressors were not distinguishable (accuracy 58±1%). The inclusion of demographic characteristics or baseline serum/urine analytes did not alter model performance. Parsimonious models including the top 13 CpG sites selected during full development had similar accuracy. Despite differences in the definition of radiographic progression, models still accurately discriminated radiographic progressors from non-progressors in both the JoCoOA (81±0.3%) and OAI (80±0.3%) validation cohorts.
Conclusion: Herein, we evaluated the predictive capability of peripheral blood-based DNA methylation models in a large cohort of participants with OA (OABC) and confirmed these findings in two independent cohorts. Our data suggest that pain and structural progression share similar early systemic immune epigenotypes. Further work should focus on evaluating the pathophysiological consequences of differential DNA methylation of peripheral blood cell subtypes in individuals with knee OA.
 Table 1
 Figure 1: Performance of peripheral blood DNA methylation machine learning models to predict future knee OA progression. (A) Receiver operator characteristic (ROC) curves for full models. (B) ROC curves for parsimonious models following reduction in dataset to 13 CpG sites most frequently selected during full model development. (C) Relative contribution of individual CpG sites (features) to model predictions in 40 rounds of parsimonious model development (D) ROC curves for parsimonious models tested on independent datasets including the Johnston County OA project (JoCoOA) and a previously published OAI buffy coat DNA methylation dataset
Disclosures: C. Dunn, None; C. Sturdy, None; C. Velasco, None; L. Schlupp, None; E. Prinz, None; V. Izda, None; L. Arbeeva, None; Y. Golightly, None; A. Nelson, None; M. Jeffries, None.
Background/Purpose: Knee osteoarthritis (OA) is a heterogeneous disease characterized by a variety of clinical and molecular phenotypes, for which there exist no widely-available biomarkers. We have previously published a pilot analysis of baseline peripheral blood cell DNA methylation patterns as biomarkers of future radiographic progression. In the current study, we apply this method to the FNIH OsteoArthritis Biomarkers Consortium (OABC) subcohort of the OAI including pain-, radiographic-, and dual- (pain+radiographic) progressors compared to nonprogressors and to similarly constructed groups in the Johnston County Osteoarthritis Project (JoCoOA) and an independent OAI cohort from our prior work.
Methods: Buffy coat DNA was obtained from the OAI cohort from baseline visits of OABC participants (n=554). 500ng of DNA was bisulfite treated and loaded onto Illumina EPIC arrays then imaged by the Clinical Genomics Center at the Oklahoma Medical Research Foundation. Raw data were extracted and BMIQ normalized using the ChAMP package. Elastic net-penalized generalized linear models (GLMs) were then developed using 40 cycles of a 70%-development, 30%-validation data split. Parsimonious models were developed by reducing the dataset to include DNA methylation sites selected in ≥10/40 development rounds (n=13 CpGs). Parsimonious models were tested on an independent radiographic progressor validation cohort from the JoCoOA, including 85 future progressors (≥1 K/L grade worsening at 48 mo or joint replacement) and 56 non-progressors (no- or within-grade K/L worsening) and on DNA methylation data from our previous peripheral blood methylation work including an indepdent set of 27 radiographic-only and 28 non-progressors within the OAI.
Results: Baseline buffy coat DNA methylation patterns accurately predicted future radiographic (accuracy 87±0.8% mean±standard error of mean [SEM], Table 1), pain (89±0.9%), dual radiographic+pain (72±0.7%), and 'any' progressors (radiographic, pain, or dual, 78±0.4%). Intriguingly, pain-only and radiographic-only progressors were not distinguishable (accuracy 58±1%). The inclusion of demographic characteristics or baseline serum/urine analytes did not alter model performance. Parsimonious models including the top 13 CpG sites selected during full development had similar accuracy. Despite differences in the definition of radiographic progression, models still accurately discriminated radiographic progressors from non-progressors in both the JoCoOA (81±0.3%) and OAI (80±0.3%) validation cohorts.
Conclusion: Herein, we evaluated the predictive capability of peripheral blood-based DNA methylation models in a large cohort of participants with OA (OABC) and confirmed these findings in two independent cohorts. Our data suggest that pain and structural progression share similar early systemic immune epigenotypes. Further work should focus on evaluating the pathophysiological consequences of differential DNA methylation of peripheral blood cell subtypes in individuals with knee OA.
 Table 1
 Figure 1: Performance of peripheral blood DNA methylation machine learning models to predict future knee OA progression. (A) Receiver operator characteristic (ROC) curves for full models. (B) ROC curves for parsimonious models following reduction in dataset to 13 CpG sites most frequently selected during full model development. (C) Relative contribution of individual CpG sites (features) to model predictions in 40 rounds of parsimonious model development (D) ROC curves for parsimonious models tested on independent datasets including the Johnston County OA project (JoCoOA) and a previously published OAI buffy coat DNA methylation dataset
Disclosures: C. Dunn, None; C. Sturdy, None; C. Velasco, None; L. Schlupp, None; E. Prinz, None; V. Izda, None; L. Arbeeva, None; Y. Golightly, None; A. Nelson, None; M. Jeffries, None.

