Back
Poster Session A
Rheumatoid arthritis (RA)
Session: (0241–0271) RA – Diagnosis, Manifestations, and Outcomes Poster I
0242: Neural Networks for Distinguishing Rheumatoid Arthritis from Psoriatic Arthritis by Using Magnetic Resonance Imaging
Saturday, November 12, 2022
1:00 PM – 3:00 PM Eastern Time
Location: Virtual Poster Hall
- LF
Lukas Folle, MSc
Friedrich-Alexander-Universität Erlangen Nürnberg
Erlangen, Germany
Abstract Poster Presenter(s)
Lukas Folle1, Sara Bayat2, Arnd Kleyer3, Filippo Fagni2, Lorenz Kapsner4, Maja Schlereth5, Timo Meinderink2, Katharina Breininger5, Koray Tascilar3, Gerhard Kroenke3, Michael Uder6, MIchael Sticherling7, Sebastian Bickelhaupt4, Georg Schett8, Andreas Maier9, Frank Roemer10 and David Simon3, 1Friedrich-Alexander-Universitaet Erlangen Nürnberg, Erlangen, Germany, 2University Hospital Erlangen; Department of Internal Medicine 3 - Rheumatology and Immunology, Erlangen, Germany, 3Department of Internal Medicine 3 – Rheumatology and Immunology, Friedrich-Alexander-University Erlangen-Nürnberg and Universitätsklinikum Erlangen, 91054 Erlangen, Germany; Deutsches Zentrum Immuntherapie, Friedrich-Alexander-UniversityErlangen-Nürnberg and Universitätsklinikum Erlangen, Erlangen, Germany, 4University Hospital Erlangen; Institute of Radiology, Erlangen, Germany, 5Friedrich-Alexander Universität Erlangen-Nürnberg, Artificial Intelligence in Medical Imaging, Erlangen, Germany, 6University Hospital Erlangen; Lehrstuhl für Diagnostische Radiologie, Erlangen, Germany, 7University Hospital Erlangen; Institute of Dermatology, Erlangen, Germany, 8Universitätsklinikum Erlangen, Erlangen, Germany, 9Friedrich-Alexander-Universität Erlangen-Nürnberg, Lehrstuhl für Mustererkennung, Erlangen, Germany, 10Friedrich-Alexander University Erlangen Nürnberg, Erlangen, Germany
Background/Purpose: To evaluate (i) whether neural networks can distinguish seropositive rheumatoid arthritis (RA+), seronegative RA (RA-), and psoriatic arthritis (PsA) using MRI data based on the structural inflammation patterns.
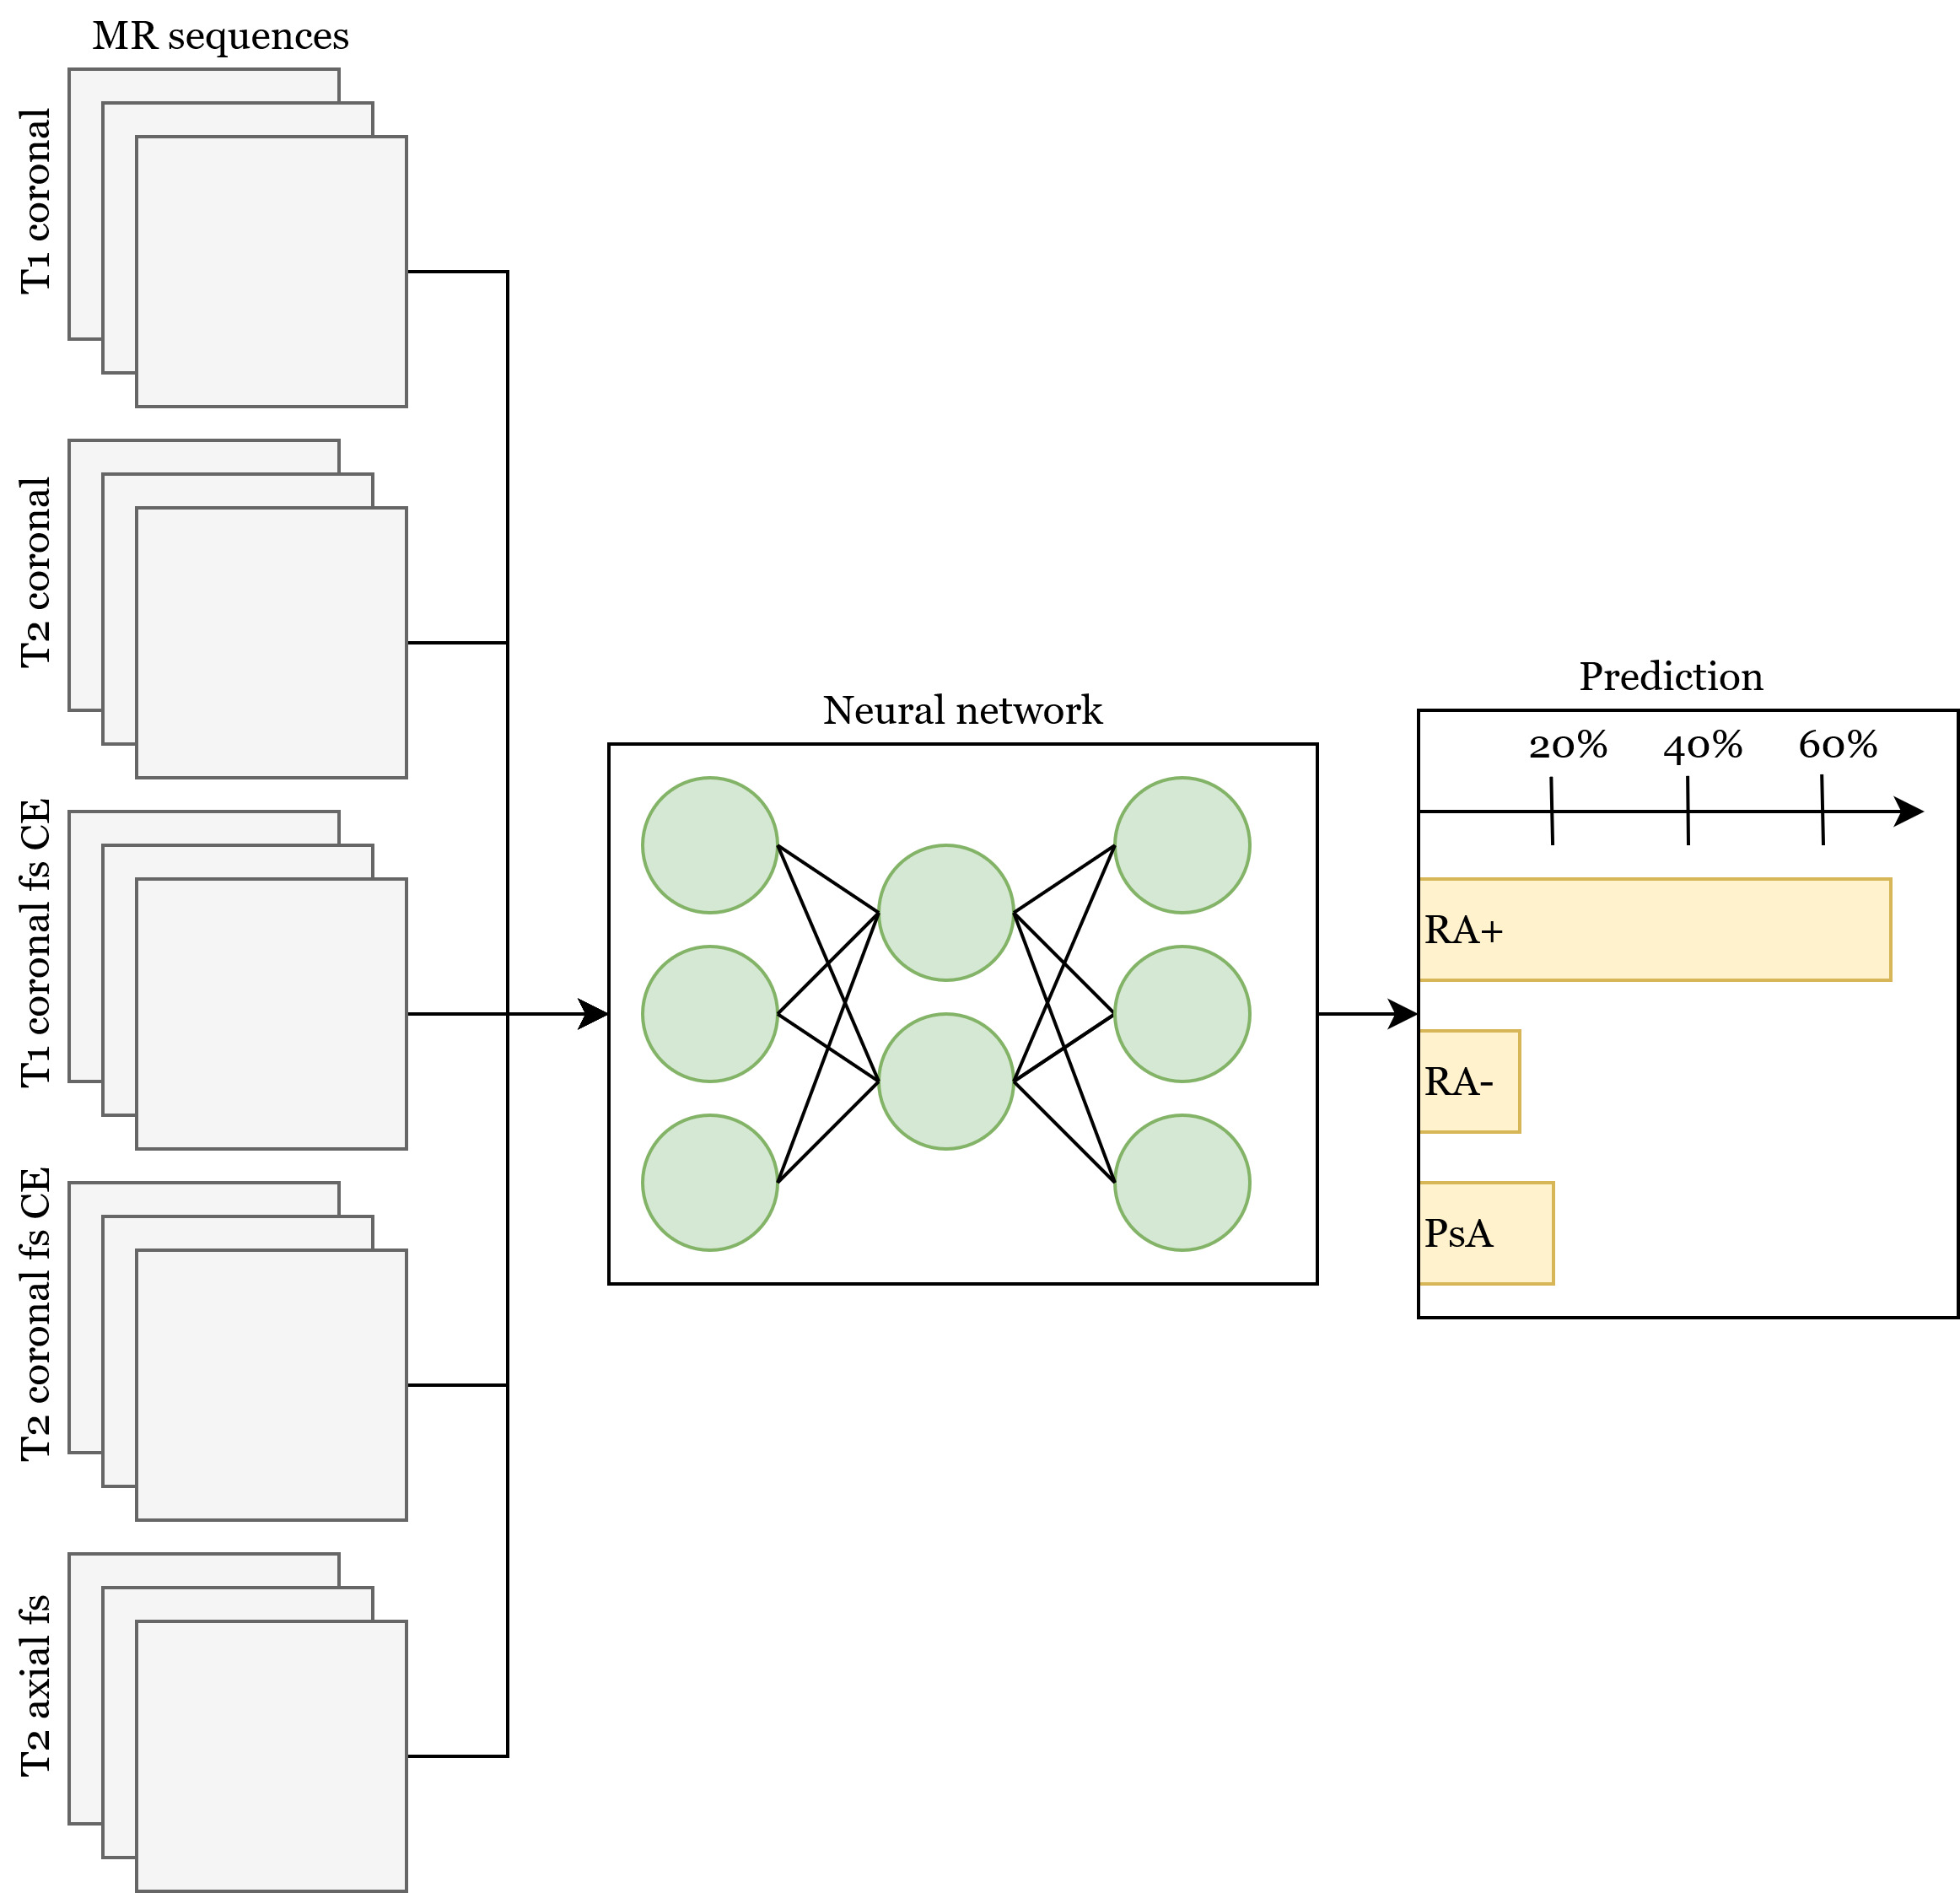
Methods: Neural networks based on the ResNet [1] architecture were trained to distinguish (i) RA+ vs. PsA, (ii) RA- vs. PsA and (iii) RA+ vs. RA- using hand MRI data. MR sequences consisted of five different sequences (T1 coronal, T2 coronal, T1 coronal and axial fat suppressed contrast-enhanced (CE), and T2 fat suppressed axial). Two neural network trainings were performed, where (i) the neural network had access only to MR data and (ii) then to MR and clinical and demographic data (Figure 1). Using a specialized visualization technique for the neural networks (occlusion) the regions most important for the network were recorded and correlated to the respective anatomical regions by an experienced rheumatologist [2,3].
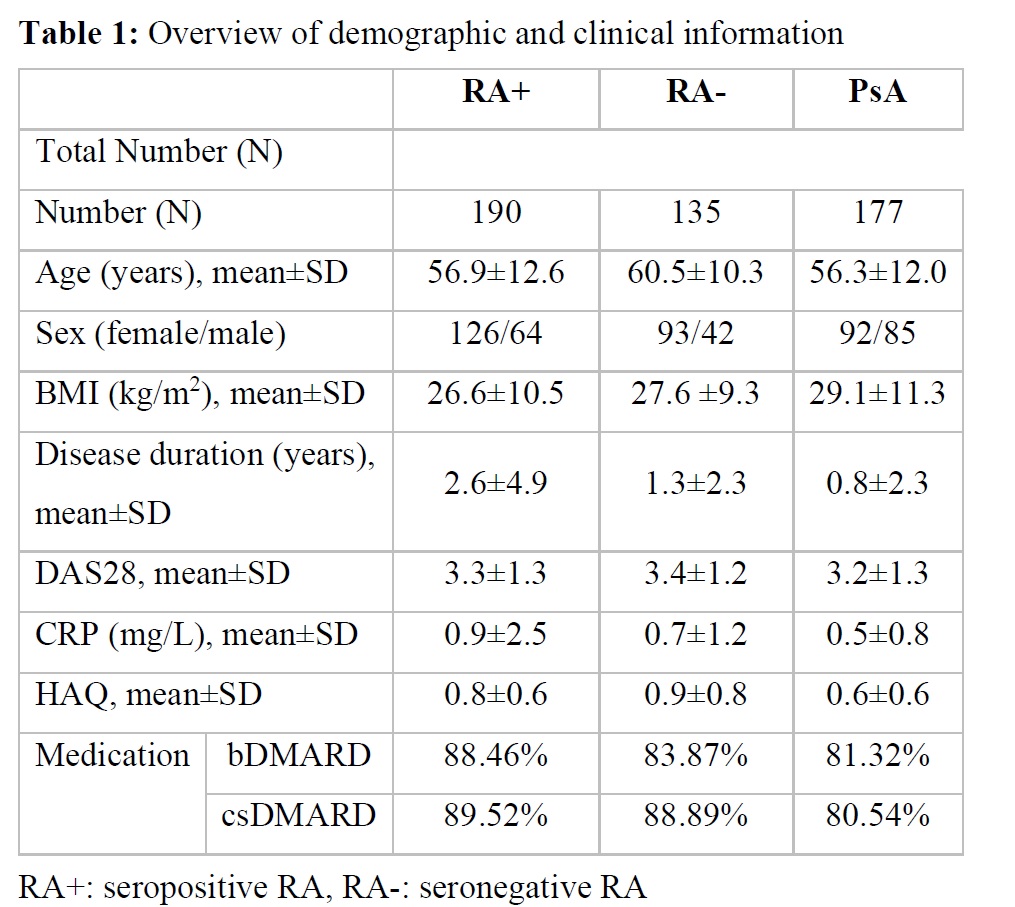
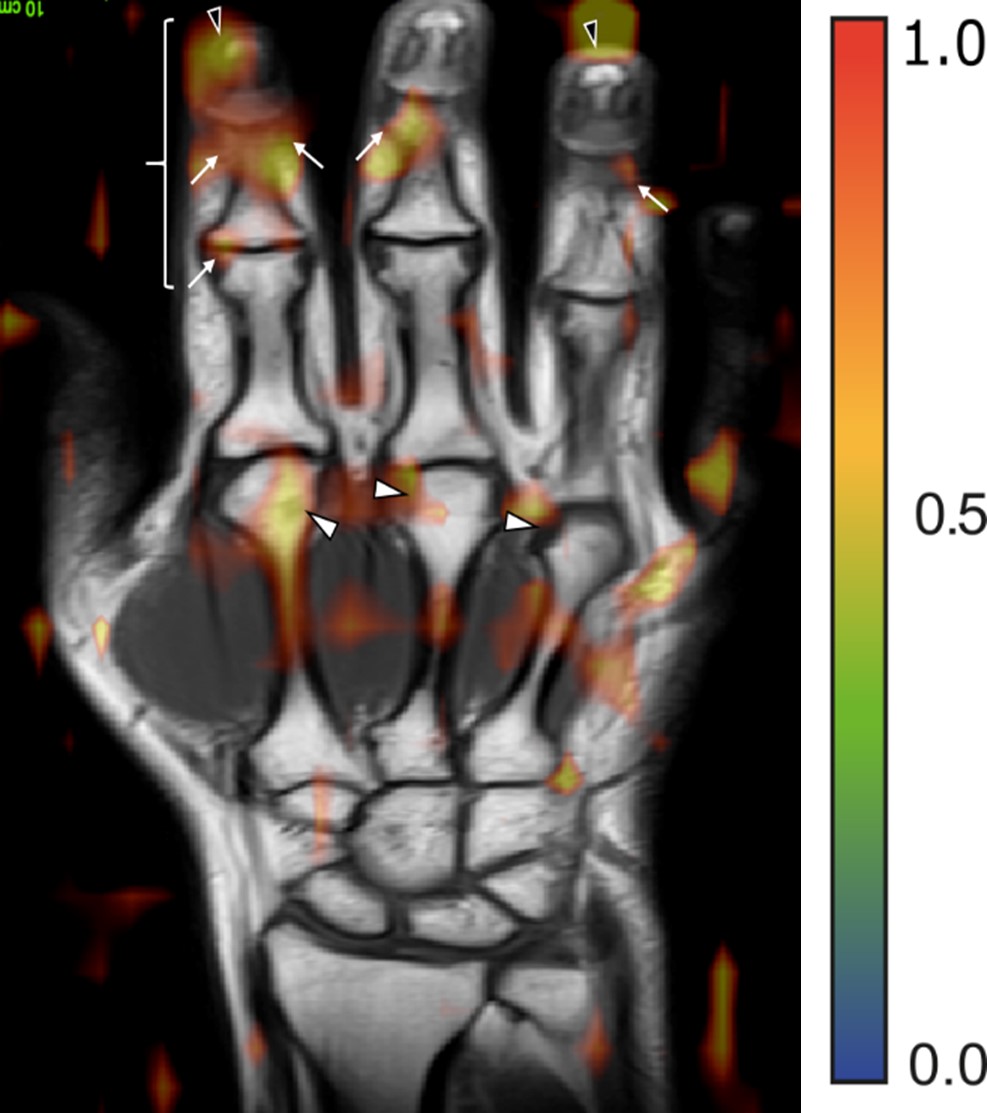
Results: The dataset consisted of MRI scans from 502 patients (135 RA-, 190 RA+, 177 PsA) (Table 1). Differentiation between disease entities as measured by the AUROC was 75% (SD 3%) for RA+ vs PsA, 74% (SD 8%) for RA- vs PsA, and 67% (6%) for RA+ vs RA-. All MR sequences were important for neural network performance, but without contrast-enhanced sequences, the difference in performance was marginal. Adding demographic and clinical parameters to MR dada did not improve the performance of the neural network significantly. Interestingly, the regions important for the network were regions, which also had clinical relevance (Figure 2).
Conclusion: Neural networks can help distinguish between different forms of inflammatory arthritis based on MRI inflammatory patterns, apparently focusing on regions of clinical relevance.
References [1] Kensho Hara, Hirokatsu Kataoka, and Yutaka Satoh 2018. Can Spatiotemporal 3D CNNs Retrace the History of 2D CNNs and ImageNet? In Proceedings of the IEEE Conference on Computer Vision and Pattern Recognition (CVPR) (pp. 6546–6555).
[2] Østergaard M, McQueen F, Wiell C, et al. The OMERACT Psoriatic Arthritis Magnetic Resonance Imaging Scoring System (PsAMRIS): Definitions of key pathologies, suggested MRI sequences, and preliminary scoring system for PsA hands. J Rheumatol 2009;36:1816–24. doi:10.3899/jrheum.090352
[3] Østergaard M, Peterfy C, Conaghan P, et al. OMERACT Rheumatoid Arthritis Magnetic Resonance Imaging Studies. Core set of MRI acquisitions, joint pathology definitions, and the OMERACT RA-MRI scoring system. J Rheumatol 2003;30:1385–6.
 Table 1: Overview of demographic and clinical information
 Figure 1: Neural network combining all MR sequences along with the optional additional clinical and demographical data. The prediction for a single case is formed by averaging the prediction of all sequences and the clinical data.
 Figure 2: MR image with the overlay of the attention map generated by the neural network for a patient affected by PsA. Arrows mark regions of pathological joint changes (soft tissue inflammation and enthesitis).
Disclosures: L. Folle, None; S. Bayat, None; A. Kleyer, None; F. Fagni, None; L. Kapsner, None; M. Schlereth, None; T. Meinderink, None; K. Breininger, None; K. Tascilar, Gılead, AbbVie/Abbott, UCB, Eli Lilly; G. Kroenke, None; M. Uder, None; M. Sticherling, None; S. Bickelhaupt, None; G. Schett, None; A. Maier, None; F. Roemer, Boston Imaging Core Lab (BICL) LLC., Grünenthal, Calibr; D. Simon, None.
Background/Purpose: To evaluate (i) whether neural networks can distinguish seropositive rheumatoid arthritis (RA+), seronegative RA (RA-), and psoriatic arthritis (PsA) using MRI data based on the structural inflammation patterns.
Methods: Neural networks based on the ResNet [1] architecture were trained to distinguish (i) RA+ vs. PsA, (ii) RA- vs. PsA and (iii) RA+ vs. RA- using hand MRI data. MR sequences consisted of five different sequences (T1 coronal, T2 coronal, T1 coronal and axial fat suppressed contrast-enhanced (CE), and T2 fat suppressed axial). Two neural network trainings were performed, where (i) the neural network had access only to MR data and (ii) then to MR and clinical and demographic data (Figure 1). Using a specialized visualization technique for the neural networks (occlusion) the regions most important for the network were recorded and correlated to the respective anatomical regions by an experienced rheumatologist [2,3].
Results: The dataset consisted of MRI scans from 502 patients (135 RA-, 190 RA+, 177 PsA) (Table 1). Differentiation between disease entities as measured by the AUROC was 75% (SD 3%) for RA+ vs PsA, 74% (SD 8%) for RA- vs PsA, and 67% (6%) for RA+ vs RA-. All MR sequences were important for neural network performance, but without contrast-enhanced sequences, the difference in performance was marginal. Adding demographic and clinical parameters to MR dada did not improve the performance of the neural network significantly. Interestingly, the regions important for the network were regions, which also had clinical relevance (Figure 2).
Conclusion: Neural networks can help distinguish between different forms of inflammatory arthritis based on MRI inflammatory patterns, apparently focusing on regions of clinical relevance.
References [1] Kensho Hara, Hirokatsu Kataoka, and Yutaka Satoh 2018. Can Spatiotemporal 3D CNNs Retrace the History of 2D CNNs and ImageNet? In Proceedings of the IEEE Conference on Computer Vision and Pattern Recognition (CVPR) (pp. 6546–6555).
[2] Østergaard M, McQueen F, Wiell C, et al. The OMERACT Psoriatic Arthritis Magnetic Resonance Imaging Scoring System (PsAMRIS): Definitions of key pathologies, suggested MRI sequences, and preliminary scoring system for PsA hands. J Rheumatol 2009;36:1816–24. doi:10.3899/jrheum.090352
[3] Østergaard M, Peterfy C, Conaghan P, et al. OMERACT Rheumatoid Arthritis Magnetic Resonance Imaging Studies. Core set of MRI acquisitions, joint pathology definitions, and the OMERACT RA-MRI scoring system. J Rheumatol 2003;30:1385–6.
 Table 1: Overview of demographic and clinical information
 Figure 1: Neural network combining all MR sequences along with the optional additional clinical and demographical data. The prediction for a single case is formed by averaging the prediction of all sequences and the clinical data.
 Figure 2: MR image with the overlay of the attention map generated by the neural network for a patient affected by PsA. Arrows mark regions of pathological joint changes (soft tissue inflammation and enthesitis).
Disclosures: L. Folle, None; S. Bayat, None; A. Kleyer, None; F. Fagni, None; L. Kapsner, None; M. Schlereth, None; T. Meinderink, None; K. Breininger, None; K. Tascilar, Gılead, AbbVie/Abbott, UCB, Eli Lilly; G. Kroenke, None; M. Uder, None; M. Sticherling, None; S. Bickelhaupt, None; G. Schett, None; A. Maier, None; F. Roemer, Boston Imaging Core Lab (BICL) LLC., Grünenthal, Calibr; D. Simon, None.

