Back
Poster Session A
Systemic lupus erythematosus (SLE)
Session: (0317–0342) SLE – Diagnosis, Manifestations, and Outcomes Poster I: Diagnosis
0324: Comparison of NCounter® and BioFire® Technologies for the Measurement of Type I Interferon Signature
Saturday, November 12, 2022
1:00 PM – 3:00 PM Eastern Time
Location: Virtual Poster Hall
- GS
Geoffrey Stephens, PhD
Exagen, Inc.
Vista, CA, United States
Abstract Poster Presenter(s)
Lena Kolb1, Marine Mommert2, Karen Brengel-Pesce2, Roberta Alexander1, Vasileios Kyttaris3, Anja Kammesheidt4 and Geoffrey Stephens1, 1Exagen, Inc., Vista, CA, 2bioMérieux, Lyon, France, 3Beth Israel Deaconess Medical Center, Boston, MA, 4self, Laguna Beach, CA
Background/Purpose: It is known that the expression of type I Interferon (IFN) genes is upregulated in systemic lupus erythematosus (SLE). In this study, we determined an IFN gene signature by calculating a score from the expression of four IFN stimulated genes (IFI27, IFI44L, IFIT1, RSAD2). We evaluated the stability of the IFN4 signature over time in cohorts of SLE patients versus healthy donors and in patients with rheumatoid arthritis (RA) or fibromyalgia (FMS).
Methods: Results were obtained with a prototype assay* on the BioFire® system using PAXgene blood RNA tubes without undergoing RNA isolation. After RNA isolation from the same tubes, the IFN gene signature was measured through amplification-free digital detection using the nCounter® technology (NanoString, Seattle, WA). Normalized expression values were calculated as follows. For the BioFire system, the expression of each gene was calculated by 2^-ΔCT, the geometric mean of 3 endogenous controls was used for normalization (Mommert et al., 2021; Pescarmona et al., 2019). For the nCounter technology, the count number of the four IFN genes was normalized by the geometric mean of the count number of 16 endogenous controls, as well as the positive and negative controls with the nSolver software (Pescarmona et al., 2019). With both techniques, the relative gene expression of each interferon response gene was calculated by dividing it by the median normalized expression of the respective IFN response gene from normal healthy donors. The IFN4 score is determined by the median of the relative gene expression of the four IFN stimulated genes.
*No regulatory review has been conducted; not an IVD test
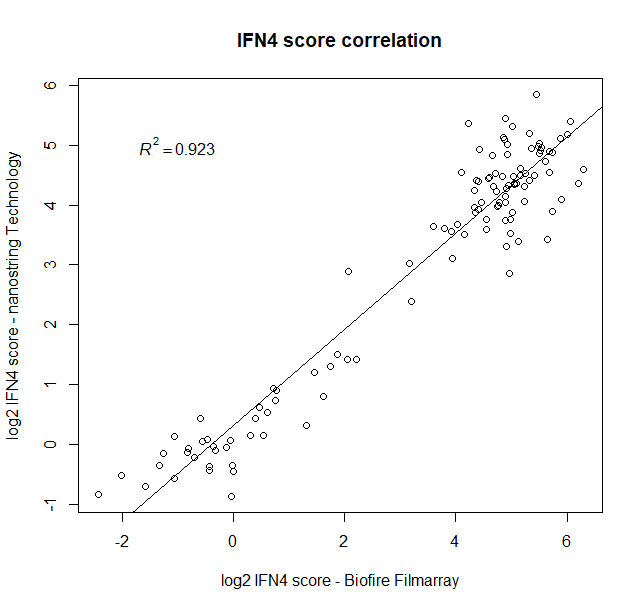
Results: Overall, a strong correlation between both platforms was observed when measuring expression of the four IFN signature genes in two consecutive visits in 47 established SLE patients (male [M]=4, female [F]=43), and 20 normal healthy donors (M=9, F=11) (Fig1).
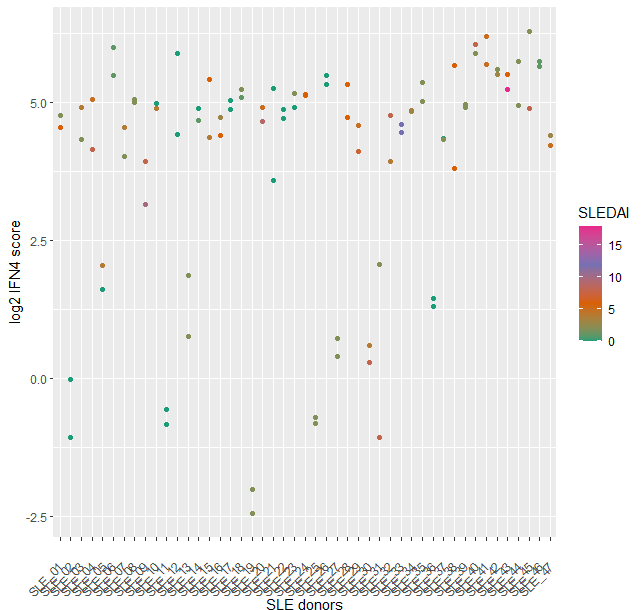
The IFN4 gene signature proved to be relatively stable in SLE over multiple visits and did not systematically track with disease severity (Fig2) or with disease subtypes. Analysis of 14 subjects with RA and 14 with FMS (all female 21% ANA+ in both groups) with the prototype assay on the BioFire system suggested that subjects with either disease exhibit a significantly lower IFN4 gene signature compared to SLE patients (Fig3).
Conclusion: In conclusion, we evaluated the IFN4 gene signature in SLE, RA and FMS by measuring the expression of four IFN stimulated genes (IFI27, IFI44L, IFIT1, RSAD2) with two different technologies. We demonstrate that the IFN4 signature in subjects with SLE is significantly elevated compared to subjects with RA or FMS. Furthermore, the IFN4 gene signature does not correlate with disease activity in SLE. Since the data between the two platforms correlate well with each other, both technologies could be effectively leveraged for small gene signatures analysis.
 Fig1: Correlation of the IFN4 gene signature using nCounter technology versus a prototype assay on the BioFire system (R^2= 0.923). The IFN4 score was determined following data analysis as the median of the relative expression of IFI27, RSAD2, IFI44L and IFIT1 compared to normal healthy volunteers. 114 samples were analyzed on both platforms, of which 94 derive from two consecutive visits of 47 established SLE patients (M=4, F=43) and 20 from a single visit of normal healthy donors (M=9, F=11).
 Fig 2. Stability of IFN4 score in SLE patients. The IFN4 score of 47 established SLE patients (M=4, F=43) was determined as the median of the relative expression of IFI27, RSAD2, IFI44L and IFIT1 compared to normal healthy volunteers. We analyzed two consecutive visits per SLE patient (x-axis) on the BioFire system, each dot represents one visit, and the coloring represents the SLEDAI score.
.jpeg) Fig 3. IFN4 score in different diseases. The IFN4 gene signature in subjects with fibromyalgia (FMS) (M=0, F=14), normal healthy volunteers (NHV) (M=9, F=11), RA (M=0, F=14) and SLE (2 consecutive visits, M=4, F=43) was analyzed with a prototype assay on the BioFire system. **** Indicates p < 0.0001
Fig 3. IFN4 score in different diseases. The IFN4 gene signature in subjects with fibromyalgia (FMS) (M=0, F=14), normal healthy volunteers (NHV) (M=9, F=11), RA (M=0, F=14) and SLE (2 consecutive visits, M=4, F=43) was analyzed with a prototype assay on the BioFire system. **** Indicates p < 0.0001
Disclosures: L. Kolb, Exagen; M. Mommert, bioMerieux; K. Brengel-Pesce, bioMerieux; R. Alexander, Exagen Inc.; V. Kyttaris, Exagen, Corbus Pharmaceuticals, Aurinia Pharmaceuticals, Scipher; A. Kammesheidt, Exagen Inc.; G. Stephens, Exagen Inc.
Background/Purpose: It is known that the expression of type I Interferon (IFN) genes is upregulated in systemic lupus erythematosus (SLE). In this study, we determined an IFN gene signature by calculating a score from the expression of four IFN stimulated genes (IFI27, IFI44L, IFIT1, RSAD2). We evaluated the stability of the IFN4 signature over time in cohorts of SLE patients versus healthy donors and in patients with rheumatoid arthritis (RA) or fibromyalgia (FMS).
Methods: Results were obtained with a prototype assay* on the BioFire® system using PAXgene blood RNA tubes without undergoing RNA isolation. After RNA isolation from the same tubes, the IFN gene signature was measured through amplification-free digital detection using the nCounter® technology (NanoString, Seattle, WA). Normalized expression values were calculated as follows. For the BioFire system, the expression of each gene was calculated by 2^-ΔCT, the geometric mean of 3 endogenous controls was used for normalization (Mommert et al., 2021; Pescarmona et al., 2019). For the nCounter technology, the count number of the four IFN genes was normalized by the geometric mean of the count number of 16 endogenous controls, as well as the positive and negative controls with the nSolver software (Pescarmona et al., 2019). With both techniques, the relative gene expression of each interferon response gene was calculated by dividing it by the median normalized expression of the respective IFN response gene from normal healthy donors. The IFN4 score is determined by the median of the relative gene expression of the four IFN stimulated genes.
*No regulatory review has been conducted; not an IVD test
Results: Overall, a strong correlation between both platforms was observed when measuring expression of the four IFN signature genes in two consecutive visits in 47 established SLE patients (male [M]=4, female [F]=43), and 20 normal healthy donors (M=9, F=11) (Fig1).
The IFN4 gene signature proved to be relatively stable in SLE over multiple visits and did not systematically track with disease severity (Fig2) or with disease subtypes. Analysis of 14 subjects with RA and 14 with FMS (all female 21% ANA+ in both groups) with the prototype assay on the BioFire system suggested that subjects with either disease exhibit a significantly lower IFN4 gene signature compared to SLE patients (Fig3).
Conclusion: In conclusion, we evaluated the IFN4 gene signature in SLE, RA and FMS by measuring the expression of four IFN stimulated genes (IFI27, IFI44L, IFIT1, RSAD2) with two different technologies. We demonstrate that the IFN4 signature in subjects with SLE is significantly elevated compared to subjects with RA or FMS. Furthermore, the IFN4 gene signature does not correlate with disease activity in SLE. Since the data between the two platforms correlate well with each other, both technologies could be effectively leveraged for small gene signatures analysis.
 Fig1: Correlation of the IFN4 gene signature using nCounter technology versus a prototype assay on the BioFire system (R^2= 0.923). The IFN4 score was determined following data analysis as the median of the relative expression of IFI27, RSAD2, IFI44L and IFIT1 compared to normal healthy volunteers. 114 samples were analyzed on both platforms, of which 94 derive from two consecutive visits of 47 established SLE patients (M=4, F=43) and 20 from a single visit of normal healthy donors (M=9, F=11).
 Fig 2. Stability of IFN4 score in SLE patients. The IFN4 score of 47 established SLE patients (M=4, F=43) was determined as the median of the relative expression of IFI27, RSAD2, IFI44L and IFIT1 compared to normal healthy volunteers. We analyzed two consecutive visits per SLE patient (x-axis) on the BioFire system, each dot represents one visit, and the coloring represents the SLEDAI score.
 .jpeg) Fig 3. IFN4 score in different diseases. The IFN4 gene signature in subjects with fibromyalgia (FMS) (M=0, F=14), normal healthy volunteers (NHV) (M=9, F=11), RA (M=0, F=14) and SLE (2 consecutive visits, M=4, F=43) was analyzed with a prototype assay on the BioFire system. **** Indicates p < 0.0001
Fig 3. IFN4 score in different diseases. The IFN4 gene signature in subjects with fibromyalgia (FMS) (M=0, F=14), normal healthy volunteers (NHV) (M=9, F=11), RA (M=0, F=14) and SLE (2 consecutive visits, M=4, F=43) was analyzed with a prototype assay on the BioFire system. **** Indicates p < 0.0001Disclosures: L. Kolb, Exagen; M. Mommert, bioMerieux; K. Brengel-Pesce, bioMerieux; R. Alexander, Exagen Inc.; V. Kyttaris, Exagen, Corbus Pharmaceuticals, Aurinia Pharmaceuticals, Scipher; A. Kammesheidt, Exagen Inc.; G. Stephens, Exagen Inc.

