Back
Poster Session C
Spondyloarthritis (SpA) including psoriatic arthritis (PsA)
Session: (1486–1517) Spondyloarthritis Including PsA – Diagnosis, Manifestations, and Outcomes Poster III
1513: Identification of MRI Lesions Indicative of Spondyloarthritis Diagnosis from the Axial Spondyloarthritis International Society (ASAS) MRImagine Multi-Reader Scoring Dataset Using the Chi-Squared Automatic Interaction Detection Algorithm (CHAID)
Sunday, November 13, 2022
1:00 PM – 3:00 PM Eastern Time
Location: Virtual Poster Hall
- SW
Stephanie Wichuk, BA
University of Alberta
Edmonton, AB, Canada
Abstract Poster Presenter(s)
Stephanie Wichuk1, Walter P Maksymowych2, Robert G Lambert1, Abhilash Hareendranathan3 and Jacob Jaremko1, 1University of Alberta, Edmonton, AB, Canada, 2Department of Medicine, University of Alberta, Edmonton, AB, Canada, 3Department of Radiology and Diagnostic Imaging, University of Alberta, Edmonton, AB, Canada
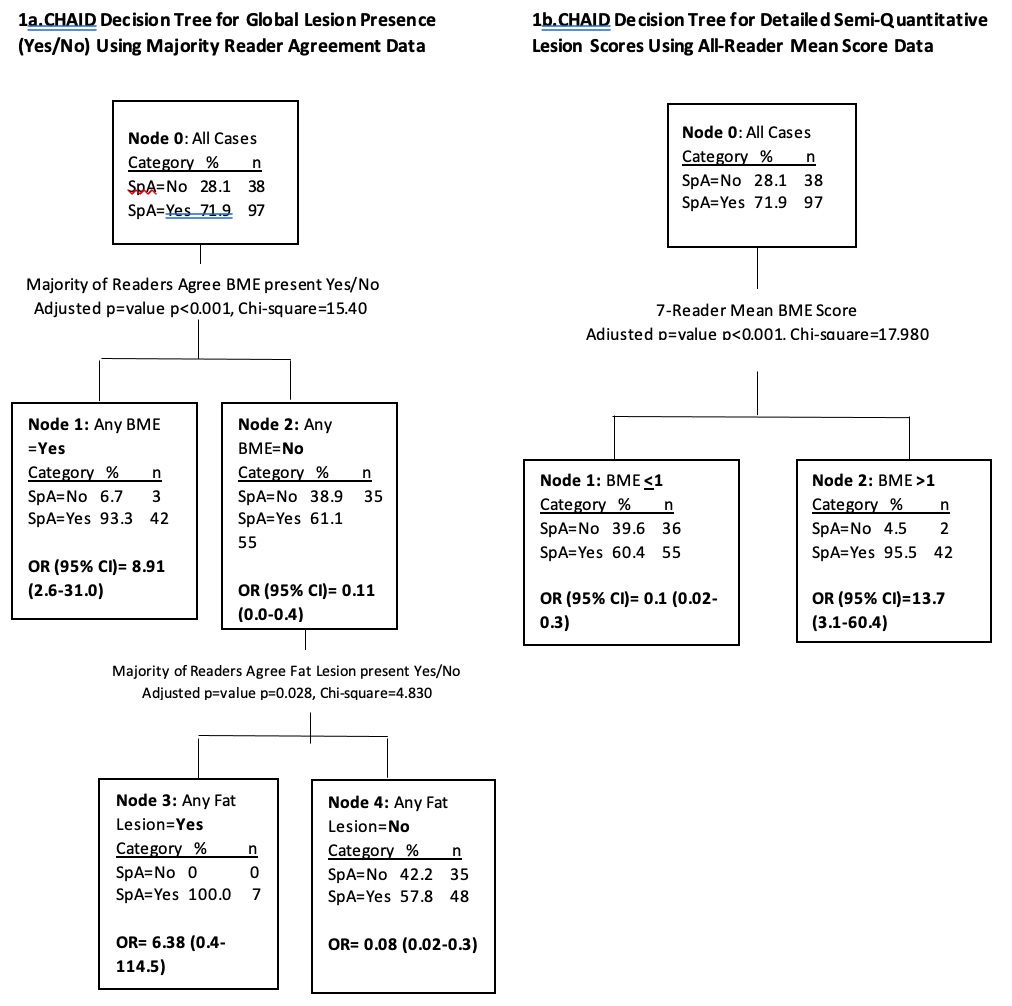
Background/Purpose: Several types of active and structural lesions have been identified on sacroiliac joint MRI of spondyloarthritis (SpA) patients. Various combinations of these lesions may be present on a single scan, and some lesions may occur in cases of non-inflammatory back pain. The CHAID algorithm can quickly evaluate multiple lesion variables to identify the most significant variables and combinations thereof for diagnostic prediction. The CHAID technique does not require the data to be normally distributed. The result is a visual flowchart ("decision tree") outlining the lesion score values that most strongly point to a particular diagnosis (Figure 1). CHAID circumvents the need to manually build an unwieldy exploratory regression model with all imaginable variable interaction terms, and, in contrast to more advanced "black box" machine learning techniques, produces transparent results that are intuitive and translatable to a human observer. We applied CHAID to the ASAS MRImagine study SIJ scoring data to identify the most strongly predictive combinations of lesions for SpA diagnosis, and to evaluate whether the level of scoring granularity impacts predictor selection.
Methods: CHAID was applied to active and structural MRI lesion data from 7 readers. Separate models were created using global scores (ie. any lesion present in entire scan (y/n)), and detailed semi-quantitative lesion scores for all MRI slices. The outcome variable was SpA diagnosis by an external rheumatologist. The CHAID algorithm automatically performed chi-squared tests on each lesion variable to find the most statistically significant diagnostic predictor in the entire dataset, then sub-categorized cases based on this first predictor. The process was repeated to find the most significant predictor within each sub-category, and so on, until no further significant variables emerged. An odds ratio for diagnosis was calculated for each category in the resulting CHAID tree using MedCalc v.20.1.
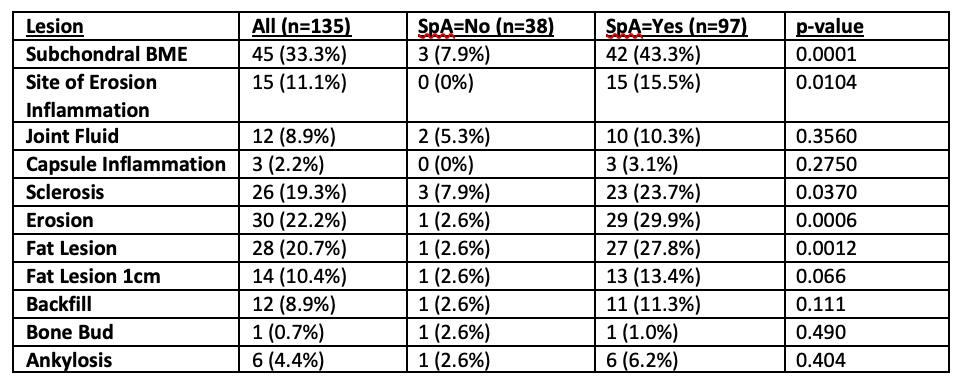
Results: Of all variables entered into the models (Tables 1 and 2), bone marrow edema (BME) was the most significant diagnostic predictor from combined reader data for both the global and detailed models (OR=8.91 for SpA+ if BME present globally, OR=13.7 if mean detailed BME score >1). In the global model (Figure 1a), fat emerged as a strong predictor of SpA when BME was not present (OR=6.38 if fat present vs. OR=0.08 if no fat present). The global score CHAID tree had high specificity for SpA diagnosis at each node [92 (95% CI: 78.6-98.3) and 100 (95% CI: 90.7-100.0) for BME and BME/Fat combinations respectively] but lacked sensitivity [7.22 (95% CI: 3.0-14.3) and 43.3 (95% CI: 33.3 - 53.7)]. The detailed score model was also highly specific for positive diagnosis [94 (95% CI: 82.3 - 99.4) if BME >1] but lacked sensitivity (43.3 (95% CI: 33.3 - 53.7)).
Conclusion: CHAID performed with high specificity but low sensitivity for SpA diagnosis in this context. Considering the low incidence of certain lesion types in this sample, a larger dataset may increase sensitivity and ensure all important lesion combinations are captured. In addition to diagnostic prediction, CHAID may be useful in identifying MRI predictors of outcomes such as radiographic progression.
 Figure 1. Chi-Squared Automatic Interaction Detection (CHAID) decision trees produced from majority reader agreement data for presence of lesion on global evaluation of MRI scan (1a) and mean of 7-central readers detailed semi-quantitative lesion score data (1b).
 Table 1. Number (%) of cases where majority of central readers agree lesion is present on global evaluation of MRI scan.
 Table 2. Mean semi-quantitative scores of 7 central readers for MRI lesions included in detailed CHAID model
Disclosures: S. Wichuk, None; W. Maksymowych, AbbVie, Boehringer-Ingelheim, Celgene, Eli Lilly, Galapagos, Janssen, Novartis, Pfizer, UCB, CARE Arthritis Limited; R. Lambert, Calyx, CARE Arthritis, Image Analysis Group; A. Hareendranathan, None; J. Jaremko, None.
Background/Purpose: Several types of active and structural lesions have been identified on sacroiliac joint MRI of spondyloarthritis (SpA) patients. Various combinations of these lesions may be present on a single scan, and some lesions may occur in cases of non-inflammatory back pain. The CHAID algorithm can quickly evaluate multiple lesion variables to identify the most significant variables and combinations thereof for diagnostic prediction. The CHAID technique does not require the data to be normally distributed. The result is a visual flowchart ("decision tree") outlining the lesion score values that most strongly point to a particular diagnosis (Figure 1). CHAID circumvents the need to manually build an unwieldy exploratory regression model with all imaginable variable interaction terms, and, in contrast to more advanced "black box" machine learning techniques, produces transparent results that are intuitive and translatable to a human observer. We applied CHAID to the ASAS MRImagine study SIJ scoring data to identify the most strongly predictive combinations of lesions for SpA diagnosis, and to evaluate whether the level of scoring granularity impacts predictor selection.
Methods: CHAID was applied to active and structural MRI lesion data from 7 readers. Separate models were created using global scores (ie. any lesion present in entire scan (y/n)), and detailed semi-quantitative lesion scores for all MRI slices. The outcome variable was SpA diagnosis by an external rheumatologist. The CHAID algorithm automatically performed chi-squared tests on each lesion variable to find the most statistically significant diagnostic predictor in the entire dataset, then sub-categorized cases based on this first predictor. The process was repeated to find the most significant predictor within each sub-category, and so on, until no further significant variables emerged. An odds ratio for diagnosis was calculated for each category in the resulting CHAID tree using MedCalc v.20.1.
Results: Of all variables entered into the models (Tables 1 and 2), bone marrow edema (BME) was the most significant diagnostic predictor from combined reader data for both the global and detailed models (OR=8.91 for SpA+ if BME present globally, OR=13.7 if mean detailed BME score >1). In the global model (Figure 1a), fat emerged as a strong predictor of SpA when BME was not present (OR=6.38 if fat present vs. OR=0.08 if no fat present). The global score CHAID tree had high specificity for SpA diagnosis at each node [92 (95% CI: 78.6-98.3) and 100 (95% CI: 90.7-100.0) for BME and BME/Fat combinations respectively] but lacked sensitivity [7.22 (95% CI: 3.0-14.3) and 43.3 (95% CI: 33.3 - 53.7)]. The detailed score model was also highly specific for positive diagnosis [94 (95% CI: 82.3 - 99.4) if BME >1] but lacked sensitivity (43.3 (95% CI: 33.3 - 53.7)).
Conclusion: CHAID performed with high specificity but low sensitivity for SpA diagnosis in this context. Considering the low incidence of certain lesion types in this sample, a larger dataset may increase sensitivity and ensure all important lesion combinations are captured. In addition to diagnostic prediction, CHAID may be useful in identifying MRI predictors of outcomes such as radiographic progression.
 Figure 1. Chi-Squared Automatic Interaction Detection (CHAID) decision trees produced from majority reader agreement data for presence of lesion on global evaluation of MRI scan (1a) and mean of 7-central readers detailed semi-quantitative lesion score data (1b).
 Table 1. Number (%) of cases where majority of central readers agree lesion is present on global evaluation of MRI scan.
 Table 2. Mean semi-quantitative scores of 7 central readers for MRI lesions included in detailed CHAID model
Disclosures: S. Wichuk, None; W. Maksymowych, AbbVie, Boehringer-Ingelheim, Celgene, Eli Lilly, Galapagos, Janssen, Novartis, Pfizer, UCB, CARE Arthritis Limited; R. Lambert, Calyx, CARE Arthritis, Image Analysis Group; A. Hareendranathan, None; J. Jaremko, None.

