Back
Poster Session C
Vasculitis
Session: (1543–1578) Vasculitis – Non-ANCA-Associated and Related Disorders Poster II
1551: The Utility of Imaging Studies (MRA and CTA) in Long-Term Monitoring for Patients with Takayasu Arteritis
Sunday, November 13, 2022
1:00 PM – 3:00 PM Eastern Time
Location: Virtual Poster Hall
- AV
Alexandra Villa-Forte, MD, MPH, FACP
Cleveland Clinic
Cleveland, OH, United States
Abstract Poster Presenter(s)
Saja Almaaitah1, Chao Zhang2 and alexandra villa forte1, 1Cleveland Clinic Foundation, Cleveland, OH, 2Cleveland Clinic, Cleveland, OH
Background/Purpose: Takayasu Arteritis (TA) is a complex large vessel vasculitis that leads to arterial stenosis, occlusion and aneurysmal formation. Assessment of disease activity is a major challenge. In addition to clinical assessment, laboratory and imaging tests are routinely used in the follow up of patients with TA. Serial MRA and CTA have been performed at various intervals, most commonly every 6 to 12 months. However, the best imaging interval is unknown and currently decided on an individual basis. Risk of CTA radiation and the cumulative MRA gadolinium contrast in the brain can be major concerns over many years of disease. The aim of this study is to evaluate correlation between imaging findings, clinical outcome, and change in therapy in TA.
Methods: Retrospective chart review of all patients with TA seen at the Vasculitis Clinic at the Cleveland Clinic between 2002 and December 2020, and who had at least 3 follow up office visits with either CTA or MRA imaging obtained on each visit. Data collection included demographics, disease manifestations, laboratory and imaging results, treatment and disease complications. Bayesian generalized mixed effect model was performed to assess the relationship between clinical variables and outcome.
Results: 94 patients met the inclusion criteria. Median age at diagnosis was 35 years. 89.4% were females. Median follow up duration was 7.6 years (IQR, 4.6; 11.5) and median interval follow up between visits was 8.3 months (IQR, 5.5; 13.8). Patients had a total number of 785 follow up visits, during which 681 MRA and 104 CTA images were obtained. Active imaging was defined as: new stenosis, occlusion, aneurysms or dissection or progressive prior lesions. Stable imaging was defined as: no new or progressive lesions or improvement in the prior abnormal lesions. Out of 785 imaging performed, 133 (17%) were defined as active and 652 (83%) were stable. Out of 133 visits with active imaging, TA was active on 53% and was stable on 47% as deemed by the treating physician. Out of 652 visits with stable imaging, TA was active on 14% and stable on 86%. Therapy was increased in 19.4% of all visits. 50% of patients who presented with new or worsening symptoms were deemed to have active disease, versus patients who presented with abnormal labs (13%) or active imaging (38.9%).
Conclusion: In our TA population, a minority of the routine images showed new or progressive lesions. Less than half of these were associated with active disease in the absence of new/worsening symptoms and abnormal labs. Therapy was increased in a small number of follow up visits, and was as likely to occur based on clinical symptoms as compared to imaging results.
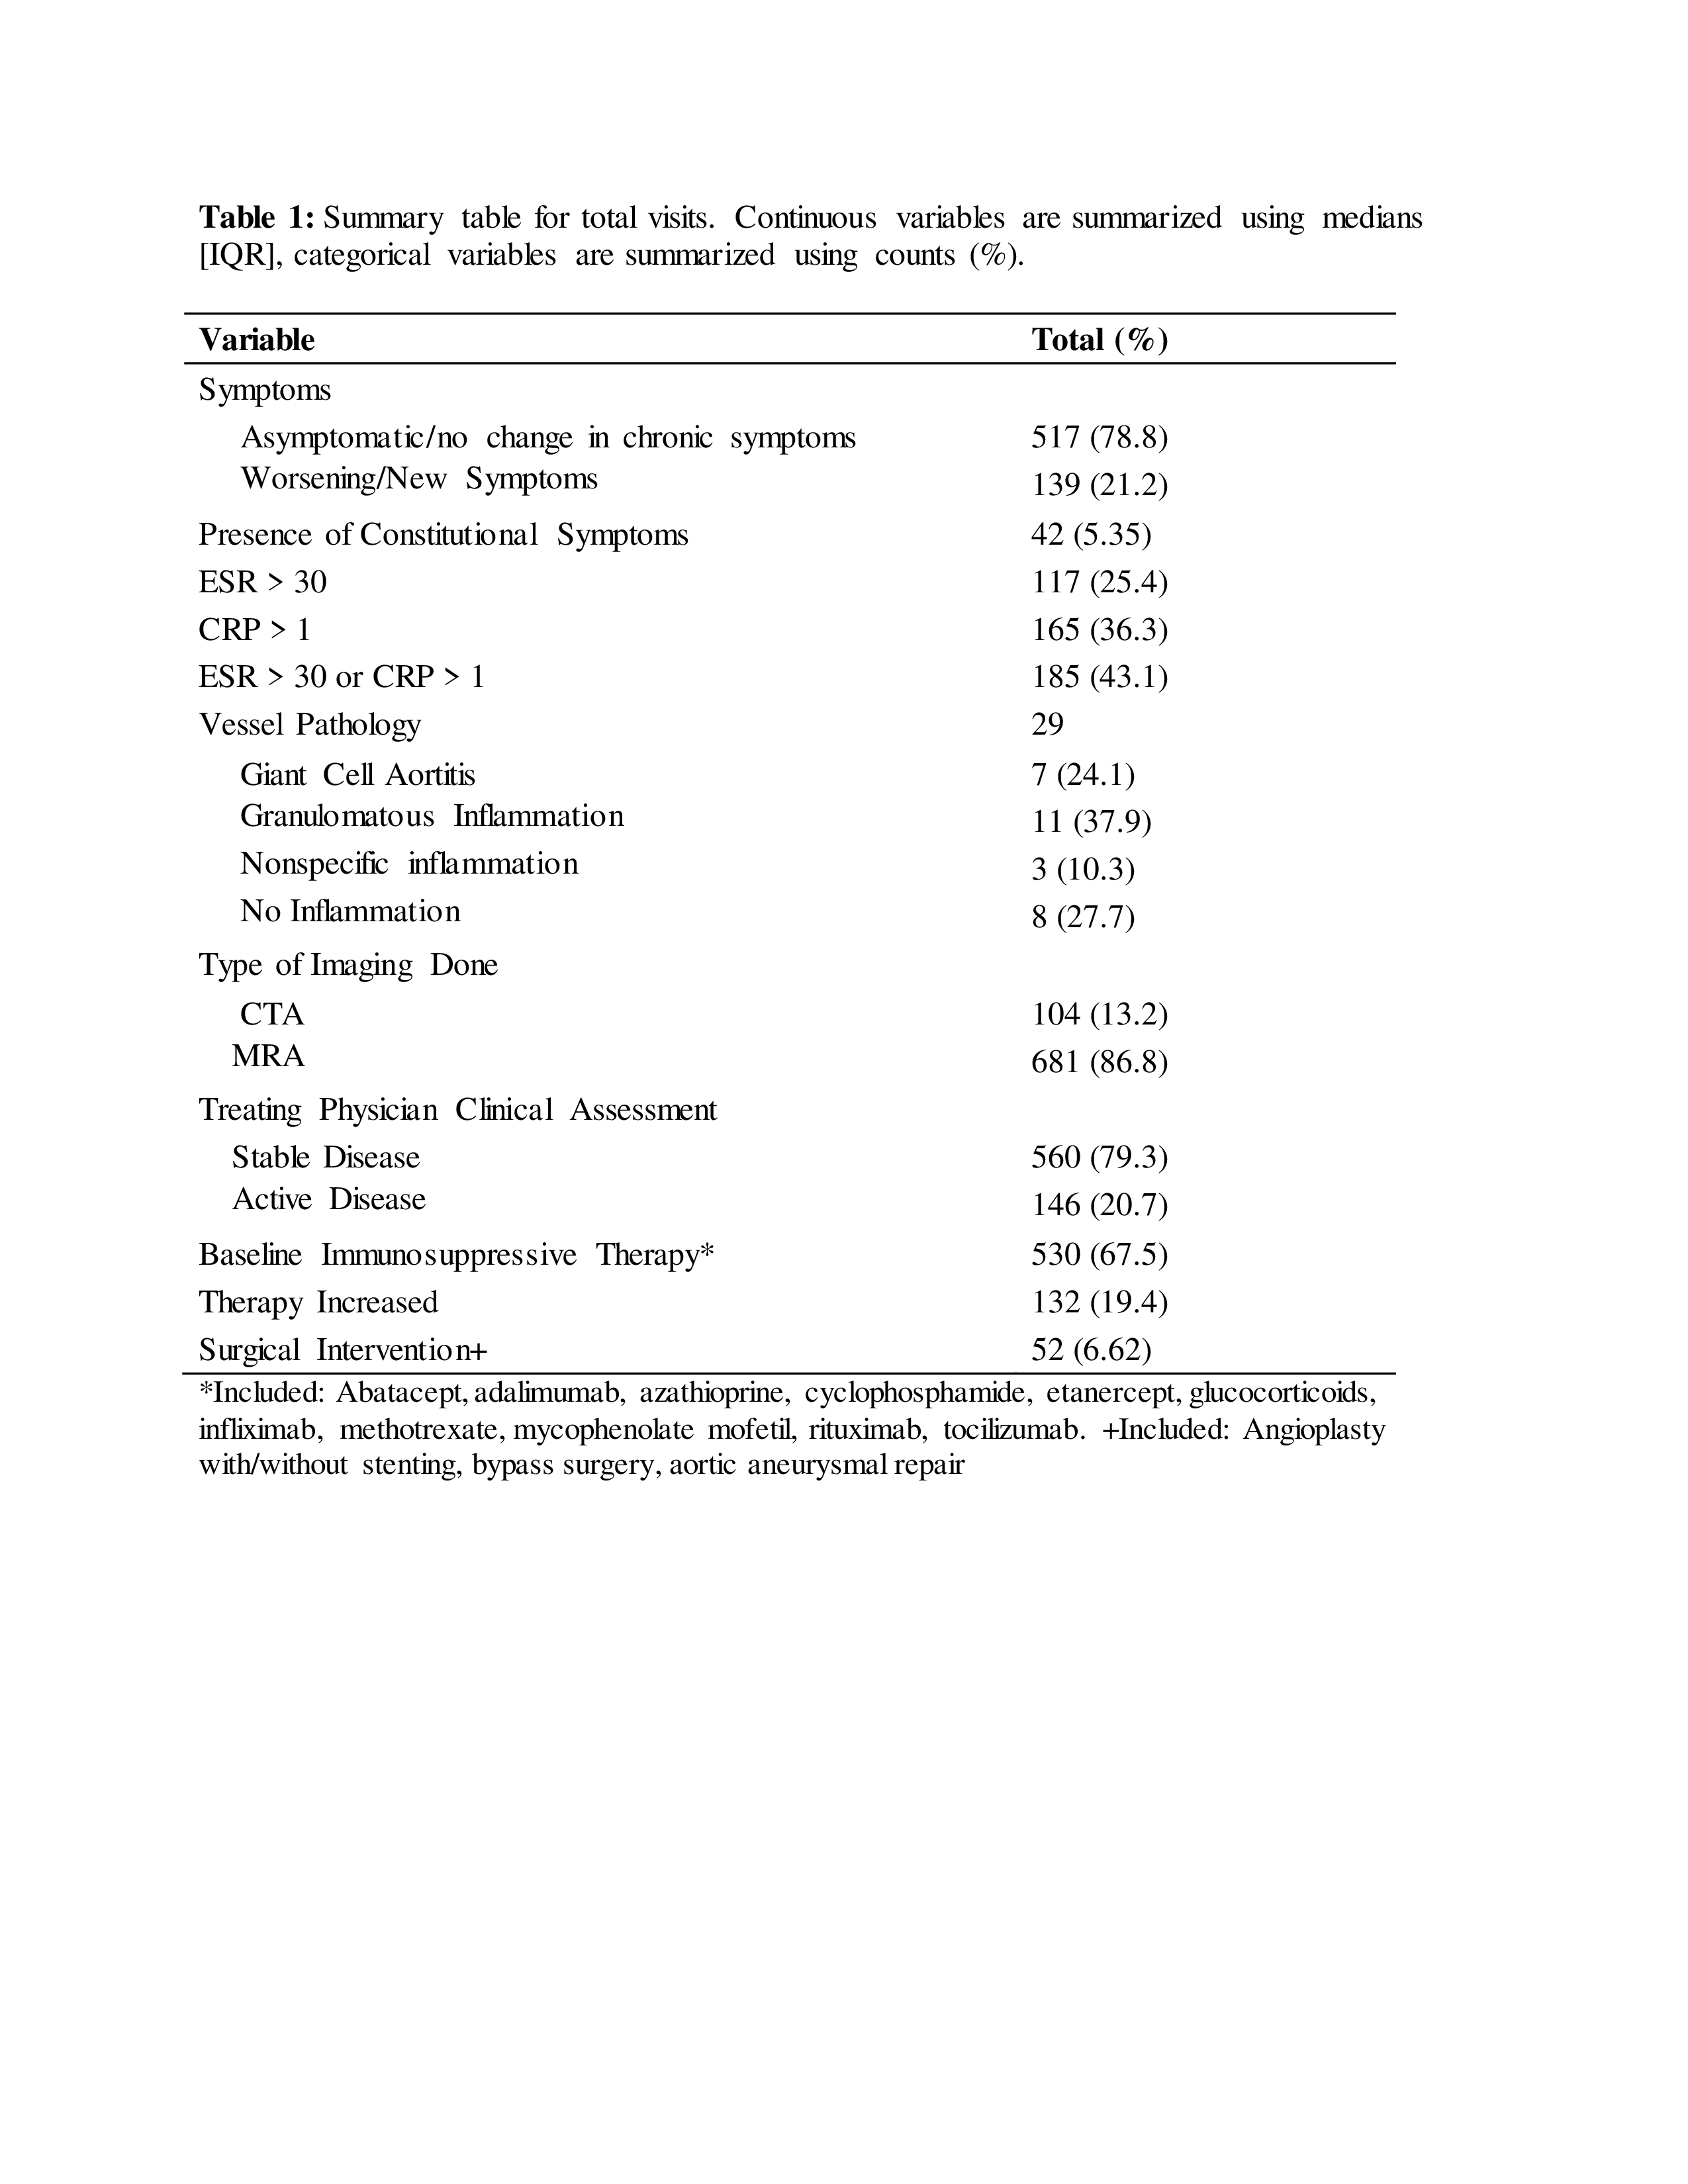
 Table 1: Summary table for total visits. Continuous variables are summarized using medians [IQR], categorical variables are summarized using counts (%). *Included: Abatacept, adalimumab, azathioprine, cyclophosphamide, etanercept, glucocorticoids, infliximab, methotrexate, mycophenolate mofetil, rituximab, tocilizumab. +Included: Angioplasty with/without stenting, bypass surgery, aortic aneurysmal repair
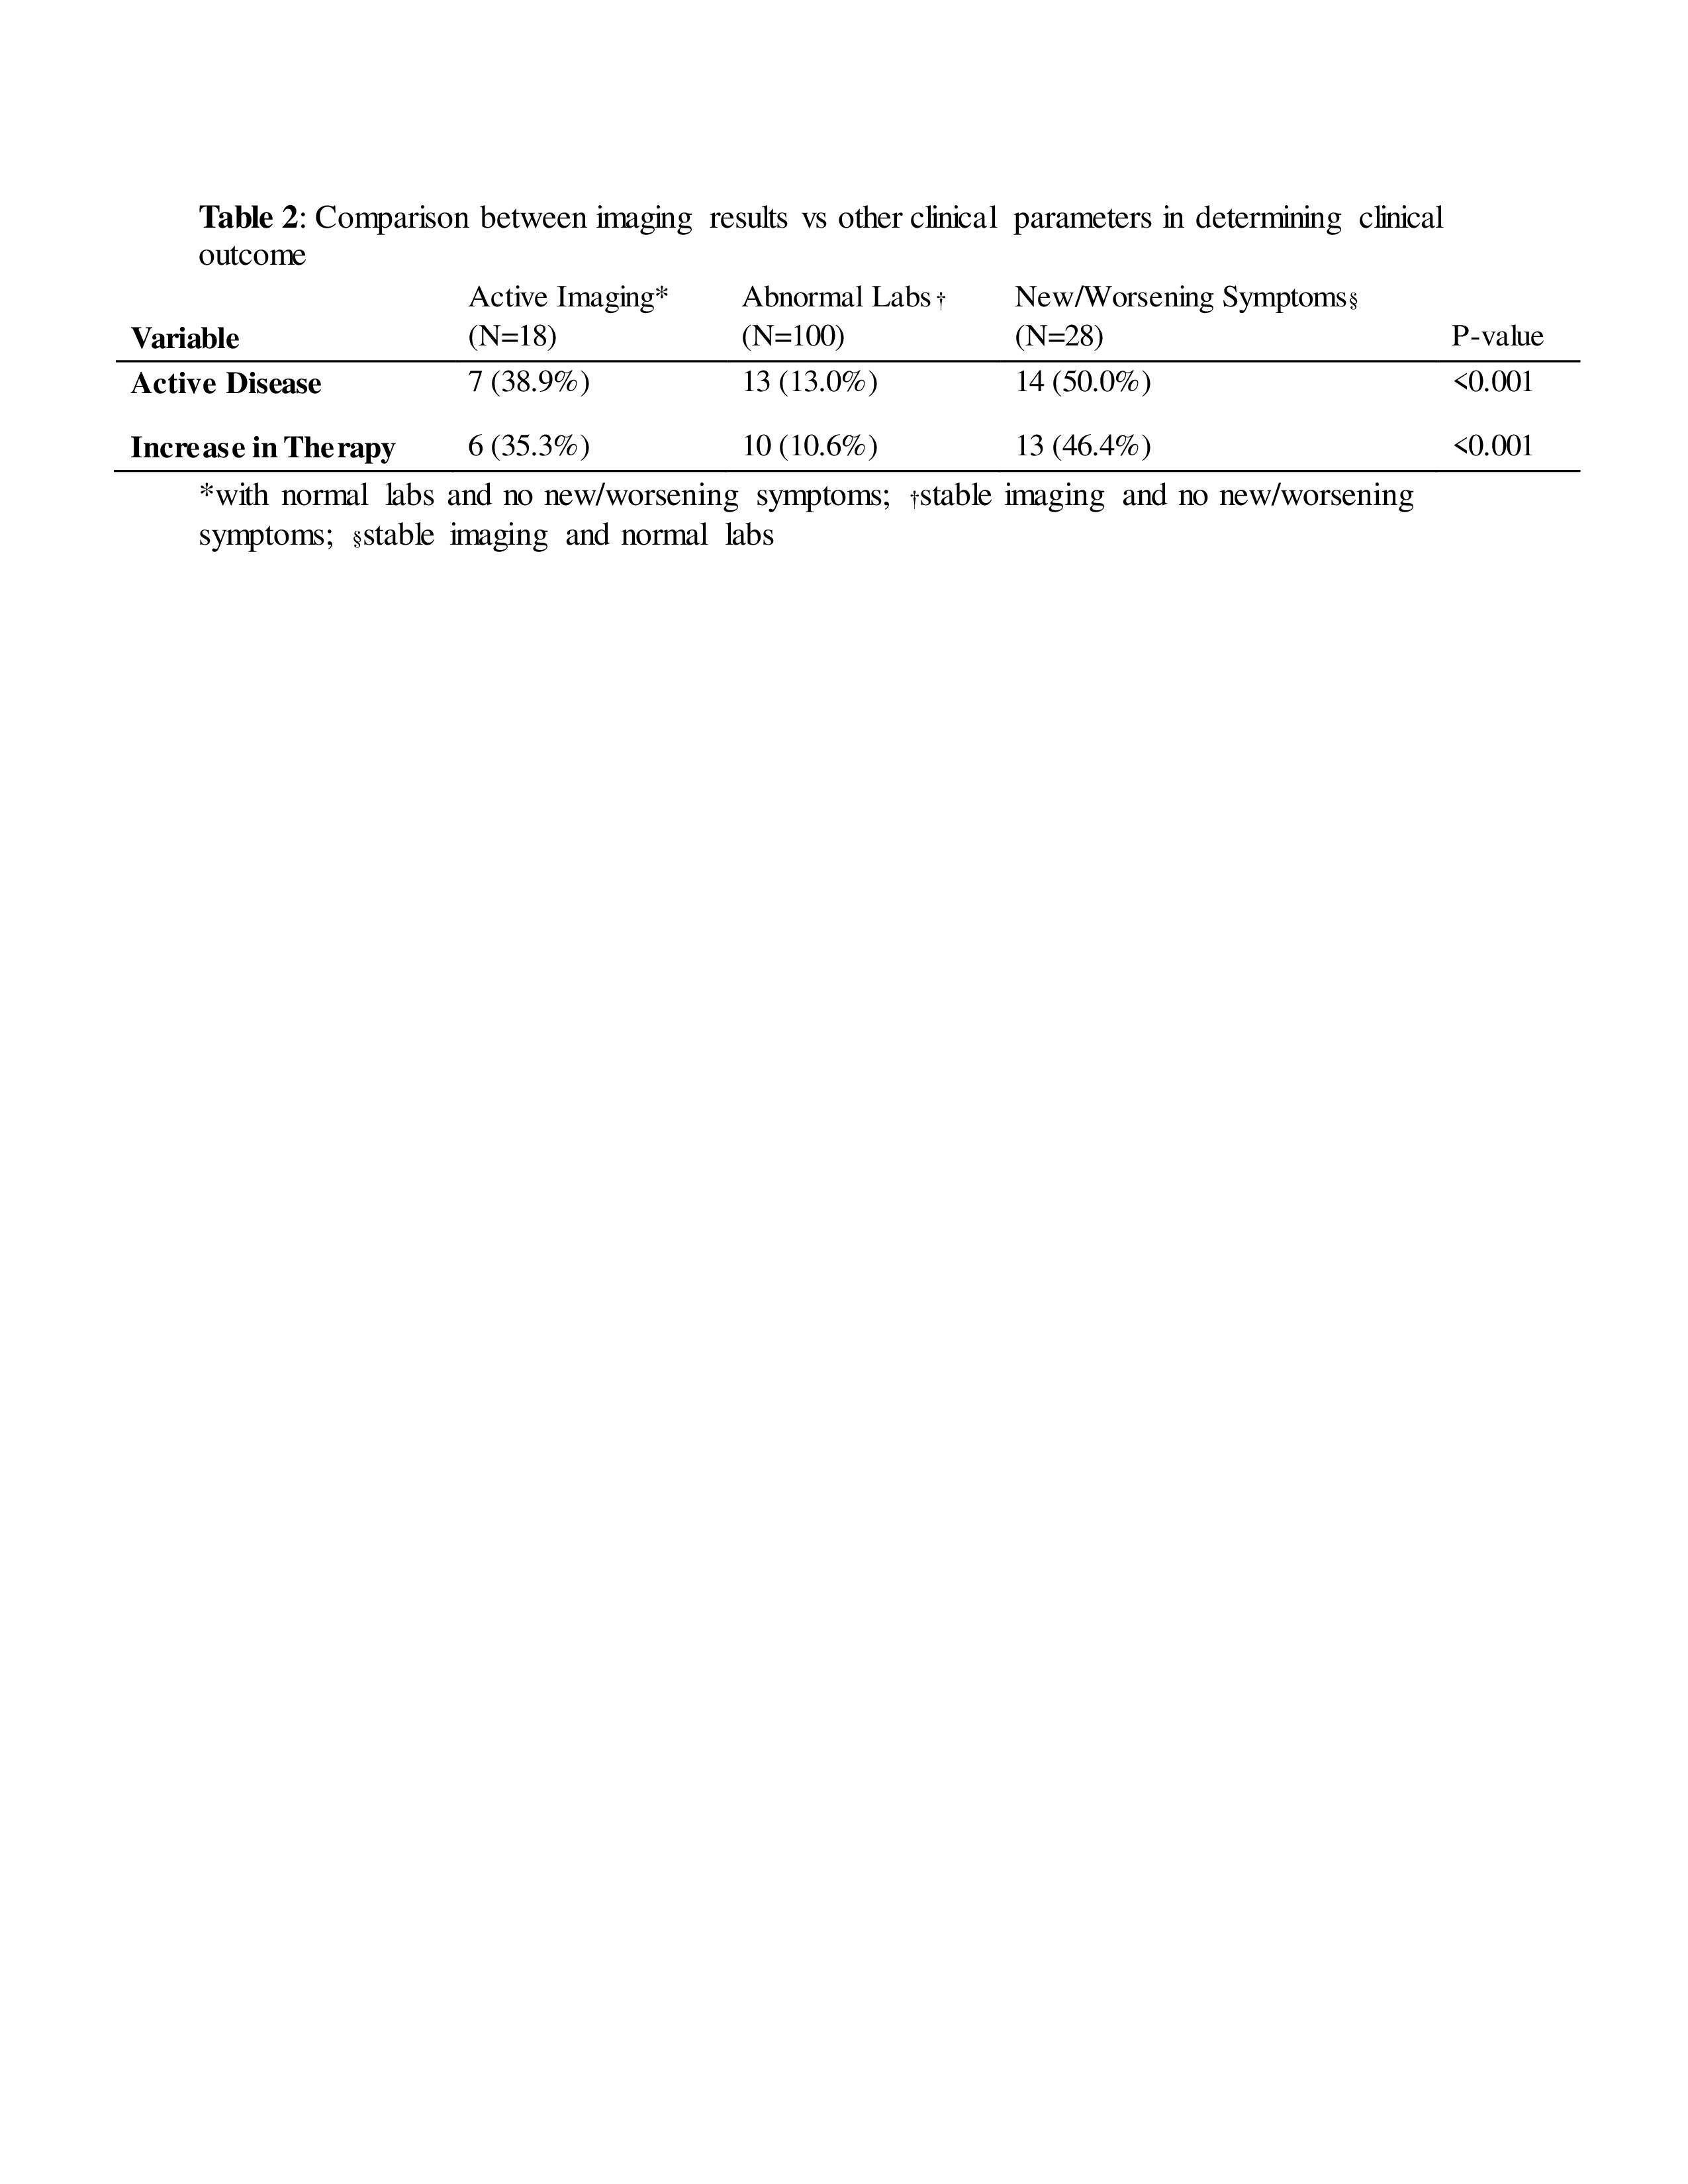
 Table 2: Comparison between imaging results vs other clinical parameters in determining clinical outcome. *with normal labs and no new/worsening symptoms; †stable imaging and no new/worsening symptoms; §stable imaging and normal labs
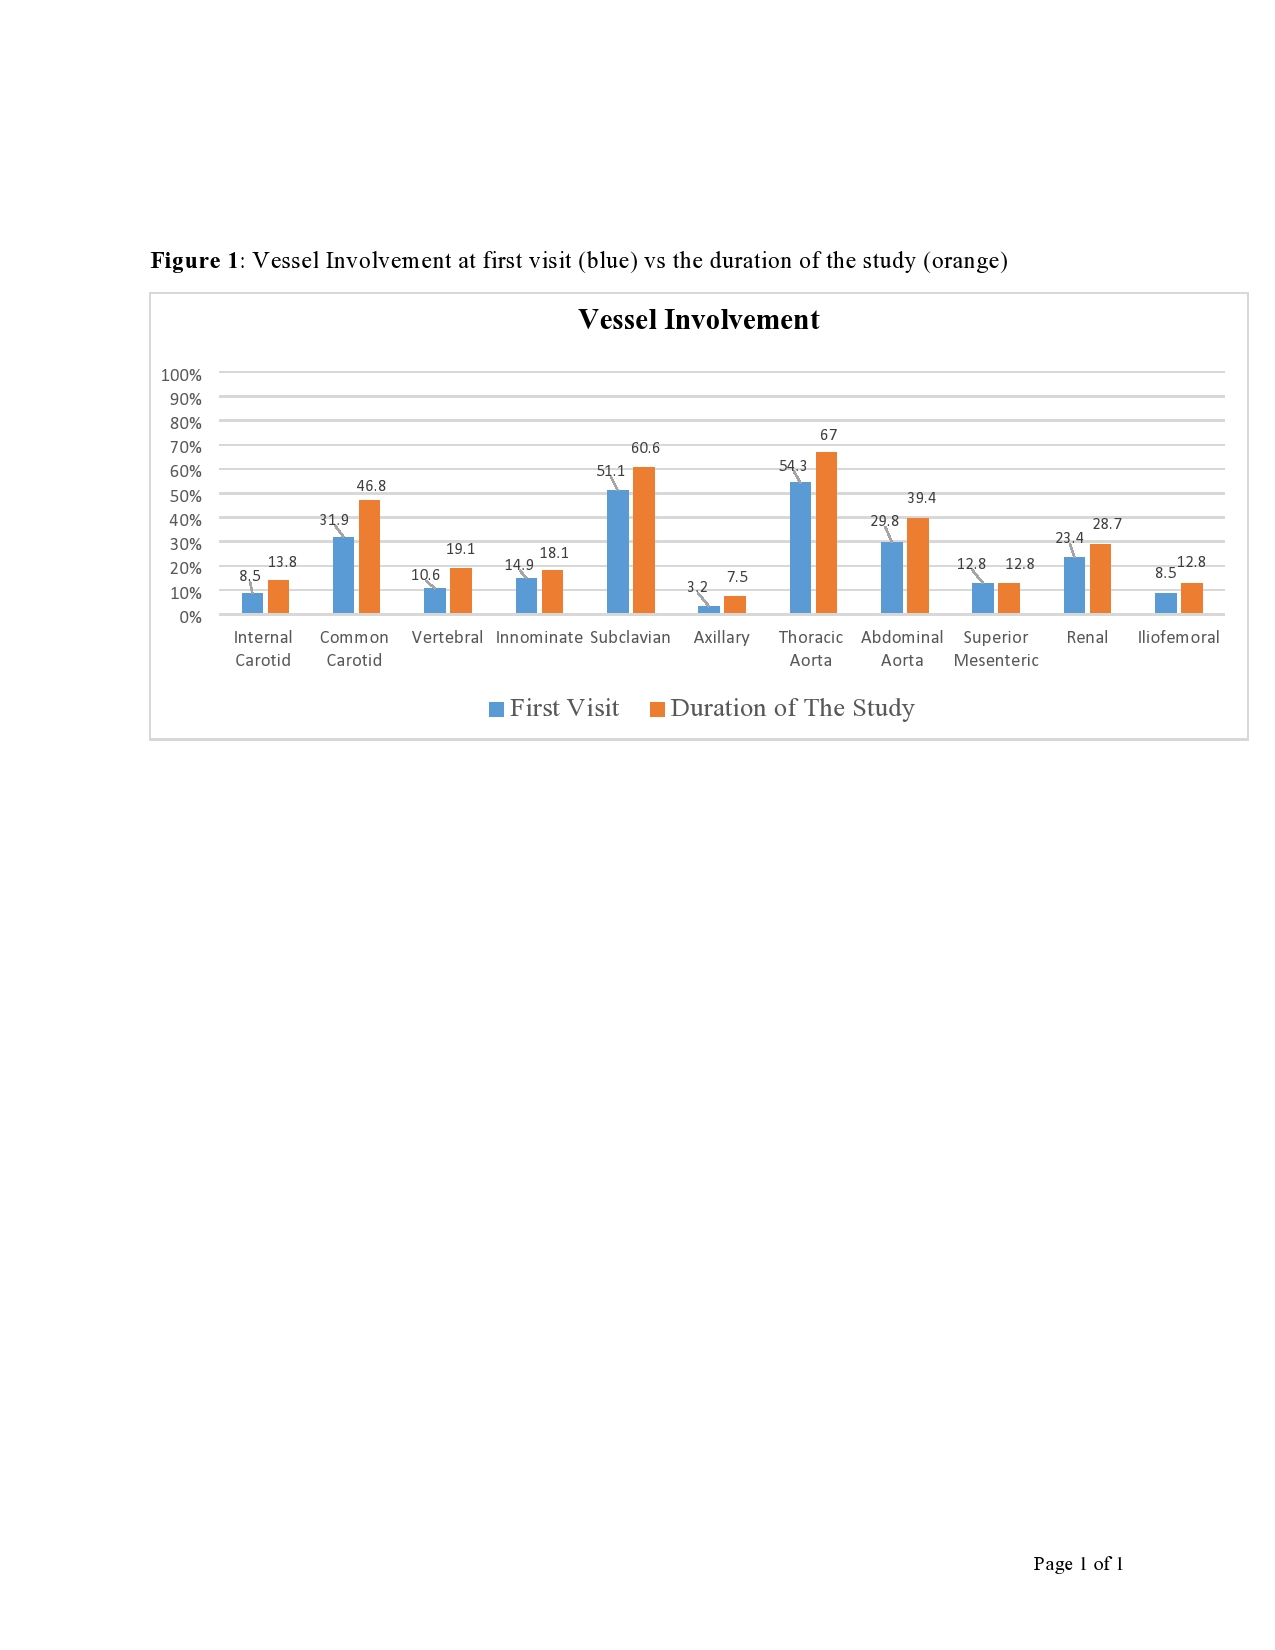
 Figure 1: Vessel Involvement at first visit (blue) vs the duration of the study (orange)
Disclosures: S. Almaaitah, None; C. Zhang, None; a. villa forte, None.
Background/Purpose: Takayasu Arteritis (TA) is a complex large vessel vasculitis that leads to arterial stenosis, occlusion and aneurysmal formation. Assessment of disease activity is a major challenge. In addition to clinical assessment, laboratory and imaging tests are routinely used in the follow up of patients with TA. Serial MRA and CTA have been performed at various intervals, most commonly every 6 to 12 months. However, the best imaging interval is unknown and currently decided on an individual basis. Risk of CTA radiation and the cumulative MRA gadolinium contrast in the brain can be major concerns over many years of disease. The aim of this study is to evaluate correlation between imaging findings, clinical outcome, and change in therapy in TA.
Methods: Retrospective chart review of all patients with TA seen at the Vasculitis Clinic at the Cleveland Clinic between 2002 and December 2020, and who had at least 3 follow up office visits with either CTA or MRA imaging obtained on each visit. Data collection included demographics, disease manifestations, laboratory and imaging results, treatment and disease complications. Bayesian generalized mixed effect model was performed to assess the relationship between clinical variables and outcome.
Results: 94 patients met the inclusion criteria. Median age at diagnosis was 35 years. 89.4% were females. Median follow up duration was 7.6 years (IQR, 4.6; 11.5) and median interval follow up between visits was 8.3 months (IQR, 5.5; 13.8). Patients had a total number of 785 follow up visits, during which 681 MRA and 104 CTA images were obtained. Active imaging was defined as: new stenosis, occlusion, aneurysms or dissection or progressive prior lesions. Stable imaging was defined as: no new or progressive lesions or improvement in the prior abnormal lesions. Out of 785 imaging performed, 133 (17%) were defined as active and 652 (83%) were stable. Out of 133 visits with active imaging, TA was active on 53% and was stable on 47% as deemed by the treating physician. Out of 652 visits with stable imaging, TA was active on 14% and stable on 86%. Therapy was increased in 19.4% of all visits. 50% of patients who presented with new or worsening symptoms were deemed to have active disease, versus patients who presented with abnormal labs (13%) or active imaging (38.9%).
Conclusion: In our TA population, a minority of the routine images showed new or progressive lesions. Less than half of these were associated with active disease in the absence of new/worsening symptoms and abnormal labs. Therapy was increased in a small number of follow up visits, and was as likely to occur based on clinical symptoms as compared to imaging results.
 Table 1: Summary table for total visits. Continuous variables are summarized using medians [IQR], categorical variables are summarized using counts (%). *Included: Abatacept, adalimumab, azathioprine, cyclophosphamide, etanercept, glucocorticoids, infliximab, methotrexate, mycophenolate mofetil, rituximab, tocilizumab. +Included: Angioplasty with/without stenting, bypass surgery, aortic aneurysmal repair
 Table 2: Comparison between imaging results vs other clinical parameters in determining clinical outcome. *with normal labs and no new/worsening symptoms; †stable imaging and no new/worsening symptoms; §stable imaging and normal labs
 Figure 1: Vessel Involvement at first visit (blue) vs the duration of the study (orange)
Disclosures: S. Almaaitah, None; C. Zhang, None; a. villa forte, None.

