Back
Poster Session A
Vasculitis
Session: (0458–0497) Vasculitis – Non-ANCA-Associated and Related Disorders Poster I: Giant Cell Arteritis
0484: Epidemiology and Predictors of Relapse in Giant Cell Arteritis: A Systematic Review and Meta-analysis
Saturday, November 12, 2022
1:00 PM – 3:00 PM Eastern Time
Location: Virtual Poster Hall
- LM
Lien Moreel, MD
UZ Leuven
Leuven, Belgium
Abstract Poster Presenter(s)
Lien Moreel1, Albrecht Betrains1, Geert Molenberghs2, Steven Vanderschueren1 and Daniel Blockmans1, 1University Hospitals Leuven, KU Leuven, Leuven, Belgium, 2KU Leuven, Leuven, Belgium
Background/Purpose: The aim of this study was to estimate the timing of relapse, the prevalence of multiple relapses and the predictors of relapse in patients with giant cell arteritis (GCA).
Methods: PubMed, Embase and Cochrane databases were searched from inception till November, 30 2021. Outcome measures include cumulative relapse rate (CRR) of first relapse at year 1, 2, and 5 after treatment initiation, CRR of second and third relapse and predictors of relapse. A random-effects model was used.
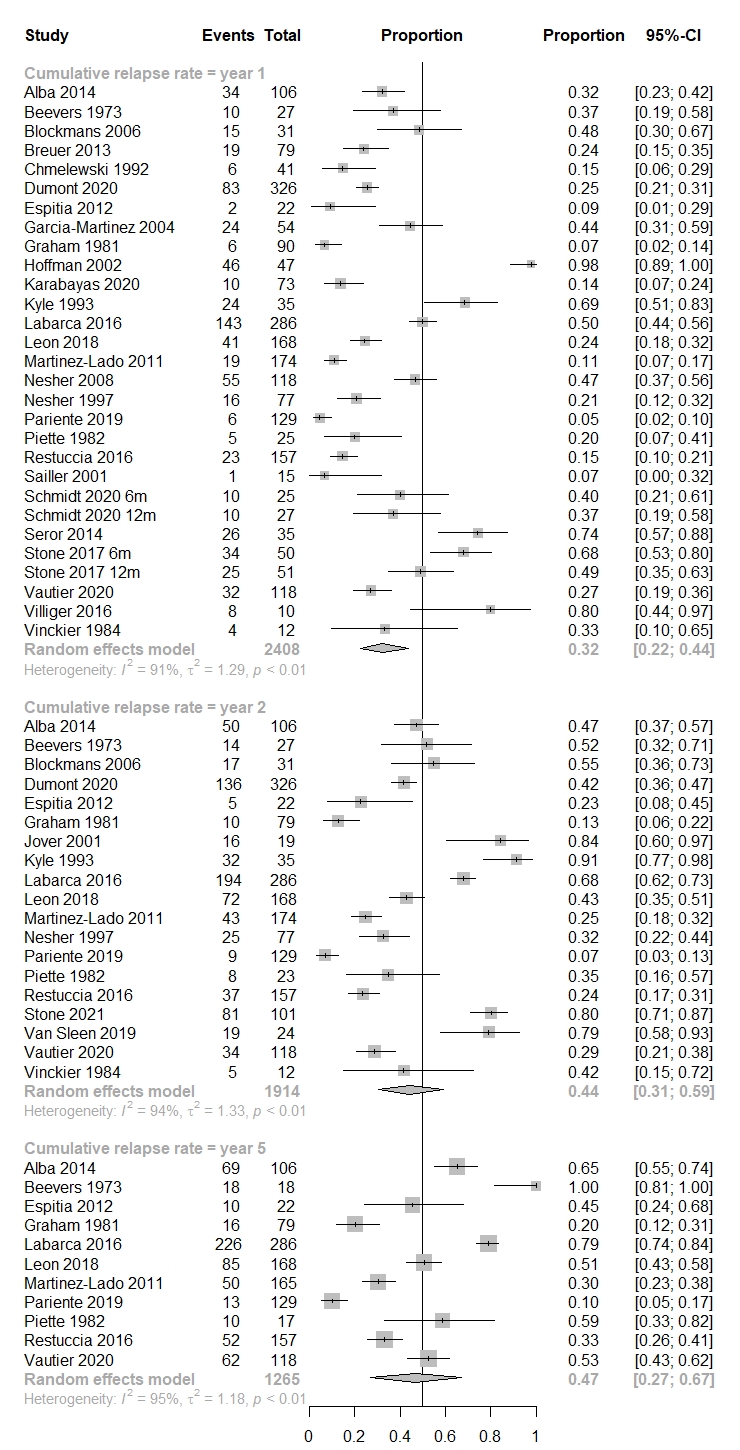
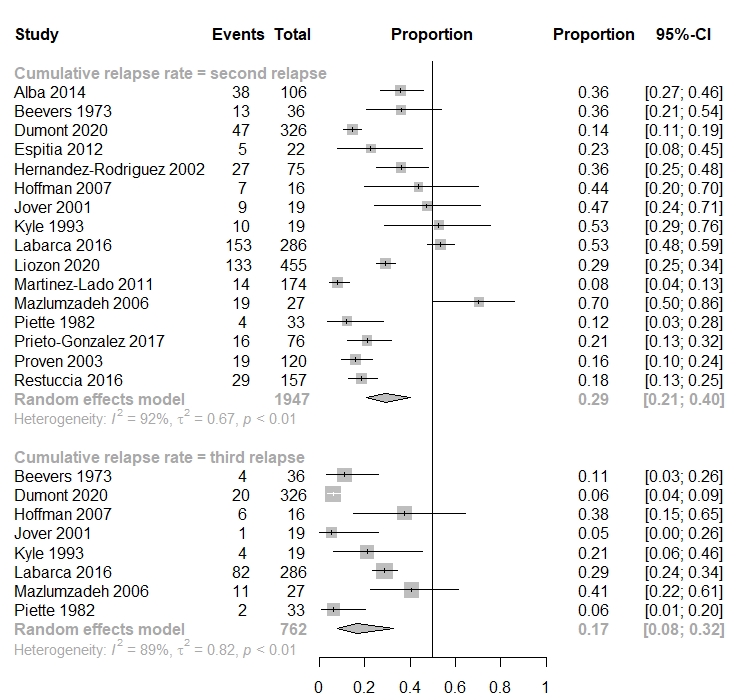
Results: Thirty studies (2595 patients) were included for timing of relapse, 16 studies (1947 patients) for prevalence of multiple relapses and 40 studies (4213 patients) for predictors of relapse. One-year, 2-year and 5-year CRRs were 32.0% [95% CI 22.4 – 43.6%], 44.3% [95% CI 30.5 – 59.1%], and 46.6% [95% CI 27.2 – 67.1%], respectively. The duration of scheduled glucocorticoid therapy was negatively associated with the 1-year CRR (p = 0.05). CRR of second and third relapse were 29.6% [95% CI 20.6 – 40.0] and 16.9% [95% CI 8.0 – 32.5%], respectively. Female sex (OR 1.43) and large vessel involvement (OR 2.04) were predictors of relapse.
Conclusion: Relapse occurred in almost half of GCA patients mainly during the first two years after diagnosis. One in three patients had multiple relapses. The optimal glucocorticoid tapering schedule, which seeks a balance between the lowest relapse risk and the shortest glucocorticoid duration, needs to be determined in future studies. Longer scheduled glucocorticoid therapy or early introduction of glucocorticoid-sparing agents may be warranted in female patients and patients with large vessel involvement.
 Figure 1: Forest plot of the cumulative relapse rate of first relapse at year 1, 2 and 5 after treatment initiation.
 Figure 2: Forest plot of the cumulative relapse rate of second and third relapse
.jpg) Figure 3: Forest plot of predictors of relapse A. Binary predictors B. Continuous predictors
Figure 3: Forest plot of predictors of relapse A. Binary predictors B. Continuous predictors
Disclosures: L. Moreel, None; A. Betrains, None; G. Molenberghs, None; S. Vanderschueren, None; D. Blockmans, None.
Background/Purpose: The aim of this study was to estimate the timing of relapse, the prevalence of multiple relapses and the predictors of relapse in patients with giant cell arteritis (GCA).
Methods: PubMed, Embase and Cochrane databases were searched from inception till November, 30 2021. Outcome measures include cumulative relapse rate (CRR) of first relapse at year 1, 2, and 5 after treatment initiation, CRR of second and third relapse and predictors of relapse. A random-effects model was used.
Results: Thirty studies (2595 patients) were included for timing of relapse, 16 studies (1947 patients) for prevalence of multiple relapses and 40 studies (4213 patients) for predictors of relapse. One-year, 2-year and 5-year CRRs were 32.0% [95% CI 22.4 – 43.6%], 44.3% [95% CI 30.5 – 59.1%], and 46.6% [95% CI 27.2 – 67.1%], respectively. The duration of scheduled glucocorticoid therapy was negatively associated with the 1-year CRR (p = 0.05). CRR of second and third relapse were 29.6% [95% CI 20.6 – 40.0] and 16.9% [95% CI 8.0 – 32.5%], respectively. Female sex (OR 1.43) and large vessel involvement (OR 2.04) were predictors of relapse.
Conclusion: Relapse occurred in almost half of GCA patients mainly during the first two years after diagnosis. One in three patients had multiple relapses. The optimal glucocorticoid tapering schedule, which seeks a balance between the lowest relapse risk and the shortest glucocorticoid duration, needs to be determined in future studies. Longer scheduled glucocorticoid therapy or early introduction of glucocorticoid-sparing agents may be warranted in female patients and patients with large vessel involvement.
 Figure 1: Forest plot of the cumulative relapse rate of first relapse at year 1, 2 and 5 after treatment initiation.
  Figure 2: Forest plot of the cumulative relapse rate of second and third relapse
 .jpg) Figure 3: Forest plot of predictors of relapse A. Binary predictors B. Continuous predictors
Figure 3: Forest plot of predictors of relapse A. Binary predictors B. Continuous predictorsDisclosures: L. Moreel, None; A. Betrains, None; G. Molenberghs, None; S. Vanderschueren, None; D. Blockmans, None.

