Back
Poster Session D
Osteoarthritis (OA) and related disorders
Session: (1888–1923) Osteoarthritis – Clinical Poster
1914: Acoustic Classification of Early and Advanced Osteoarthritis of the Knee in Clinical Settings
Monday, November 14, 2022
1:00 PM – 3:00 PM Eastern Time
Location: Virtual Poster Hall
- DE
David Ewart, MD
Minneapolis Veterans Affairs Healthcare System
Mendota Heights, MN, United States
Abstract Poster Presenter(s)
Dave Ewart1, Ashley Draisey2, Omer Inan3, Chris Nichols3 and Goktug Ozmen3, 1Minneapolis Veterans Affairs Medical Center, Minneapolis, MN, 2Allina Health, Minneapolis, MN, 3Georgia Institute of Technology, Atlanta, GA
Background/Purpose: Knee osteoarthritis (OA) is a prevalent and debilitating disease. Diagnosis of early knee OA is difficult and insensitive with current technologies. The human knee generates noise, termed crepitus, when healthy or osteoarthritic; the measurement of this crepitus is termed "knee acoustic emissions". Knee acoustic emissions are quantitatively different in knees with advanced, radiographic OA (rad-OA) than from healthy control knees in limited, controlled settings. The ability to use acoustics to identify early, pre-radiographic OA (pre-OA) or to detect any knee OA in environments with background noise, such as a clinic, has not been tested. Our primary objective was to differentiate knees with pre-OA and rad-OA from healthy control knees using knee acoustic emissions measured with a wearable device in a clinical setting and while performing scripted maneuvers.
Methods: This was a single center study comparing acoustic data between healthy, pre-OA, or rad-OA knees from 27 subjects (37 knees,14 healthy, 11 pre-OA, 11 rad-OA). Pre-OA was defined by meeting ACR clinical classification criteria for knee OA and either x-ray findings of Kellgren-Lawrence (KG) grade 1 or KG 0 with MRI findings of articular cartilage damage. Rad-OA was defined as meeting ACR classification criteria for knee OA and KG 2 or greater. Age, BMI, gender, and knee symptoms measured with the Knee Injury and Osteoarthritis Outcome Score (KOOS) were recorded. Patient characteristics were compared with statistical methods (gender with chi-square, KOOS scores between pre-OA and rad-OA with paired t-tests, age and BMI using ANOVA with Tukey's post-hoc). Acoustic data were collected in clinic exam rooms using miniature accelerometers (i.e., contact microphones) attached to the patient's knee during scripted maneuvers: flexion-extension, sit-to-stand, and walking. Acoustic data were processed (Figure 1), and their variability and patterns visualized with unsupervised machine learning (Figure 2). Acoustic features were used to train a linear-classification algorithm for knee disease status using supervised machine learning. Accuracy of our classification algorithm was measured with Leave-One-Out Cross-Validation.
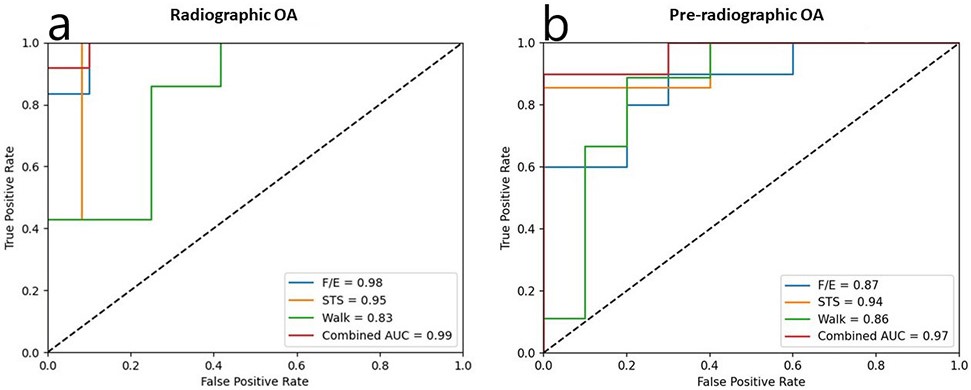
Results: The rad-OA disease group was older than the control group (mean age 62 vs 37, p=0.005). There were no other between group differences in subject characteristics. In knees with rad-OA, our classification algorithm was highly accurate in classifying disease state during flexion-extension (accuracy 90%, area under the curve (AUC) 0.94) and sit-to-stand (100%) maneuvers. Walking was slightly less accurate (81%, AUC 0.75). Accuracy for pre-OA was similar (80% flexion-extension, 88% sit-to-stand, 84% walking. Accuracy was higher when analyzing the three scripted maneuvers combined than with each individual maneuver (rad-OA 92%, AUC 0.99, pre-OA 95%, AUC 0.97) (Figure 3). Acoustics were more accurate for disease status classification than age, BMI, and KOOS score.
Conclusion: Our study illustrates the efficacy and potential utility of using acoustic emission analysis to accurately identify the presence of early and advanced osteoarthritis of the knee in clinical settings with limited control of background noise.
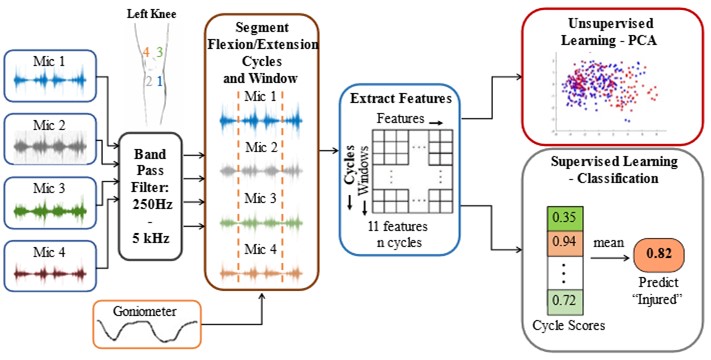
 Figure 1: Workflow for measurement and processing of acoustic emissions, band pass filtering the acoustic frequencies of interest, segment isolation, feature extraction, data pattern visualization with principal component analysis, and development and testing of a classification scheme using machine learning. PCA: principal component analysis.
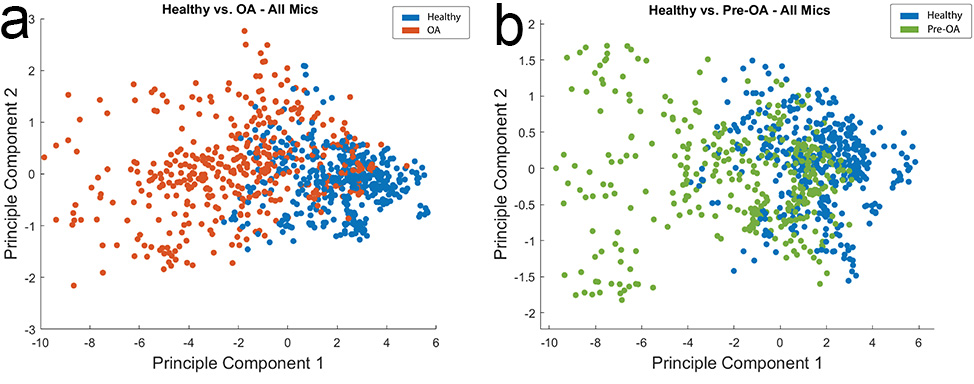
 Figure 2: Principal component analysis of acoustic emissions from healthy vs radiographic knee OA (a) and healthy vs pre-radiographic knee OA (b) subjects while performing flexion-extension maneuvers. There is separation between healthy subjects and subjects with both pre-radiographic and radiographic osteoarthritis of the knee. OA: osteoarthritis; pre-OA: pre-radiographic osteoarthritis.
 Figure 3: Receiver operating characteristic curves showing true positive classification rate and false positive classification rate for a) radiographic knee OA and b) pre-radiographic knee OA as “diseased” relative to “healthy” controls. Combined AUC was 0.99 for radiographic knee OA and 0.97 for pre-radiographic knee OA. OA: osteoarthritis; F/E: flexion-extension; STS: sit-to-stand; AUC: area under the curve.
Disclosures: D. Ewart, None; A. Draisey, None; O. Inan, Arthroba; C. Nichols, None; G. Ozmen, None.
Background/Purpose: Knee osteoarthritis (OA) is a prevalent and debilitating disease. Diagnosis of early knee OA is difficult and insensitive with current technologies. The human knee generates noise, termed crepitus, when healthy or osteoarthritic; the measurement of this crepitus is termed "knee acoustic emissions". Knee acoustic emissions are quantitatively different in knees with advanced, radiographic OA (rad-OA) than from healthy control knees in limited, controlled settings. The ability to use acoustics to identify early, pre-radiographic OA (pre-OA) or to detect any knee OA in environments with background noise, such as a clinic, has not been tested. Our primary objective was to differentiate knees with pre-OA and rad-OA from healthy control knees using knee acoustic emissions measured with a wearable device in a clinical setting and while performing scripted maneuvers.
Methods: This was a single center study comparing acoustic data between healthy, pre-OA, or rad-OA knees from 27 subjects (37 knees,14 healthy, 11 pre-OA, 11 rad-OA). Pre-OA was defined by meeting ACR clinical classification criteria for knee OA and either x-ray findings of Kellgren-Lawrence (KG) grade 1 or KG 0 with MRI findings of articular cartilage damage. Rad-OA was defined as meeting ACR classification criteria for knee OA and KG 2 or greater. Age, BMI, gender, and knee symptoms measured with the Knee Injury and Osteoarthritis Outcome Score (KOOS) were recorded. Patient characteristics were compared with statistical methods (gender with chi-square, KOOS scores between pre-OA and rad-OA with paired t-tests, age and BMI using ANOVA with Tukey's post-hoc). Acoustic data were collected in clinic exam rooms using miniature accelerometers (i.e., contact microphones) attached to the patient's knee during scripted maneuvers: flexion-extension, sit-to-stand, and walking. Acoustic data were processed (Figure 1), and their variability and patterns visualized with unsupervised machine learning (Figure 2). Acoustic features were used to train a linear-classification algorithm for knee disease status using supervised machine learning. Accuracy of our classification algorithm was measured with Leave-One-Out Cross-Validation.
Results: The rad-OA disease group was older than the control group (mean age 62 vs 37, p=0.005). There were no other between group differences in subject characteristics. In knees with rad-OA, our classification algorithm was highly accurate in classifying disease state during flexion-extension (accuracy 90%, area under the curve (AUC) 0.94) and sit-to-stand (100%) maneuvers. Walking was slightly less accurate (81%, AUC 0.75). Accuracy for pre-OA was similar (80% flexion-extension, 88% sit-to-stand, 84% walking. Accuracy was higher when analyzing the three scripted maneuvers combined than with each individual maneuver (rad-OA 92%, AUC 0.99, pre-OA 95%, AUC 0.97) (Figure 3). Acoustics were more accurate for disease status classification than age, BMI, and KOOS score.
Conclusion: Our study illustrates the efficacy and potential utility of using acoustic emission analysis to accurately identify the presence of early and advanced osteoarthritis of the knee in clinical settings with limited control of background noise.
 Figure 1: Workflow for measurement and processing of acoustic emissions, band pass filtering the acoustic frequencies of interest, segment isolation, feature extraction, data pattern visualization with principal component analysis, and development and testing of a classification scheme using machine learning. PCA: principal component analysis.
 Figure 2: Principal component analysis of acoustic emissions from healthy vs radiographic knee OA (a) and healthy vs pre-radiographic knee OA (b) subjects while performing flexion-extension maneuvers. There is separation between healthy subjects and subjects with both pre-radiographic and radiographic osteoarthritis of the knee. OA: osteoarthritis; pre-OA: pre-radiographic osteoarthritis.
  Figure 3: Receiver operating characteristic curves showing true positive classification rate and false positive classification rate for a) radiographic knee OA and b) pre-radiographic knee OA as “diseased” relative to “healthy” controls. Combined AUC was 0.99 for radiographic knee OA and 0.97 for pre-radiographic knee OA. OA: osteoarthritis; F/E: flexion-extension; STS: sit-to-stand; AUC: area under the curve.
Disclosures: D. Ewart, None; A. Draisey, None; O. Inan, Arthroba; C. Nichols, None; G. Ozmen, None.

