
Poster Session D
Elizabeth Bundschuh, BA
Yale University
New York, NY, United States
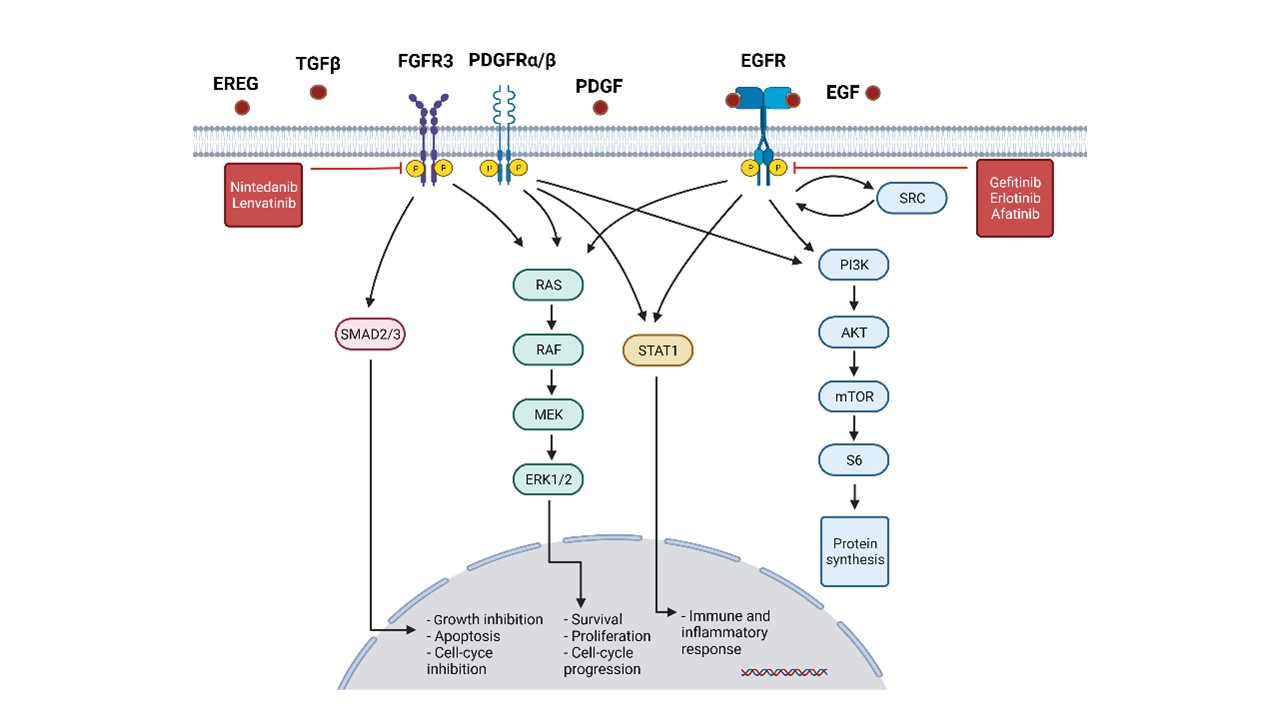 Figure 1. RTKs and downstream pathways in SSc skin.
 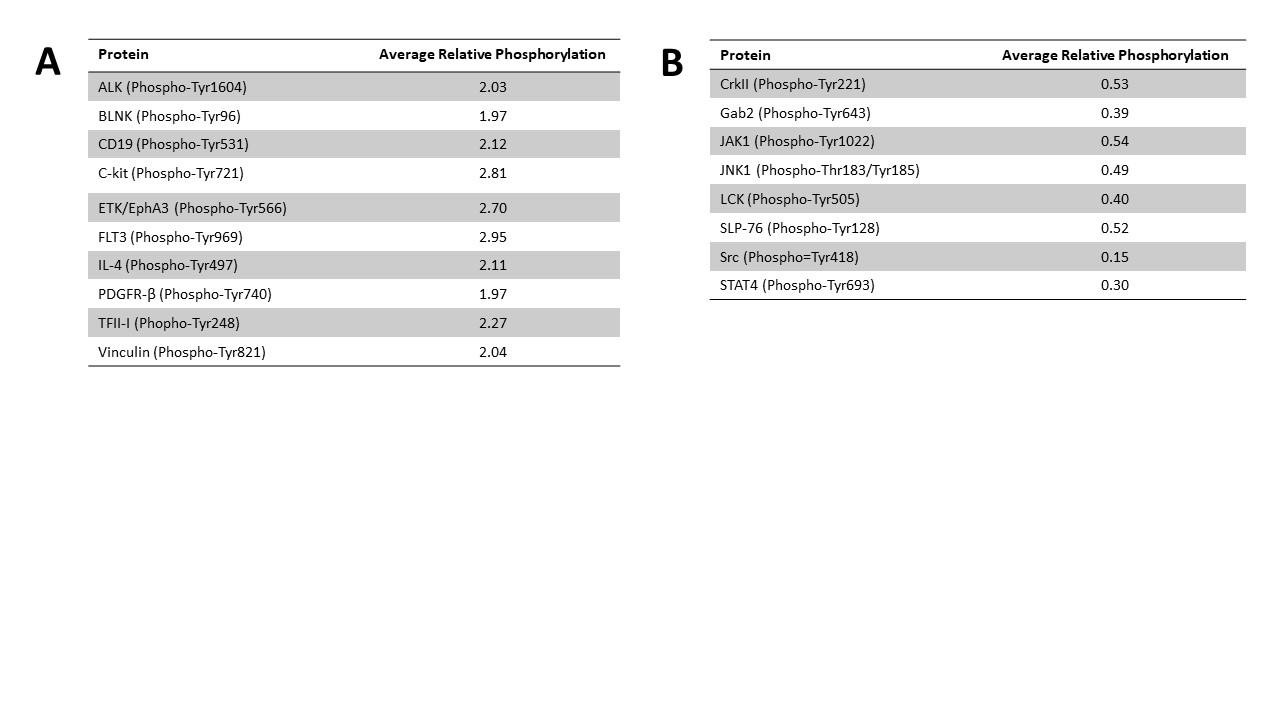 Figure 2. A. Abridged list of 10 (out of 228) proteins with increased phosphorylation in SSc vs. HC skin. *Relative phosphorylation level (SSc/HC) > 2. B. Abridged list of 8 proteins with decreased phosphorylation in SSc vs. HC skin. *Relative phosphorylation level (SSc/HC) < 0.5.
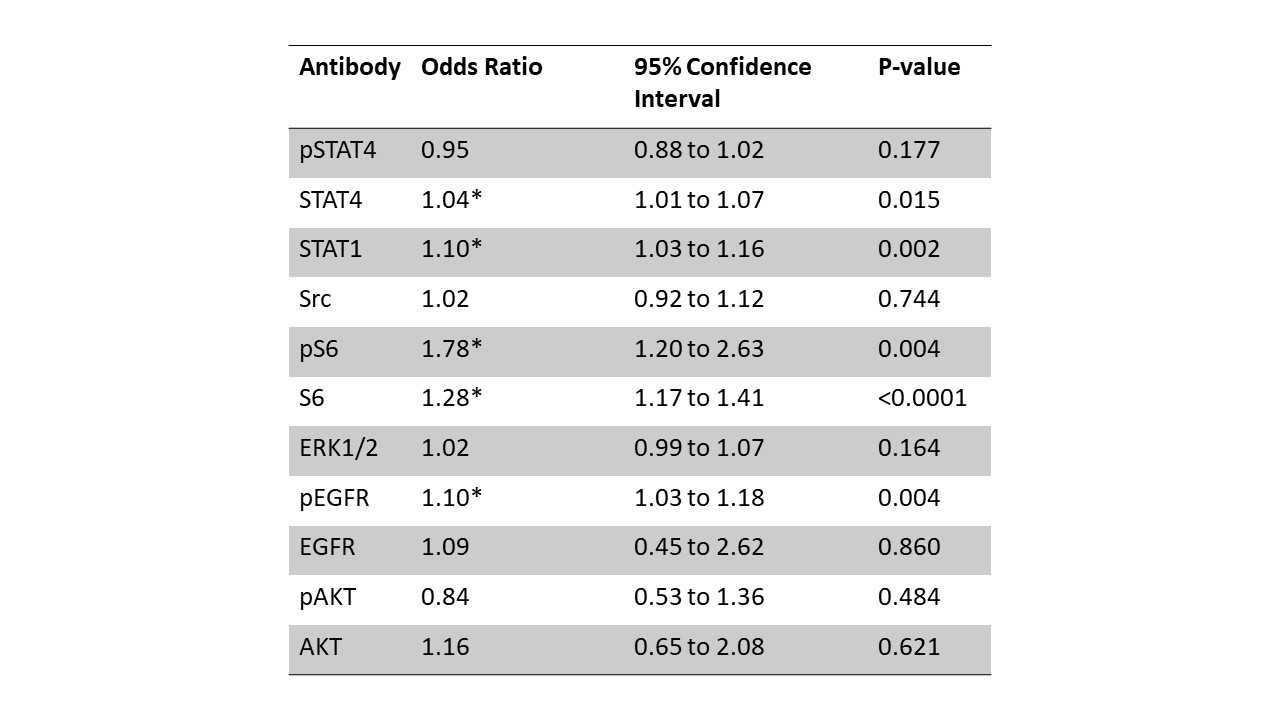 Figure 3. A. Odds ratio and 95% confidence interval for IHC proteins. *p < 0.05, CI > 1.0.