Back
Abstract Session
Rheumatoid arthritis (RA)
Session: Abstracts: RA – Etiology and Pathogenesis (0498–0501)
0499: Drivers of Heterogeneity in Synovial Fibroblasts in Rheumatoid Arthritis
Saturday, November 12, 2022
3:15 PM – 3:25 PM Eastern Time
Location: Room 204

Melanie Smith, MD, PhD
Hospital for Special Surgery
New York, NY, United States
Presenting Author(s)
Melanie Smith1, Vianne Gao2, Edward DiCarlo1, Susan Goodman1, Thomas Norman2, Laura Donlin1, Christina Leslie2 and Alexander Rudensky2, 1Hospital for Special Surgery, New York, NY, 2Memorial Sloan Kettering Cancer Center, New York, NY
Background/Purpose: Rheumatoid arthritis (RA) is characterized by hyperplasia of both the synovial lining, which forms the synovial fluid interface, as well as the synovial sublining, which exhibits increased vascularization and an influx of bone marrow-derived innate and adaptive immune cells. Both the lining and sublining fibroblast-like synoviocytes (FLS) exhibit altered phenotypes in RA, with recent studies demonstrating considerable heterogeneity (Alivernini, S et al. 2020, Nat Med; Mizoguchi, F et al. 2018, Nat Commun; Zhang, F et al. 2019, Nat Immunol). We hypothesized that states of FLS activation and differentiation throughout the synovium are likely modulated by diverse innate and adaptive immune cell types found in the inflamed synovium. We combined in vitro modeling of cytokine signaling, paired single cell RNA and ATAC sequencing (scRNA/ATAC-seq), and spatial transcriptomics (ST) to elucidate drivers of FLS heterogeneity in the RA synovium and define their spatial distribution.
Methods: Synovial tissue was obtained from a prospective cohort of RA patients undergoing arthroplasty or synovectomy who are screened for active RA at the time of surgery (HSS IRB no. 2014-233). Paired scRNA/ATAC-seq was performed on RA FLS (CD45-, CD31-, PDPN+) isolated from 2 donors with a high degree of lymphocytic inflammation. Nuclei suspensions were sequenced via Chromium Single Cell Multiome ATAC + Gene Expression (10x Genomics). To define FLS-specific cytokine-response signatures, FLS were cultured from 4 donors and stimulated with cytokines indicated in Fig 1 for 24 hours in triplicate. For ST, we used the Visium Spatial Gene Expression platform (10x Genomics) (2 donors).
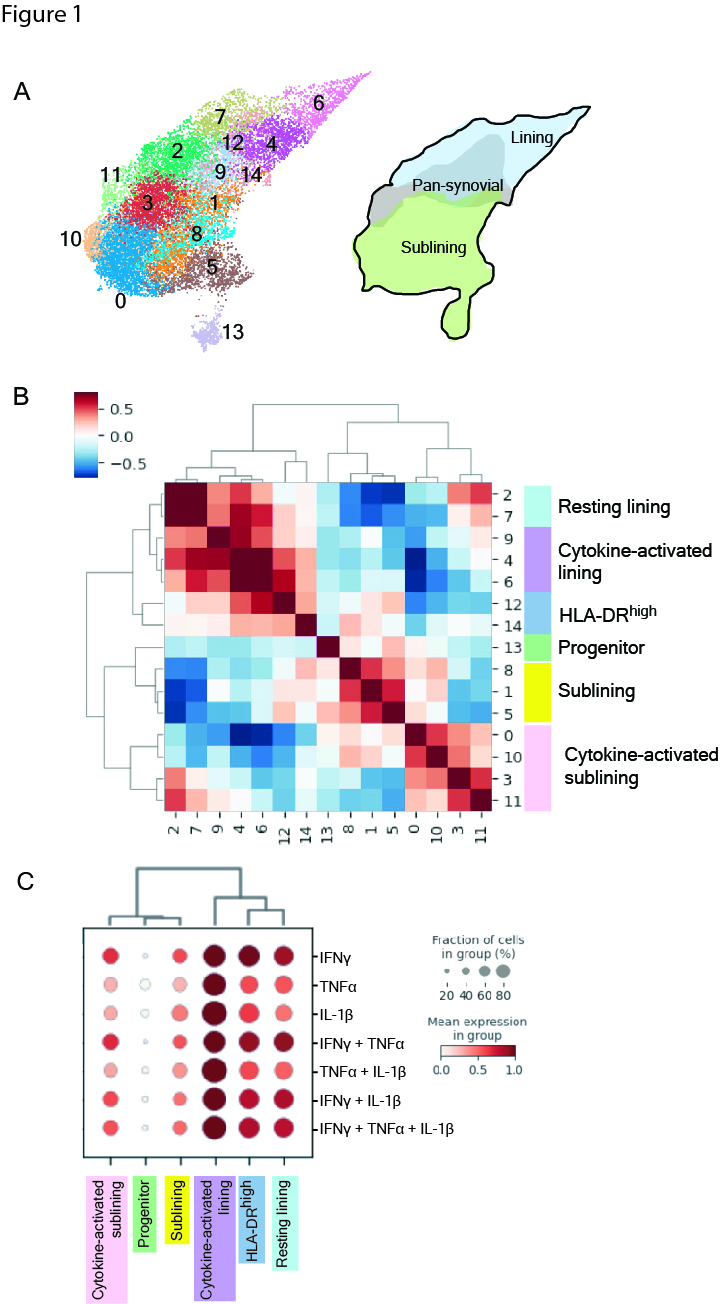
Results: We obtained 15,736 FLS that clustered into 14 subtypes based on the scRNA-seq datasets (Fig 1). Gene set enrichment analysis and a cluster-by-cluster correlation refined the categorization into six robust FLS states with distinct inferred functionality. Mapping of cytokine response gene signatures to TNFα, IFNγ and IL-1β either alone or in combination established in vitro onto our scRNA-seq datasets revealed the most pronounced expression of these signatures in the cytokine-activated lining state. The states also occupied divergent areas of the scATAC-seq UMAP and exhibited differentially accessible transcription factor motifs (Fig 2): the cytokine-activated lining was enriched for activity of AP-1 transcription factor family members (e.g. FOS, JUN), whereas the activated sublining demonstrated accessibility of STAT and IRF motifs. The dominant AP-1 signature seen in the lining state correlated to the in vitro response involving IL-1β. Mapping the six FLS and cytokine response signatures onto the ST datasets revealed that the IL-1β response signature spatially correlated with the cytokine-activated lining FLS (Fig 3).
Conclusion: Our analysis of paired datasets allowed us to detect six FLS states that were defined by both distinct transcriptional signatures as well as patterns of chromatin accessibility. These states are driven by differential exposure to myeloid and T cell derived cytokines, IL-1α, TNFα, IFNγ, or lack thereof. Our results highlight a role for concurrent, spatially-distributed cytokine signaling within the RA synovium.
 Figure 1. FLS in the inflamed RA synovium exist in distinct states driven by cytokine signaling.
A, UMAP of 14 FLS clusters identified by scRNA-seq analysis with annotations of synovial localization. B, Cluster by cluster correlation of the mean expression of highly variable genes in clusters with defined FLS states colored on UMAP. C, Dot plot showing relative expression of in vitro defined FLS-specific cytokine response signatures in each of the FLS states. Cultured FLS were stimulated with TNFa (0.1 ng/mL), IFNg(0.05 ng/mL), or IL-1b (0.01 ng/mL) alone or in combination for 24 hours followed by RNA isolation and bulk RNA seq.
<img src=https://www.abstractscorecard.com/uploads/Tasks/upload/17574/QHOPTGBB-1291363-2-ANY.jpg width=440 height=438.105081826012 border=0 style=border-style: none;>
.jpg) Figure 3. FLS states and cytokine signaling are spatially constrained within the synovium.
Figure 3. FLS states and cytokine signaling are spatially constrained within the synovium.
A, Relative expression of FLS states in each RNA capture area on the ST slide. B, Relative expression of FLS cytokine response signatures in each RNA capture area on the ST slide.
Disclosures: M. Smith, None; V. Gao, None; E. DiCarlo, None; S. Goodman, Novartis, UCB; T. Norman, None; L. Donlin, None; C. Leslie, None; A. Rudensky, Sonoma Biotherapeutics, RAPT Therapeutics, Surface Oncology, Vendanta Biosciences, BioInvent.
Background/Purpose: Rheumatoid arthritis (RA) is characterized by hyperplasia of both the synovial lining, which forms the synovial fluid interface, as well as the synovial sublining, which exhibits increased vascularization and an influx of bone marrow-derived innate and adaptive immune cells. Both the lining and sublining fibroblast-like synoviocytes (FLS) exhibit altered phenotypes in RA, with recent studies demonstrating considerable heterogeneity (Alivernini, S et al. 2020, Nat Med; Mizoguchi, F et al. 2018, Nat Commun; Zhang, F et al. 2019, Nat Immunol). We hypothesized that states of FLS activation and differentiation throughout the synovium are likely modulated by diverse innate and adaptive immune cell types found in the inflamed synovium. We combined in vitro modeling of cytokine signaling, paired single cell RNA and ATAC sequencing (scRNA/ATAC-seq), and spatial transcriptomics (ST) to elucidate drivers of FLS heterogeneity in the RA synovium and define their spatial distribution.
Methods: Synovial tissue was obtained from a prospective cohort of RA patients undergoing arthroplasty or synovectomy who are screened for active RA at the time of surgery (HSS IRB no. 2014-233). Paired scRNA/ATAC-seq was performed on RA FLS (CD45-, CD31-, PDPN+) isolated from 2 donors with a high degree of lymphocytic inflammation. Nuclei suspensions were sequenced via Chromium Single Cell Multiome ATAC + Gene Expression (10x Genomics). To define FLS-specific cytokine-response signatures, FLS were cultured from 4 donors and stimulated with cytokines indicated in Fig 1 for 24 hours in triplicate. For ST, we used the Visium Spatial Gene Expression platform (10x Genomics) (2 donors).
Results: We obtained 15,736 FLS that clustered into 14 subtypes based on the scRNA-seq datasets (Fig 1). Gene set enrichment analysis and a cluster-by-cluster correlation refined the categorization into six robust FLS states with distinct inferred functionality. Mapping of cytokine response gene signatures to TNFα, IFNγ and IL-1β either alone or in combination established in vitro onto our scRNA-seq datasets revealed the most pronounced expression of these signatures in the cytokine-activated lining state. The states also occupied divergent areas of the scATAC-seq UMAP and exhibited differentially accessible transcription factor motifs (Fig 2): the cytokine-activated lining was enriched for activity of AP-1 transcription factor family members (e.g. FOS, JUN), whereas the activated sublining demonstrated accessibility of STAT and IRF motifs. The dominant AP-1 signature seen in the lining state correlated to the in vitro response involving IL-1β. Mapping the six FLS and cytokine response signatures onto the ST datasets revealed that the IL-1β response signature spatially correlated with the cytokine-activated lining FLS (Fig 3).
Conclusion: Our analysis of paired datasets allowed us to detect six FLS states that were defined by both distinct transcriptional signatures as well as patterns of chromatin accessibility. These states are driven by differential exposure to myeloid and T cell derived cytokines, IL-1α, TNFα, IFNγ, or lack thereof. Our results highlight a role for concurrent, spatially-distributed cytokine signaling within the RA synovium.
 Figure 1. FLS in the inflamed RA synovium exist in distinct states driven by cytokine signaling.
 A, UMAP of 14 FLS clusters identified by scRNA-seq analysis with annotations of synovial localization. B, Cluster by cluster correlation of the mean expression of highly variable genes in clusters with defined FLS states colored on UMAP. C, Dot plot showing relative expression of in vitro defined FLS-specific cytokine response signatures in each of the FLS states. Cultured FLS were stimulated with TNFa (0.1 ng/mL), IFNg(0.05 ng/mL), or IL-1b (0.01 ng/mL) alone or in combination for 24 hours followed by RNA isolation and bulk RNA seq.
<img src=https://www.abstractscorecard.com/uploads/Tasks/upload/17574/QHOPTGBB-1291363-2-ANY.jpg width=440 height=438.105081826012 border=0 style=border-style: none;>
Figure 2. FLS states exhibit evidence of distinct transcriptional regulation through differential chromatin accessibility.
A, Projection of six FLS states onto scATAC-seq UMAP. B, Heat map with top 10 differentially accessible transcription factor motifs identified by ChromVAR for each FLS state. Motifs were filtered to include only those for which the corresponding transcription factor was expressed by >20% of cells in the corresponding state. C, ChromVAR z-score of motifs from B in cultured FLS that were unstimulated, simulated with TNFa + IFNg, or stimulated with TNFa, IFNg and IL-1b.
A, Projection of six FLS states onto scATAC-seq UMAP. B, Heat map with top 10 differentially accessible transcription factor motifs identified by ChromVAR for each FLS state. Motifs were filtered to include only those for which the corresponding transcription factor was expressed by >20% of cells in the corresponding state. C, ChromVAR z-score of motifs from B in cultured FLS that were unstimulated, simulated with TNFa + IFNg, or stimulated with TNFa, IFNg and IL-1b.
.jpg) Figure 3. FLS states and cytokine signaling are spatially constrained within the synovium.
Figure 3. FLS states and cytokine signaling are spatially constrained within the synovium.A, Relative expression of FLS states in each RNA capture area on the ST slide. B, Relative expression of FLS cytokine response signatures in each RNA capture area on the ST slide.
Disclosures: M. Smith, None; V. Gao, None; E. DiCarlo, None; S. Goodman, Novartis, UCB; T. Norman, None; L. Donlin, None; C. Leslie, None; A. Rudensky, Sonoma Biotherapeutics, RAPT Therapeutics, Surface Oncology, Vendanta Biosciences, BioInvent.

