
Poster Session D
Zoe Brown, MBBS, FRACP
The University of Melbourne
Armadale, Victoria, Australia
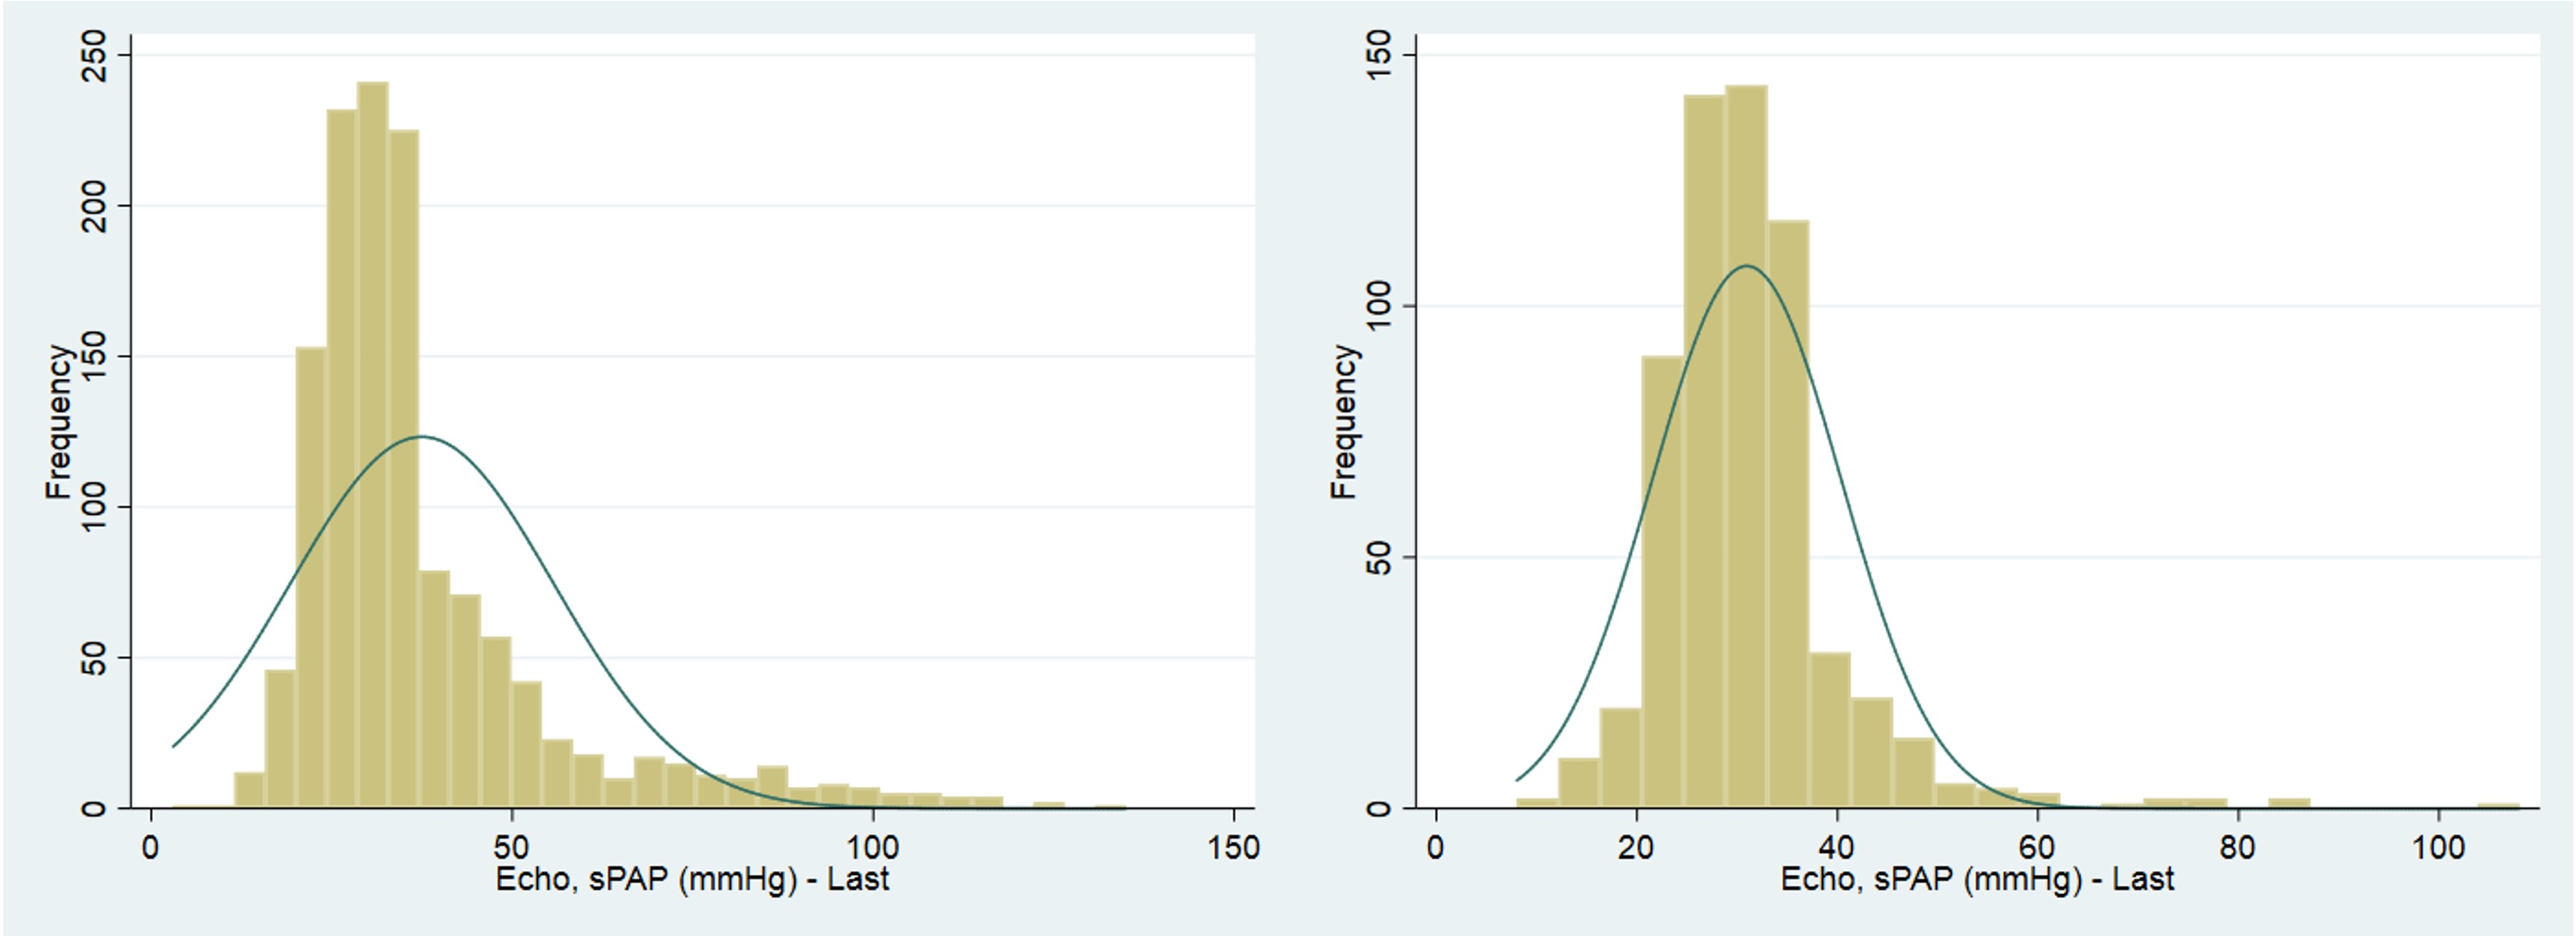 Figure 1a.) Histogram of RVSP in whole cohort; Figure 1b.) Histogram of RVSP in those without PH
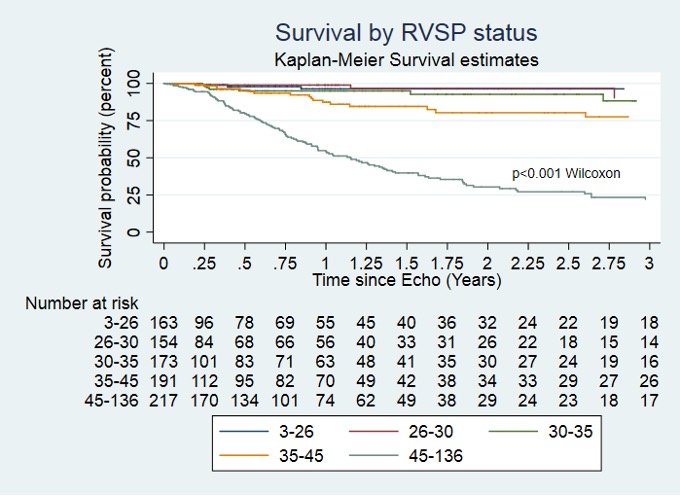 Figure 2a.) Kaplan-Meier survival curve from TTE to all-cause mortality by RVSP quintile in the whole cohort
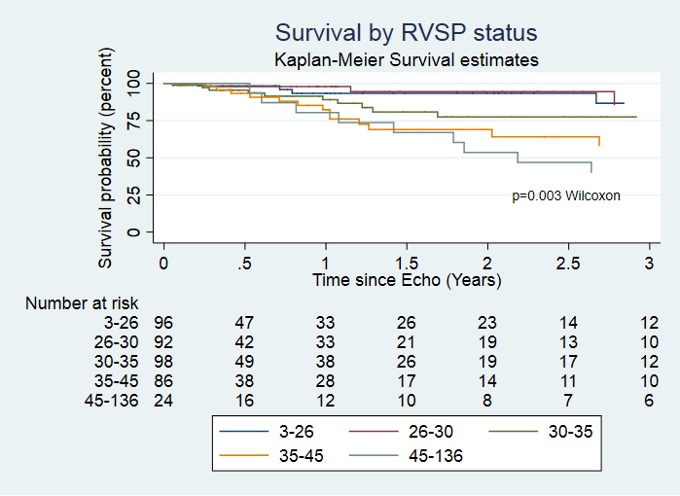 Figure 2b.) Kaplan-Meier survival curve from TTE to all-cause mortality by RVSP quintile in patients without PH