Back
Abstract Session
Rheumatoid arthritis (RA)
Session: Abstracts: RA – Etiology and Pathogenesis (0498–0501)
0501: Single-molecule Spatial Transcriptomic Analysis Reveals Distinct Cellular Networks in Rheumatoid Arthritis Synovia
Saturday, November 12, 2022
3:45 PM – 3:55 PM Eastern Time
Location: Room 204
- RM
Roopa Madhu, PhD
Brigham and Women's Hospital
Brookline, MA, United States
Presenting Author(s)
Roopa Madhu1, Kartik Bhamidipati1, Nghia Millard2, Michelle Curtis2, Ye Cui3, Youngmi Kim3, Ellen Gravallese4, Soumya Raychaudhuri1, Michael Brenner4, ilya Korsunsky1 and Kevin Wei5, 1Brigham and Women's Hospital, Boston, MA, 2Broad Institute, Boston, MA, 3Nanostring Technologies Inc., Seattle, WA, 4Brigham and Women's Hospital, Harvard Medical School, Boston, MA, 5Brigham and Women's Hospital and Harvard Medical School, Boston, MA
Background/Purpose: Chronic joint inflammation in rheumatoid arthritis (RA) arises from the interactions of many cell types. Single-cell transcriptomic profiling of RA joints has identified novel cell states and pathogenic pathways in RA. To translate these new insights into novel therapeutic strategies, we must understand how complex cellular interactions lead to joint pathology and chronic inflammation in RA synovia. The ability to visualize cellular interactions directly in joints of RA patients thus represents a major unmet need in RA research and an impediment to precision medicine in RA.
Methods:
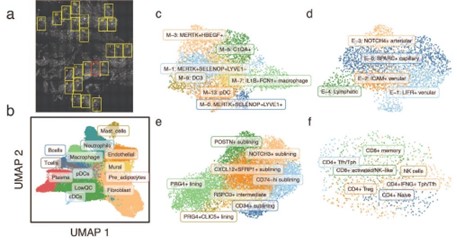
Spatial transcriptomic profiling. We applied NanoString CosMx Spatial Molecular Imager, which couples cyclic in situ hybridization chemistry with ultra-high-resolution imaging readout to generate a single-molecule resolution, spatial transcriptomic atlas of 980 unique genes in RA synovia. We profiled paraffin-embedded synovial tissues from 3 RA and 1 osteoarthritis patient, selecting up to 25 fields of views (FOVs) in each tissue based on H&E histology (Fig. 1a).
Cell segmentation and data analysis. We used in-house analytical pipelines to identify cells in situ and define their local microenvironments. We first aggregated individual mRNA molecules into cells, based on segmentation algorithms designed for multiplexed smFISH1. We then labeled these cells based on their gene expression profiles, identifying both cell types and fine-grained states. Finally, we used clustering methods specialized for spatial data to segment the tissue into anatomical regions defined by similar compositions of cell types.
Results:
Conclusion: We demonstrate the feasibility of implementing next-generation, single-molecule, spatial transcriptomic profiling in RA synovium. We identified distinct immune and stromal cell states localized across 5 major cellular networks. To our knowledge, this dataset represents the first single-molecule, spatial transcriptomic atlas of RA synovia. The ability to visualize gene expression at a single-molecule resolution in RA synovia will add new dimensions to our understanding of the pathological cellular networks RA.
 Identification of cell states in RA synovia using single-molecule spatial transcriptomics. (a) Highlighted FOVs were profiled with CosMx. (b) UMAP projection shows the location of individual cells in low dimensional space, colored by their inferred major cell type. Fine-grained clustering results of (c) myeloid cells, (d) endothelial cells, (e) fibroblasts, and (f) T cells are shown in fine-grained UMAP plots.
 Spatial reconstruction of cellular networks in RA synovia. (a-c) Three representative fields of view images of CosMx RA synovial dataset shows anatomical distribution of major cell types and selected cell subtypes. (d-f) In the same images, spatially localized cells were grouped into five distinct anatomical regions
Disclosures: R. Madhu, None; K. Bhamidipati, None; N. Millard, None; M. Curtis, None; Y. Cui, Nanostring Technologies; Y. Kim, Nanostring Technologies; E. Gravallese, New England Journal of Medicine, Textbook Rheumatology, AMN healthcare, CVS, American Well Corporation, Cerner Corp; S. Raychaudhuri, Mestag, Inc, Rheos Medicines, Janssen, Pfizer, Biogen; M. Brenner, GSK, 4FO Ventures, Mestag Therapeutics; i. Korsunsky, Mestag Therapeutics Ltd.; K. Wei, Gilead sciences, Mestag, nanoString, 10X Genomics.
Background/Purpose: Chronic joint inflammation in rheumatoid arthritis (RA) arises from the interactions of many cell types. Single-cell transcriptomic profiling of RA joints has identified novel cell states and pathogenic pathways in RA. To translate these new insights into novel therapeutic strategies, we must understand how complex cellular interactions lead to joint pathology and chronic inflammation in RA synovia. The ability to visualize cellular interactions directly in joints of RA patients thus represents a major unmet need in RA research and an impediment to precision medicine in RA.
Methods:
Spatial transcriptomic profiling. We applied NanoString CosMx Spatial Molecular Imager, which couples cyclic in situ hybridization chemistry with ultra-high-resolution imaging readout to generate a single-molecule resolution, spatial transcriptomic atlas of 980 unique genes in RA synovia. We profiled paraffin-embedded synovial tissues from 3 RA and 1 osteoarthritis patient, selecting up to 25 fields of views (FOVs) in each tissue based on H&E histology (Fig. 1a).
Cell segmentation and data analysis. We used in-house analytical pipelines to identify cells in situ and define their local microenvironments. We first aggregated individual mRNA molecules into cells, based on segmentation algorithms designed for multiplexed smFISH1. We then labeled these cells based on their gene expression profiles, identifying both cell types and fine-grained states. Finally, we used clustering methods specialized for spatial data to segment the tissue into anatomical regions defined by similar compositions of cell types.
Results:
- Identification of distinct synovial cell states. Within each tissue, we identified over 20 million transcripts assigned to 40,000 individual cells representing 12 major synovial cell types (Fig. 1b), including 3 cell types (mast cells, neutrophils, and pre-adipocytes) not previously identified in scRNAseq studies of RA synovium, likely due to loss during tissue disaggregation. We next labeled 27 previously identified2 fine-grained cell states within the myeloid (Fig. 1c), endothelial (Fig. 1d), fibroblasts (Fig. 1e), and T cells and NK populations (Fig. 1f)
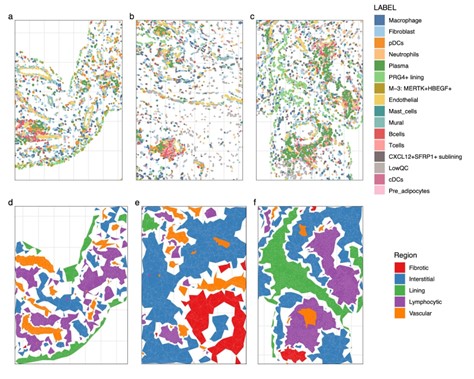
- Identification of unique cellular networks in RA synovia. We identified 5 major types of synovial anatomical zones defined by distinct compositions of cell types and states (Fig. 2d-f): vascular regions composed of endothelial and mural cells, lining regions composed of PRG4+ lining fibroblasts and MERTK+HBEGF+ macrophages, interstitial regions composed of CXCL12+SFRP1+ fibroblasts, neutrophils, and mast cells, lymphocytic regions composed of T cells, B cells and plasma cells, and largely acellular fibrotic regions.
Conclusion: We demonstrate the feasibility of implementing next-generation, single-molecule, spatial transcriptomic profiling in RA synovium. We identified distinct immune and stromal cell states localized across 5 major cellular networks. To our knowledge, this dataset represents the first single-molecule, spatial transcriptomic atlas of RA synovia. The ability to visualize gene expression at a single-molecule resolution in RA synovia will add new dimensions to our understanding of the pathological cellular networks RA.
 Identification of cell states in RA synovia using single-molecule spatial transcriptomics. (a) Highlighted FOVs were profiled with CosMx. (b) UMAP projection shows the location of individual cells in low dimensional space, colored by their inferred major cell type. Fine-grained clustering results of (c) myeloid cells, (d) endothelial cells, (e) fibroblasts, and (f) T cells are shown in fine-grained UMAP plots.
  Spatial reconstruction of cellular networks in RA synovia. (a-c) Three representative fields of view images of CosMx RA synovial dataset shows anatomical distribution of major cell types and selected cell subtypes. (d-f) In the same images, spatially localized cells were grouped into five distinct anatomical regions
Disclosures: R. Madhu, None; K. Bhamidipati, None; N. Millard, None; M. Curtis, None; Y. Cui, Nanostring Technologies; Y. Kim, Nanostring Technologies; E. Gravallese, New England Journal of Medicine, Textbook Rheumatology, AMN healthcare, CVS, American Well Corporation, Cerner Corp; S. Raychaudhuri, Mestag, Inc, Rheos Medicines, Janssen, Pfizer, Biogen; M. Brenner, GSK, 4FO Ventures, Mestag Therapeutics; i. Korsunsky, Mestag Therapeutics Ltd.; K. Wei, Gilead sciences, Mestag, nanoString, 10X Genomics.

