Back
Poster Session D
Immunobiology
Session: (1681–1706) Innate Immunity Poster: Basic and Translational Science
1682: Peptidyl Arginine Deiminase Expression and Macrophage Polarization Following Stimulation with Citrullinated and Malondialdehyde-acetaldehyde Modified Fibrinogen
Monday, November 14, 2022
1:00 PM – 3:00 PM Eastern Time
Location: Virtual Poster Hall
.jpg)
Nozima Aripova, BS
University of Nebraska Medical Center
Omaha, NE, United States
Abstract Poster Presenter(s)
nozima Aripova1, Michael Duryee1, carlos hunter1, Bryant England1, Debra Romberger1, James O'Dell1, Geoffrey Thiele1 and Ted Mikuls2, 1University of Nebraska Medical Center, Omaha, NE, 2Division of Rheumatology, University of Nebraska Medical Center, Omaha, NE
Background/Purpose: Post-translational modifications (PTM) of extracellular matrix proteins, such as fibrinogen, have been implicated in the pathogenesis of rheumatoid arthritis (RA). Citrullination, a type of PTM catalyzed by peptidylarginine deiminases (PAD), promotes inflammatory responses leading to the development of antibodies and T cell responses against citrullinated proteins, with anti-citrullinated protein antibody (ACPA) having up to 98% disease specificity in RA. Beyond citrullination, our laboratory has previously shown that proteins modified with malondialdehyde-acetaldehyde (MAA) acts as a potent antigens and targets of anti-MAA antibodies detected in RA patients. The purpose of this study was to determine whether fibrinogen (FIB) modified with citrulline (FIB-CIT), MAA (FIB-MAA) or both (FIB-MAA-CIT) leads to altered macrophage phenotype, PAD2 expression, and/or the production of citrullinated proteins.
Methods: Protein modifications were performed as described previously (Thiele et al. 2020). Phorbol 12-myristate 13-acetate (PMA)-treated U-937 cells (M0 cells) were stimulated with FIB-CIT, FIB-MAA, or FIB-MAA-CIT. Macrophage (M1/M2) phenotypes were evaluated by RT-PCR and ELISA. For RT-PCR, primers included both M1 markers: CD14, CD192, CX3CR1, and M2 markers: CD163, CD206. For ELISA, IL-1β, IL-18, TNF-α, IP-10, MCP-1, and IL-12p70 were measured as indicators of M1 polarization. M-CSF, CCL22, and IL-13 were measured as indicators of M2 polarization. Also, antigen stimulated M0 cells were evaluated for PAD enzyme expression and protein citrullination using Western Blot. Comparisons of assay data (RT-PCR, ELISA, Western Blot) from cells stimulated with native or modified FIB were performed using one-way ANOVA using Tukey's post-hoc to account for multiple comparisons.
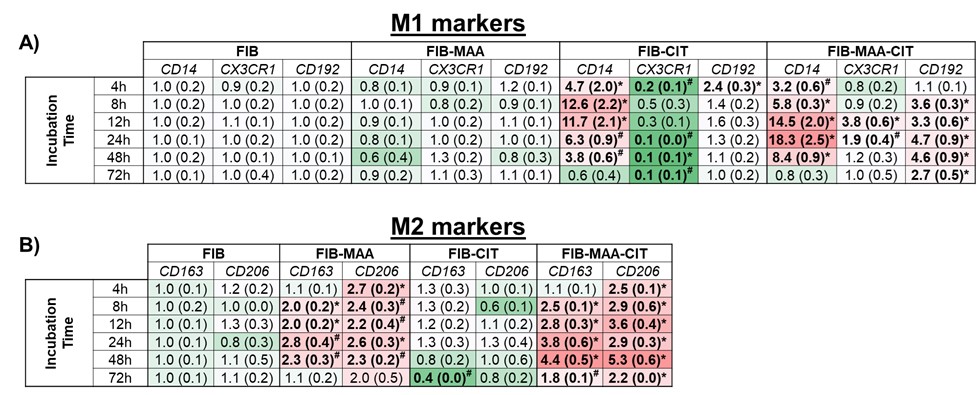
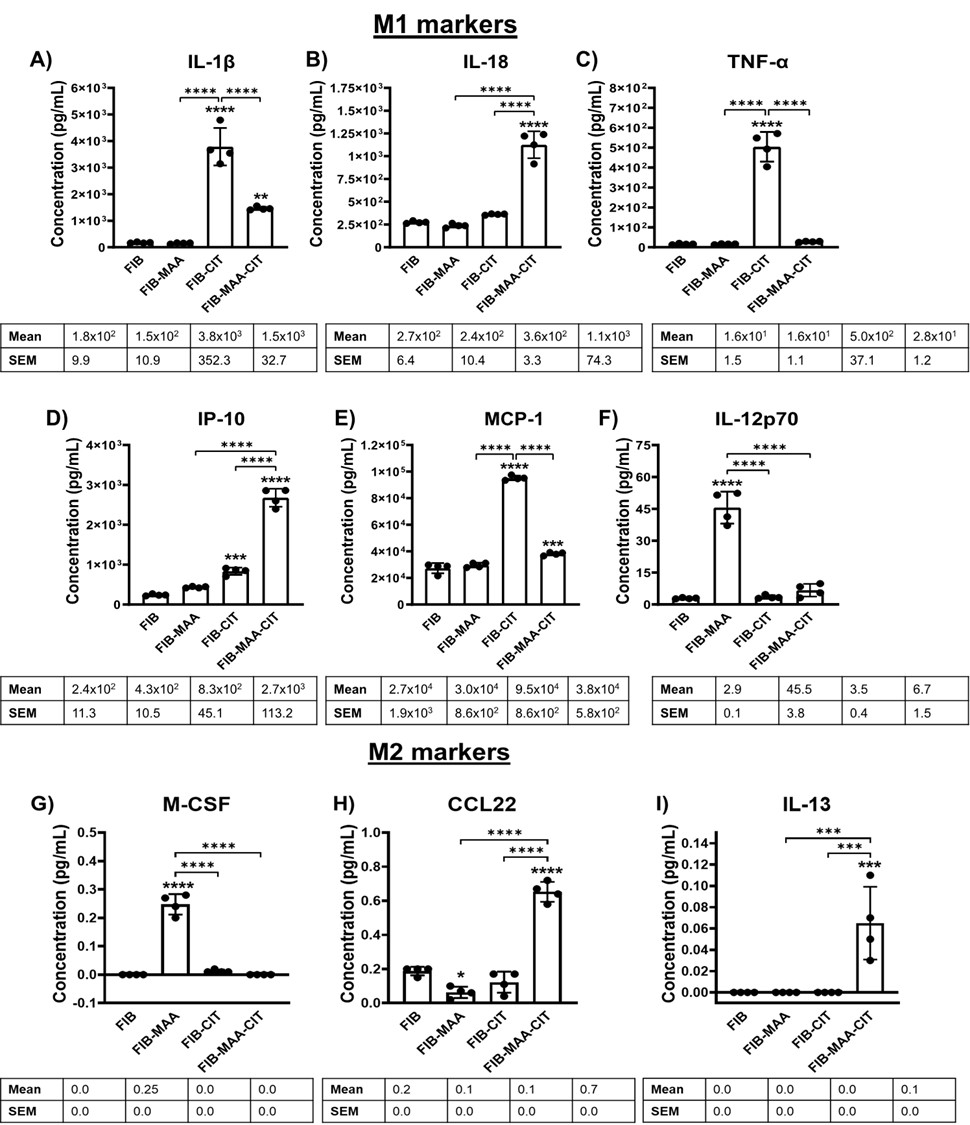
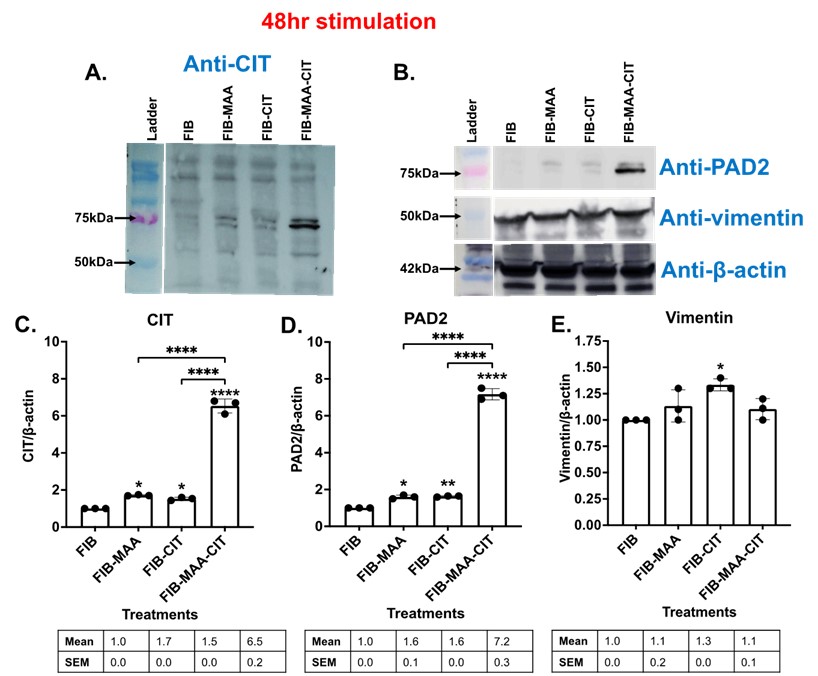
Results: M0 macrophages stimulated with FIB-MAA-CIT resulted in mixed M1/M2 phenotypes as demonstrated by mRNA levels of CD14, CD192, CD163, and CD206 (Fig.1, p< 0.001 vs. others), and the release of IL-1β, IL-18, MCP-1, IP-10, CCL22, and IL-13 (Fig.2, p< 0.001 vs. others). FIB-MAA treated M0 cells also demonstrated a mixed M1/M2 phenotype (IL-12p70 release, Fig.2; and M2 markers expression, Fig.1), but cytokine and cell surface markers differed from FIB-MAA-CIT. Finally, M0 cells treated with FIB-CIT demonstrated markers and cytokines consistent with only the M1-like phenotype. Exposure of M0 cells to FIB-MAA-CIT led to the highest increase of PAD2 protein expression (Fig.3, p< 0.001) and protein citrullination with the most predominant band at 75 kDa, aligning with the molecular weight for PAD2 (Fig.3, p< 0.001).
Conclusion: This study shows that a human monocyte cell line exposed to MAA-modified and/or citrullinated fibrinogen alters its phenotype and function in a modification-specific manner. This suggests a possible interconnection pathway(s) between post-translationally modified proteins, PAD enzyme expression, auto-citrullination, and immunoregulatory mechanism(s). Shifting the balance from a M1 pro-inflammatory response to a M2 pro-fibrotic response, and finally to a mixed M1/M2 response plays a central role in the generation of disease-specific autoimmunity.
 Figure 1. Timed RT-PCR for M1 and M2 markers from stimulated U-937 cells after exposing M0 cells to FIB, FIB-MAA, FIB-CIT, or FIB-MAA-CIT. FIB: fibrinogen, FIB-MAA: fibrinogen-MAA, FIB-CIT: fibrinogen-citrulline, FIB-MAA-CIT: fibrinogen-MAA-citrulline. A) M1 markers and B) M2 markers. The data is represented as a mean (standard deviation) of Relative quantity (Rq) of M1 and M2 markers. Red boxes represent increased mRNA levels, while green boxes represent decreased mRNA levels. All the values are compared to FIB. *p < 0.001, #p < 0.05, n=3.
 Figure 2. M1 and M2 cytokine concentrations by exposure group. from stimulated U-937 cells. FIB: fibrinogen, FIB-MAA: fibrinogen-MAA, FIB-CIT: fibrinogen-citrulline, FIB-MAA-CIT: fibrinogen-MAA-citrulline. The following M1 cytokines were measured: A) IL-1β, B) IL-18, C) TNF-α, D) IFNγ-inducible protein (IP)-10, E) monocyte chemoattractant protein (MCP)-1, F) IL-12p70. The following M2 cytokines were measured: G) macrophage colony-stimulating factor (M-CSF), H) macrophage derived chemokine (CCL22), I) IL-13. The data is represented as a mean of cytokine concentrations (pg/mL) and reported with SEM. Comparisons made to FIB are illustrated above each bar: ****p < 0.0001, ***p < 0.001, **p < 0.01, *p < 0.05, n=4. Tukey’s post-hoc test comparisons are illustrated between treatment groups, and only significant differences are illustrated: ****p < 0.0001, ***p < 0.001, **p < 0.01, *p < 0.05.
 Figure 3. Western Blot for PAD enzyme expression and citrullination from stimulated M0 cells. M0 cells were stimulated with modified fibrinogen antigens for 48 hours. CIT: citrullination, FIB: fibrinogen, FIB-MAA: fibrinogen-MAA, FIB-CIT: fibrinogen-citrulline, FIB-MAA-CIT: fibrinogen-MAA-citrulline, PAD: peptidyl-arginine deiminase. Cell lysates were probed with (A) anti-citrulline, (B) anti-PAD2, anti-vimentin, and anti-β-actin antibodies. Densitometry of normalized values to β-actin of (C) 75 kDa citrullination band for CIT, (D) PAD2, and (E) vimentin. The data is represented as a mean densitometry normalized values and reported with SEM. Comparisons made to FIB are illustrated above each bar: ****p < 0.0001, ***p < 0.001, **p < 0.01, *p < 0.05, n=3. Tukey’s post-hoc test comparisons are illustrated between treatment groups, and only significant differences are illustrated: ****p < 0.0001, ***p < 0.001, **p < 0.01, *p < 0.05.
Disclosures: n. Aripova, None; M. Duryee, None; c. hunter, None; B. England, Boehringer-Ingelheim; D. Romberger, None; J. O'Dell, None; G. Thiele, None; T. Mikuls, Gilead Sciences, Bristol-Myers Squibb, Horizon, Sanofi, Pfizer Inc.
Background/Purpose: Post-translational modifications (PTM) of extracellular matrix proteins, such as fibrinogen, have been implicated in the pathogenesis of rheumatoid arthritis (RA). Citrullination, a type of PTM catalyzed by peptidylarginine deiminases (PAD), promotes inflammatory responses leading to the development of antibodies and T cell responses against citrullinated proteins, with anti-citrullinated protein antibody (ACPA) having up to 98% disease specificity in RA. Beyond citrullination, our laboratory has previously shown that proteins modified with malondialdehyde-acetaldehyde (MAA) acts as a potent antigens and targets of anti-MAA antibodies detected in RA patients. The purpose of this study was to determine whether fibrinogen (FIB) modified with citrulline (FIB-CIT), MAA (FIB-MAA) or both (FIB-MAA-CIT) leads to altered macrophage phenotype, PAD2 expression, and/or the production of citrullinated proteins.
Methods: Protein modifications were performed as described previously (Thiele et al. 2020). Phorbol 12-myristate 13-acetate (PMA)-treated U-937 cells (M0 cells) were stimulated with FIB-CIT, FIB-MAA, or FIB-MAA-CIT. Macrophage (M1/M2) phenotypes were evaluated by RT-PCR and ELISA. For RT-PCR, primers included both M1 markers: CD14, CD192, CX3CR1, and M2 markers: CD163, CD206. For ELISA, IL-1β, IL-18, TNF-α, IP-10, MCP-1, and IL-12p70 were measured as indicators of M1 polarization. M-CSF, CCL22, and IL-13 were measured as indicators of M2 polarization. Also, antigen stimulated M0 cells were evaluated for PAD enzyme expression and protein citrullination using Western Blot. Comparisons of assay data (RT-PCR, ELISA, Western Blot) from cells stimulated with native or modified FIB were performed using one-way ANOVA using Tukey's post-hoc to account for multiple comparisons.
Results: M0 macrophages stimulated with FIB-MAA-CIT resulted in mixed M1/M2 phenotypes as demonstrated by mRNA levels of CD14, CD192, CD163, and CD206 (Fig.1, p< 0.001 vs. others), and the release of IL-1β, IL-18, MCP-1, IP-10, CCL22, and IL-13 (Fig.2, p< 0.001 vs. others). FIB-MAA treated M0 cells also demonstrated a mixed M1/M2 phenotype (IL-12p70 release, Fig.2; and M2 markers expression, Fig.1), but cytokine and cell surface markers differed from FIB-MAA-CIT. Finally, M0 cells treated with FIB-CIT demonstrated markers and cytokines consistent with only the M1-like phenotype. Exposure of M0 cells to FIB-MAA-CIT led to the highest increase of PAD2 protein expression (Fig.3, p< 0.001) and protein citrullination with the most predominant band at 75 kDa, aligning with the molecular weight for PAD2 (Fig.3, p< 0.001).
Conclusion: This study shows that a human monocyte cell line exposed to MAA-modified and/or citrullinated fibrinogen alters its phenotype and function in a modification-specific manner. This suggests a possible interconnection pathway(s) between post-translationally modified proteins, PAD enzyme expression, auto-citrullination, and immunoregulatory mechanism(s). Shifting the balance from a M1 pro-inflammatory response to a M2 pro-fibrotic response, and finally to a mixed M1/M2 response plays a central role in the generation of disease-specific autoimmunity.
 Figure 1. Timed RT-PCR for M1 and M2 markers from stimulated U-937 cells after exposing M0 cells to FIB, FIB-MAA, FIB-CIT, or FIB-MAA-CIT. FIB: fibrinogen, FIB-MAA: fibrinogen-MAA, FIB-CIT: fibrinogen-citrulline, FIB-MAA-CIT: fibrinogen-MAA-citrulline. A) M1 markers and B) M2 markers. The data is represented as a mean (standard deviation) of Relative quantity (Rq) of M1 and M2 markers. Red boxes represent increased mRNA levels, while green boxes represent decreased mRNA levels. All the values are compared to FIB. *p < 0.001, #p < 0.05, n=3.
 Figure 2. M1 and M2 cytokine concentrations by exposure group. from stimulated U-937 cells. FIB: fibrinogen, FIB-MAA: fibrinogen-MAA, FIB-CIT: fibrinogen-citrulline, FIB-MAA-CIT: fibrinogen-MAA-citrulline. The following M1 cytokines were measured: A) IL-1β, B) IL-18, C) TNF-α, D) IFNγ-inducible protein (IP)-10, E) monocyte chemoattractant protein (MCP)-1, F) IL-12p70. The following M2 cytokines were measured: G) macrophage colony-stimulating factor (M-CSF), H) macrophage derived chemokine (CCL22), I) IL-13. The data is represented as a mean of cytokine concentrations (pg/mL) and reported with SEM. Comparisons made to FIB are illustrated above each bar: ****p < 0.0001, ***p < 0.001, **p < 0.01, *p < 0.05, n=4. Tukey’s post-hoc test comparisons are illustrated between treatment groups, and only significant differences are illustrated: ****p < 0.0001, ***p < 0.001, **p < 0.01, *p < 0.05.
 Figure 3. Western Blot for PAD enzyme expression and citrullination from stimulated M0 cells. M0 cells were stimulated with modified fibrinogen antigens for 48 hours. CIT: citrullination, FIB: fibrinogen, FIB-MAA: fibrinogen-MAA, FIB-CIT: fibrinogen-citrulline, FIB-MAA-CIT: fibrinogen-MAA-citrulline, PAD: peptidyl-arginine deiminase. Cell lysates were probed with (A) anti-citrulline, (B) anti-PAD2, anti-vimentin, and anti-β-actin antibodies. Densitometry of normalized values to β-actin of (C) 75 kDa citrullination band for CIT, (D) PAD2, and (E) vimentin. The data is represented as a mean densitometry normalized values and reported with SEM. Comparisons made to FIB are illustrated above each bar: ****p < 0.0001, ***p < 0.001, **p < 0.01, *p < 0.05, n=3. Tukey’s post-hoc test comparisons are illustrated between treatment groups, and only significant differences are illustrated: ****p < 0.0001, ***p < 0.001, **p < 0.01, *p < 0.05.
Disclosures: n. Aripova, None; M. Duryee, None; c. hunter, None; B. England, Boehringer-Ingelheim; D. Romberger, None; J. O'Dell, None; G. Thiele, None; T. Mikuls, Gilead Sciences, Bristol-Myers Squibb, Horizon, Sanofi, Pfizer Inc.

