
Poster Session D
Thomas Renson, MD, PhD
University of Calgary
Calgary, AB, Canada
 Table 1: Upper panel: Significant differences in MIS-C features of patients presenting during the first phase of the COVID-19 pandemic (first and second wave combined) compared to those presenting during the second phase (third and fourth wave combined) (*one missing value). Lower panel: Significant differences regarding MIS-C features between patients admitted to the intensive care unit compared to those managed on the general ward.
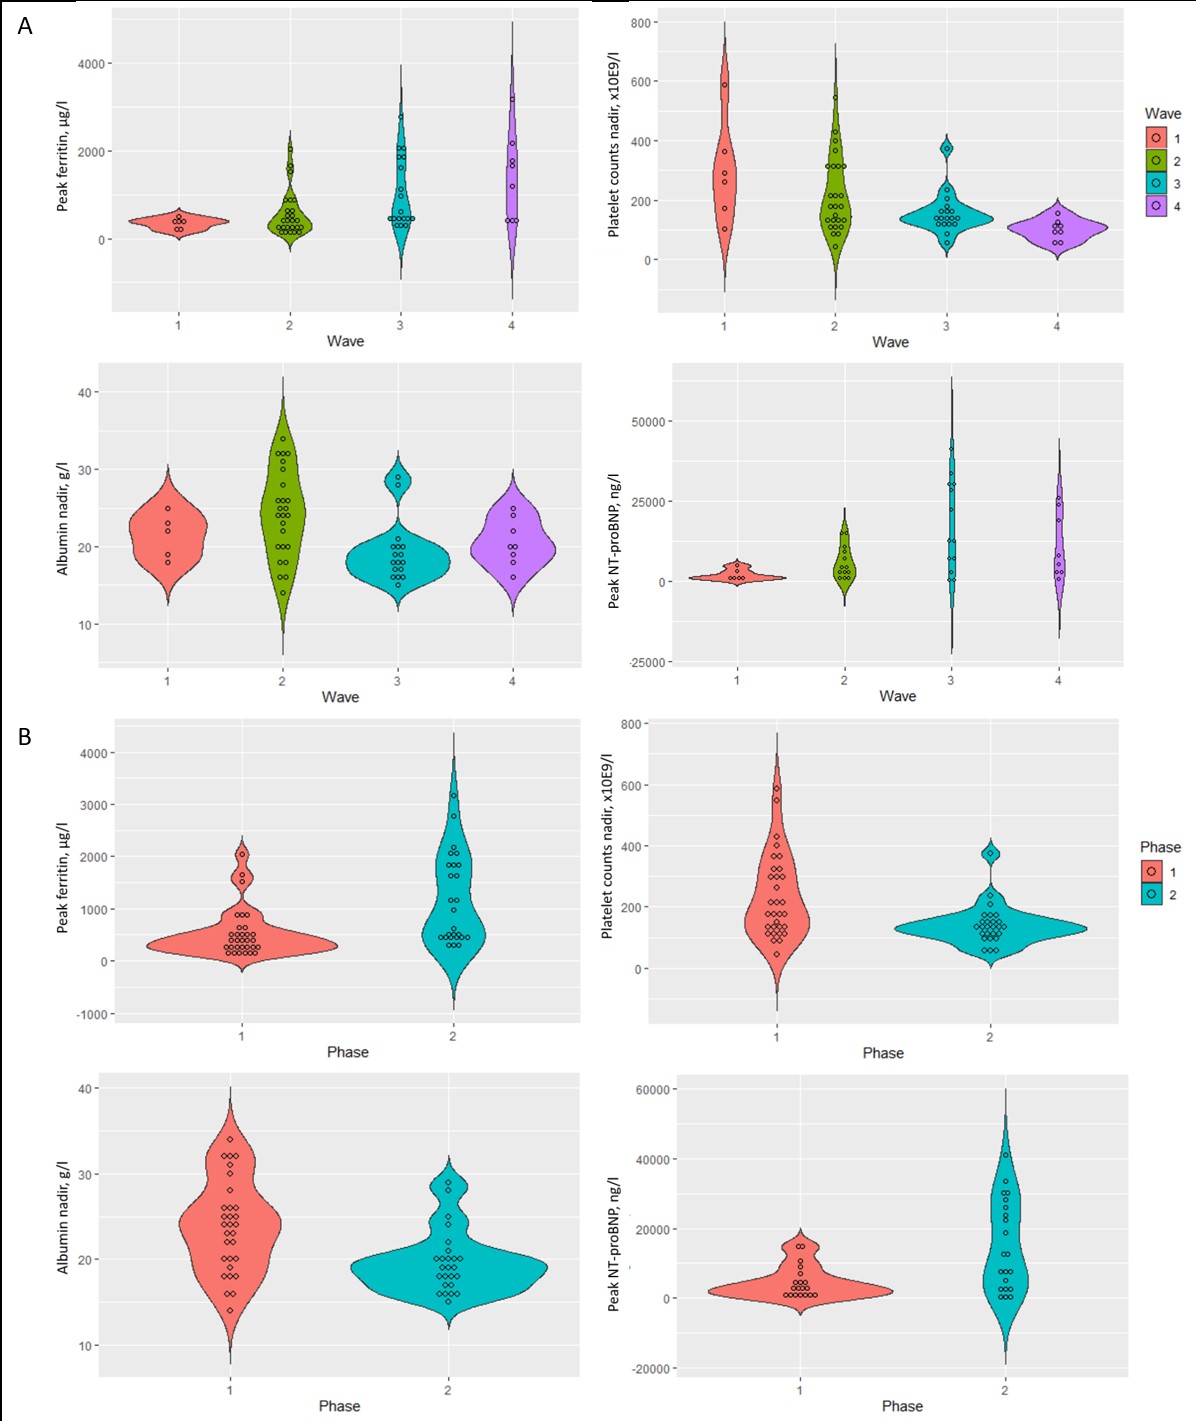 Figure 1: Violin plots depicting differences in key laboratory MIS-C features between the four waves (panel A) and both phases (phase one is wave one and two combined, phase two is wave three and four combined; panel B) of the COVID-19 pandemic: peak ferritin values, platelet counts nadir, albumin nadir values, and peak NT-proBNP values.
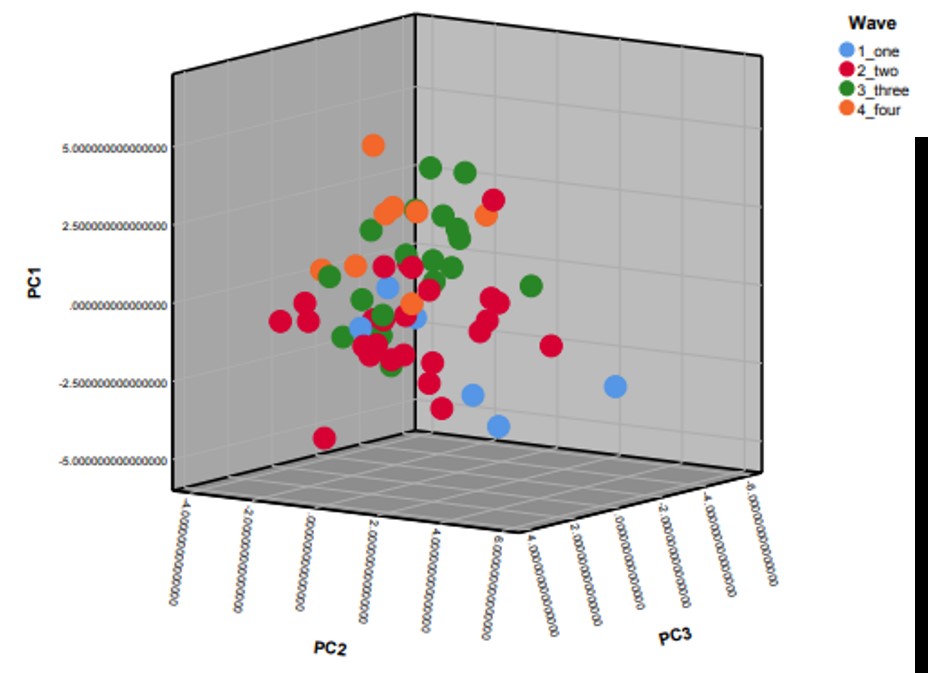 Figure 2: Three-dimensional plot of the first three principal components (PC1, PC2, PC3) resulting from principal component analysis explaining about 30% of the variance in the data. A clustering of MIS-C patients from the first and second wave, and from the third and fourth wave can be observed.