
Poster Session D
Andreas Kerschbaumer, MD
Medical University of Vienna
Vienna, Austria
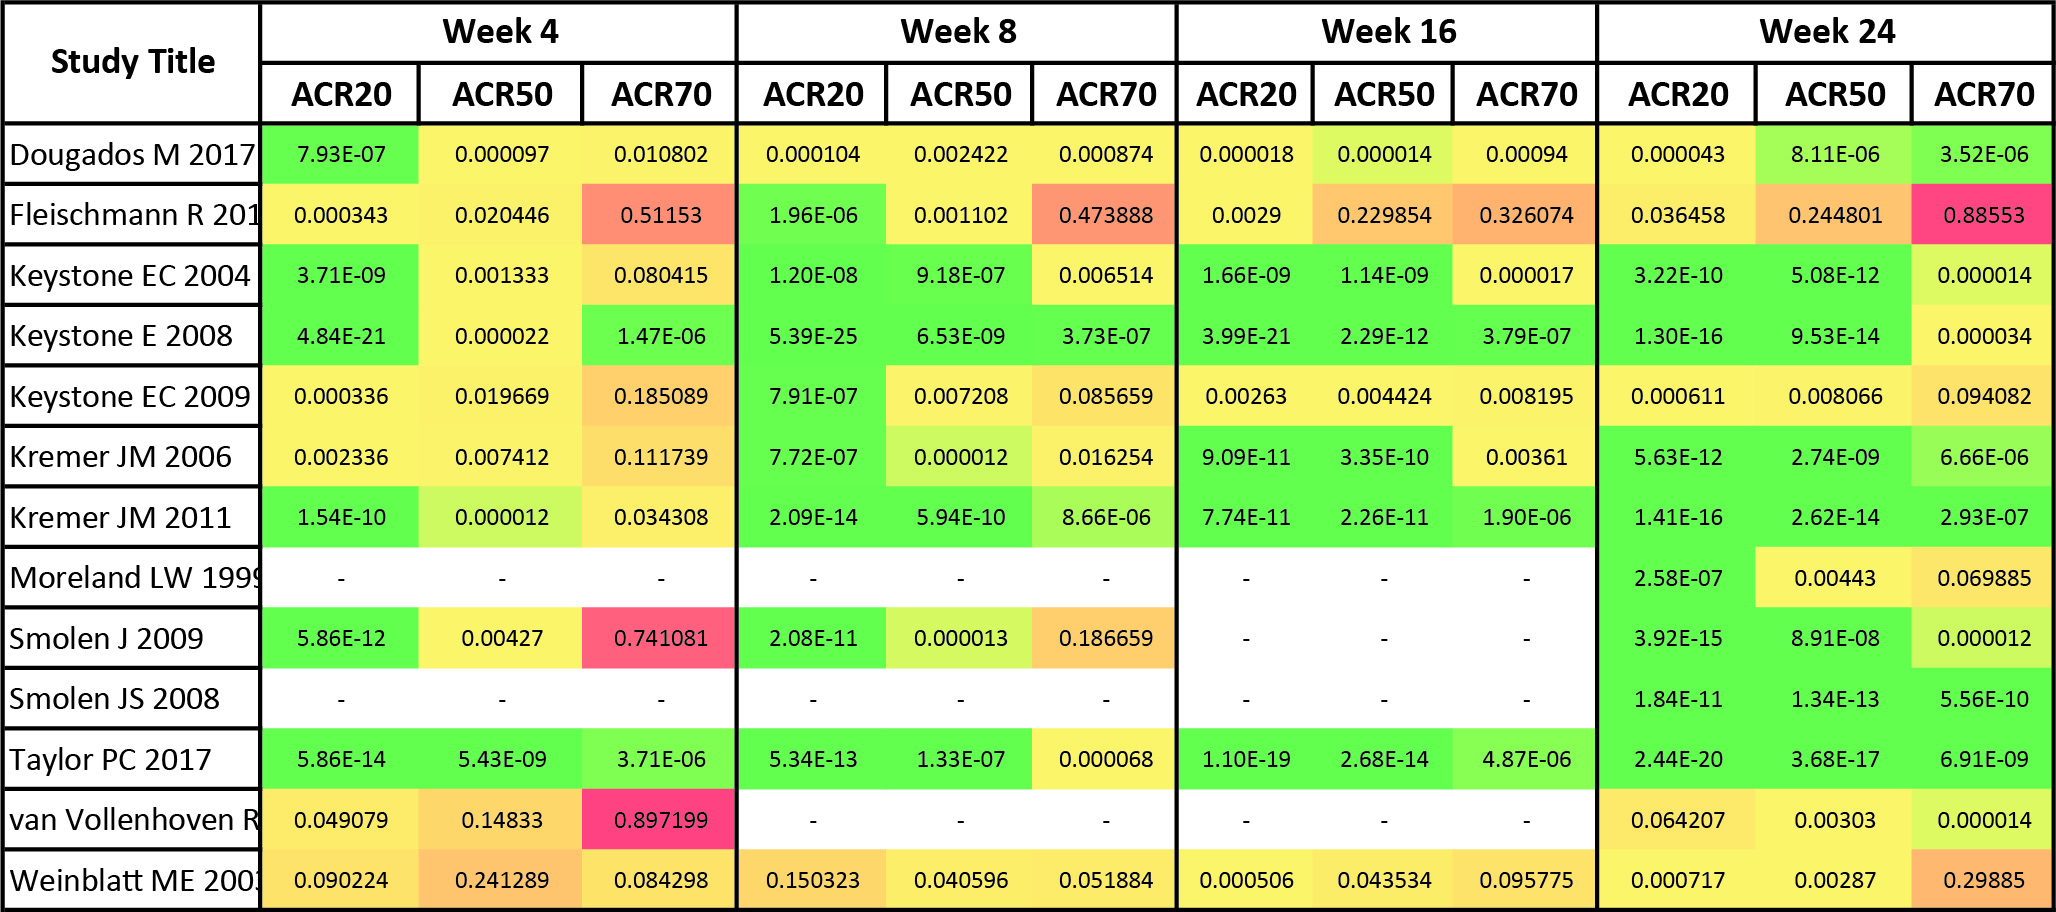 Table 1: CMH statistics comparing active treatments vs. placebo per trial and timepoint for each ACR outcome. The color coding refers to the magnitude of the respective p-value.
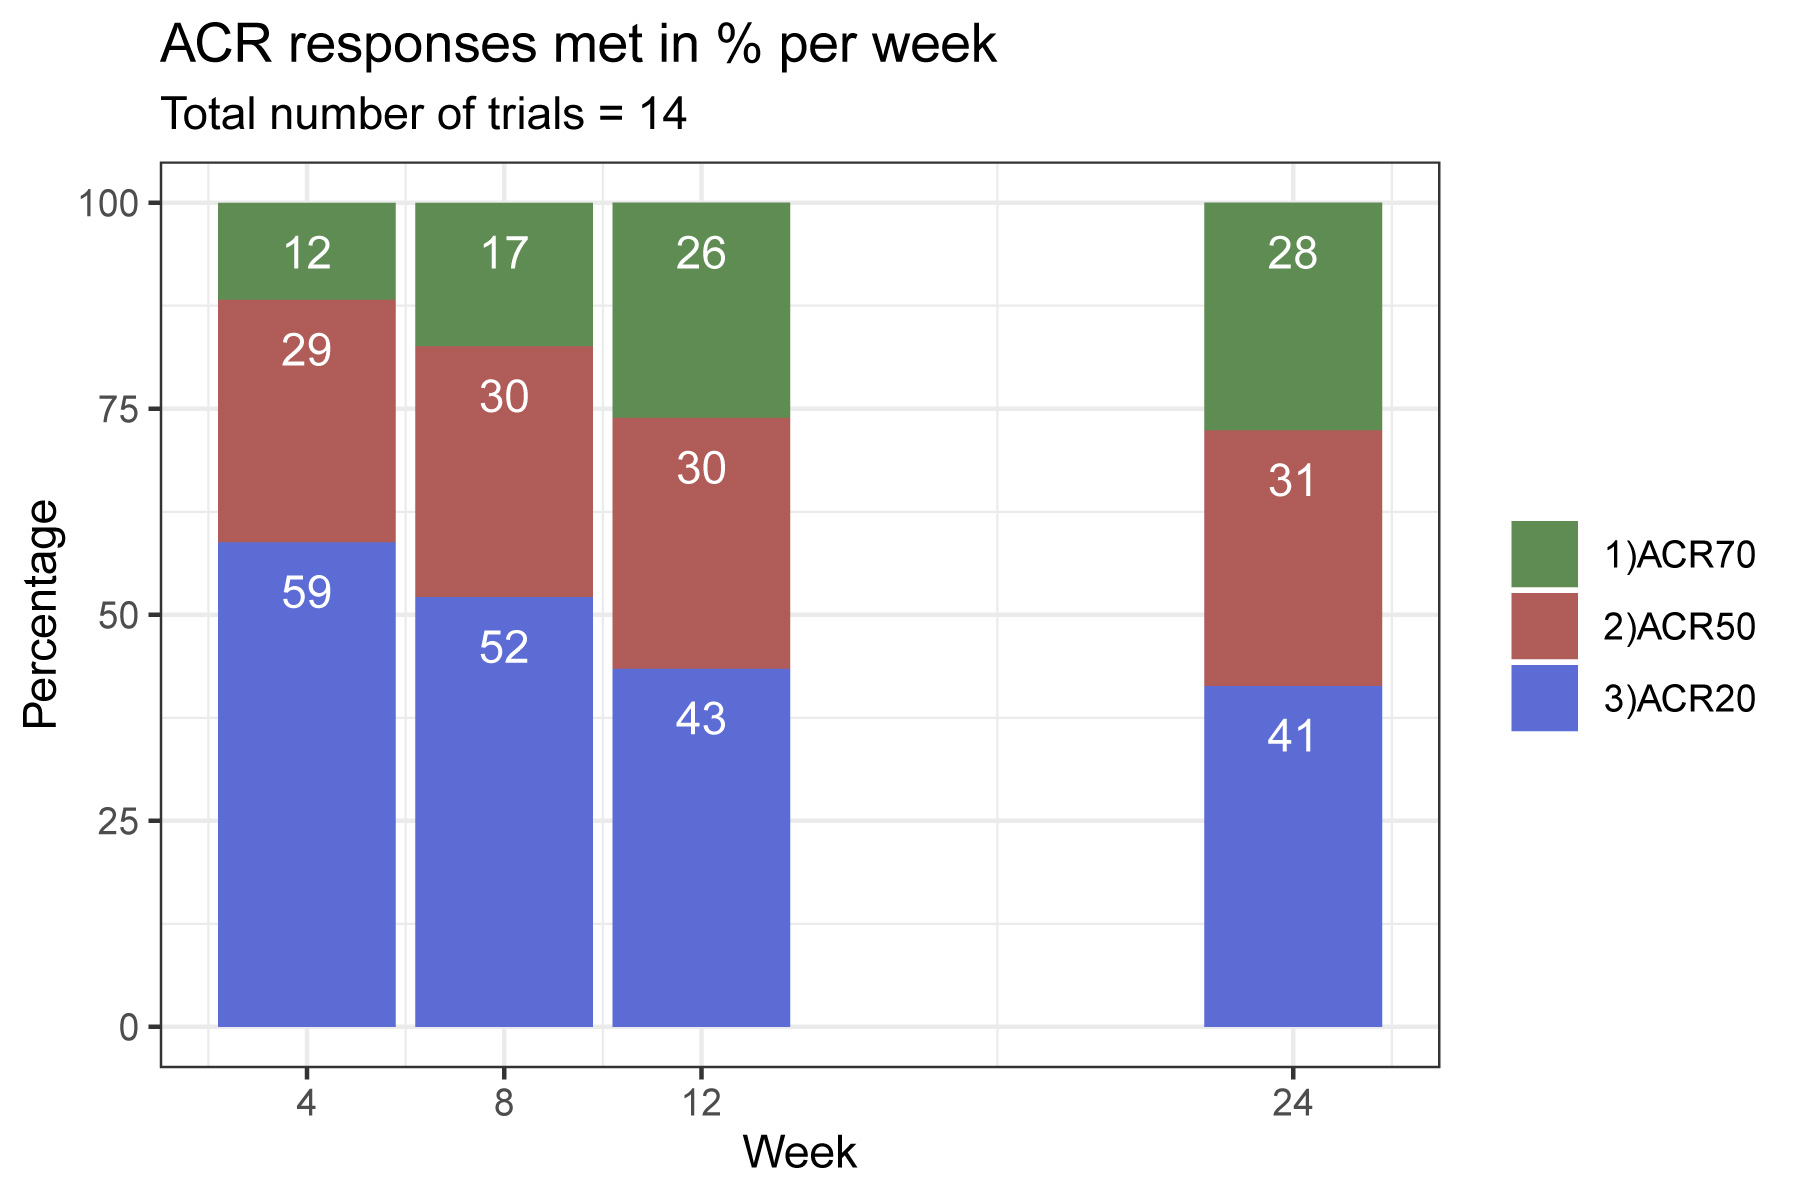 Figure 1: Stacked barcharts showing percent of trials with significant results of active treatment vs. placebo (p < 0.05) using the Cochran-Mantel-Haenszel statistic for ACR 20, 50 and 70% response rates per timepoint.
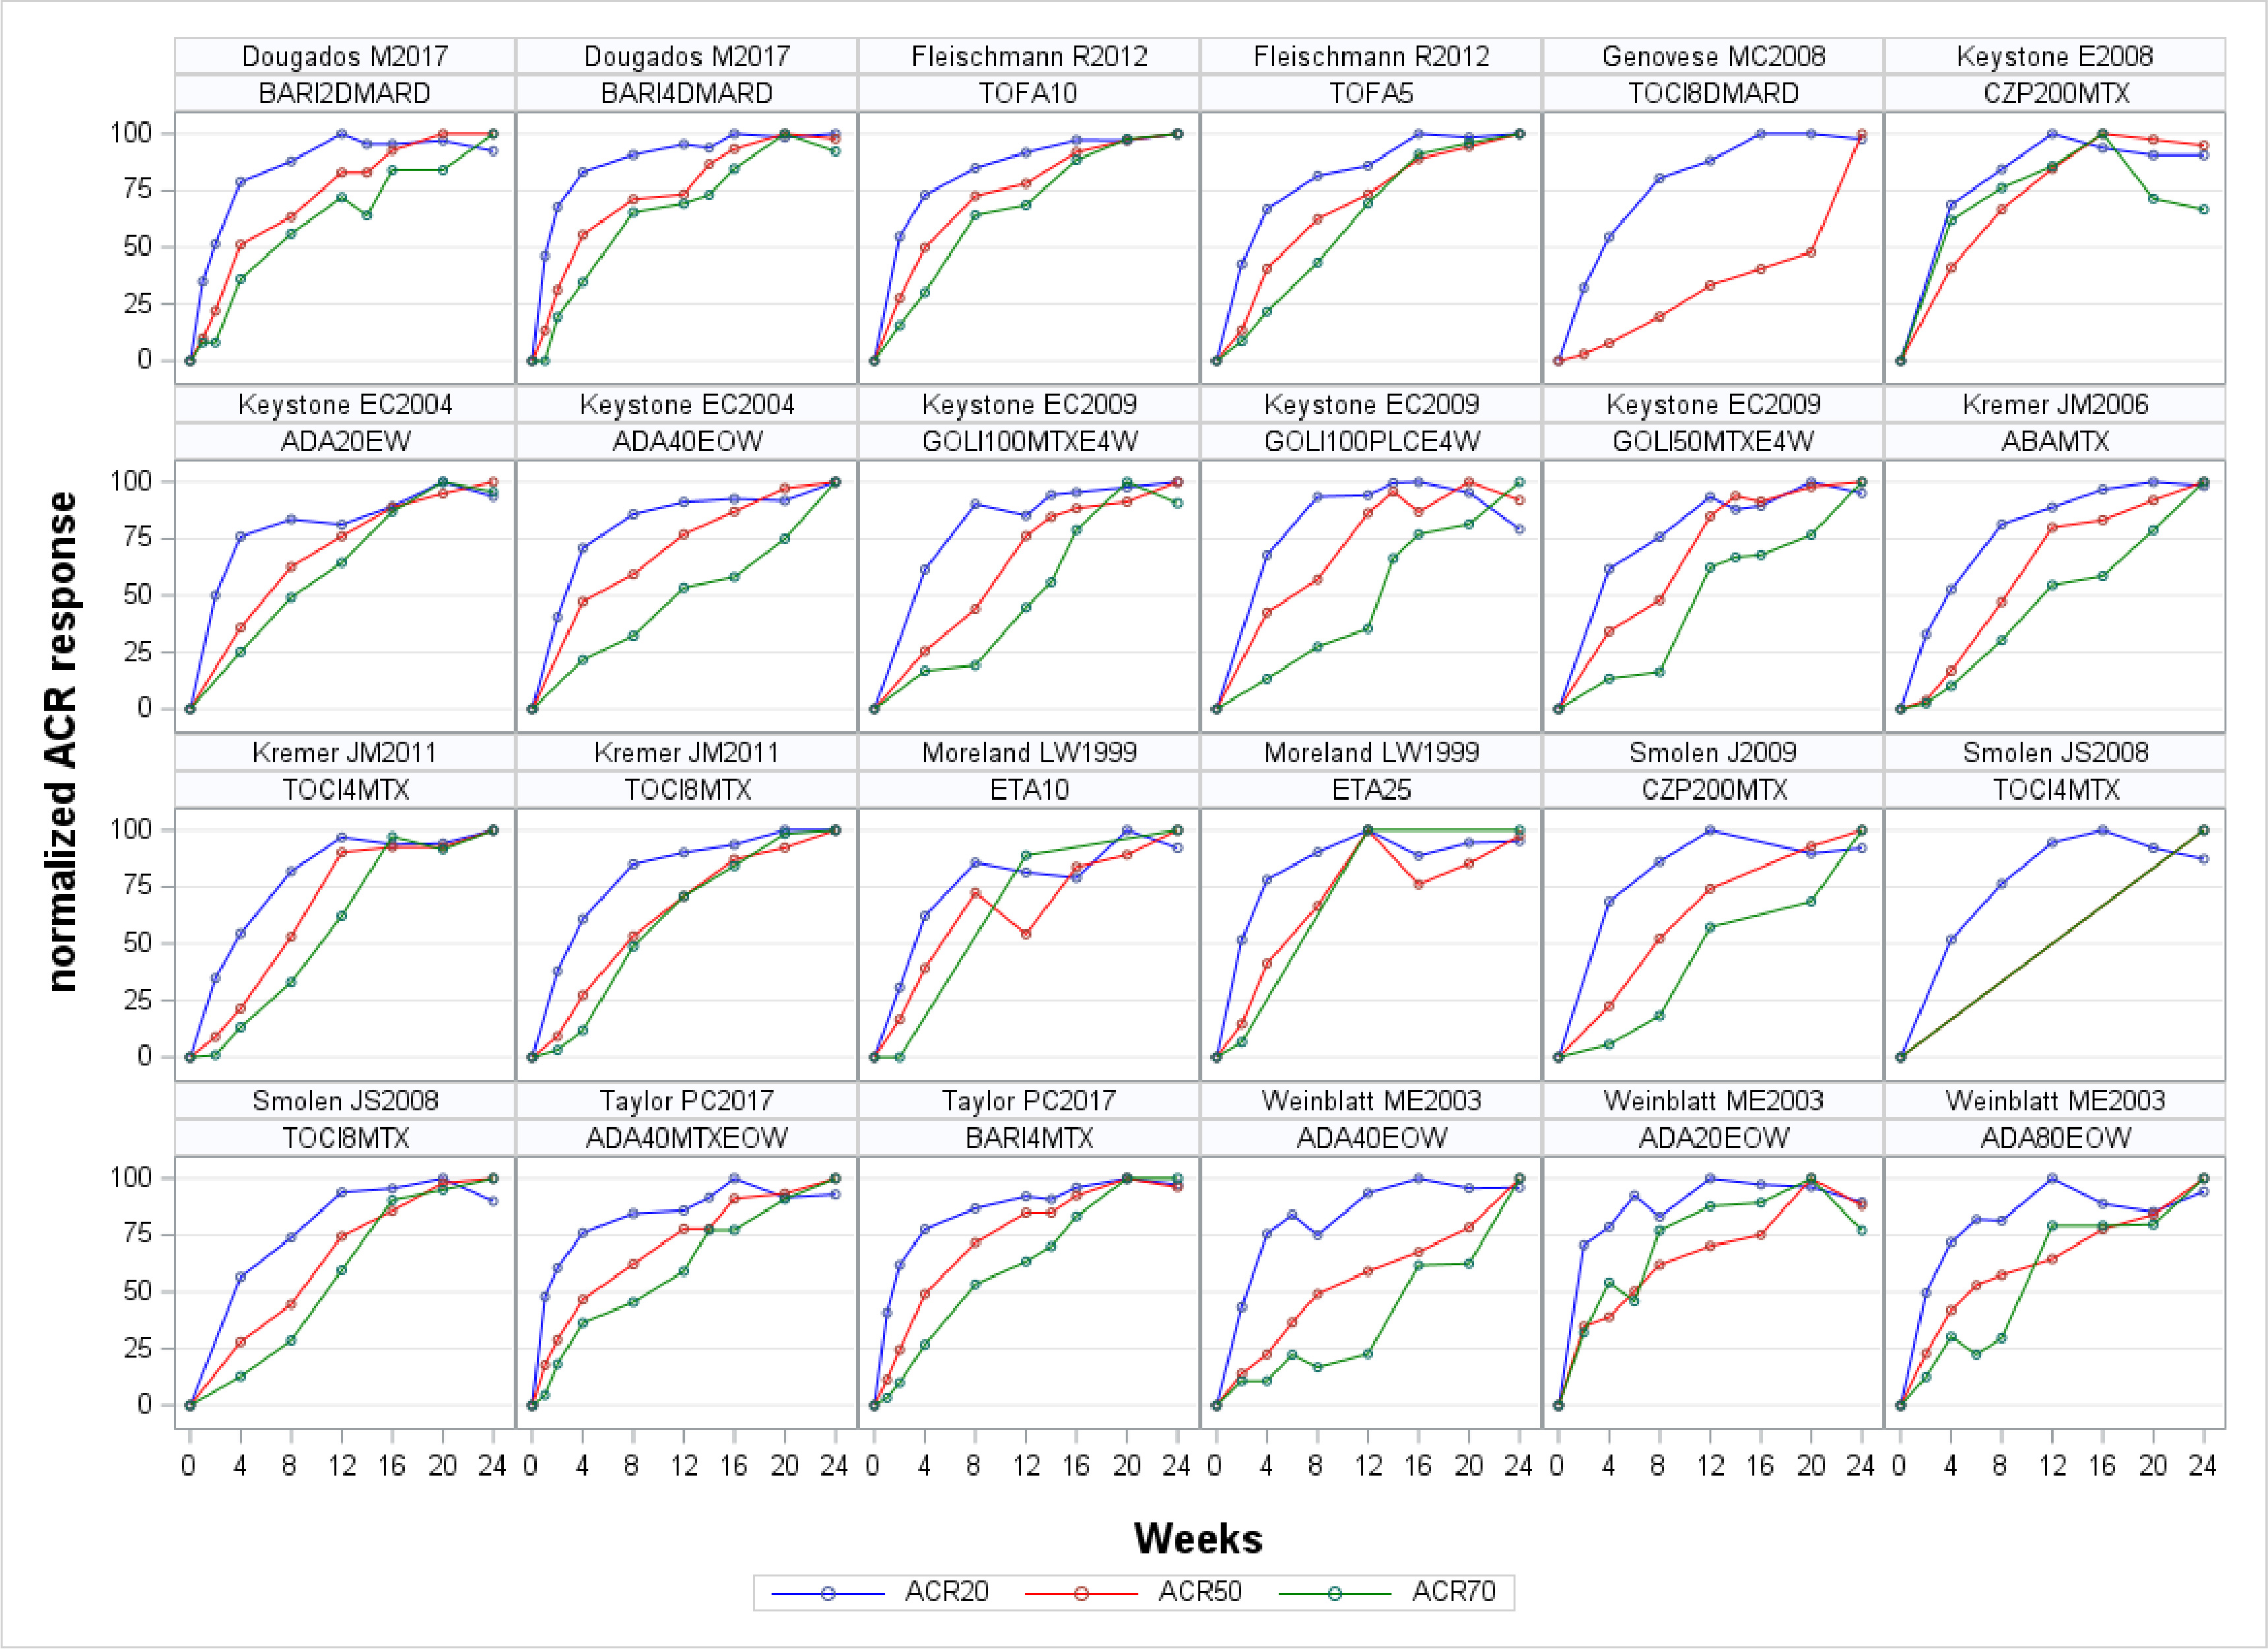 Figure 2: Normalized ACR responses (normalized to the maximum response within each threshold) shown separately for each trial analysed.