
Abstract Session
Hu Zeng, PhD
Mayo Clinic
Rochester, MN, United States
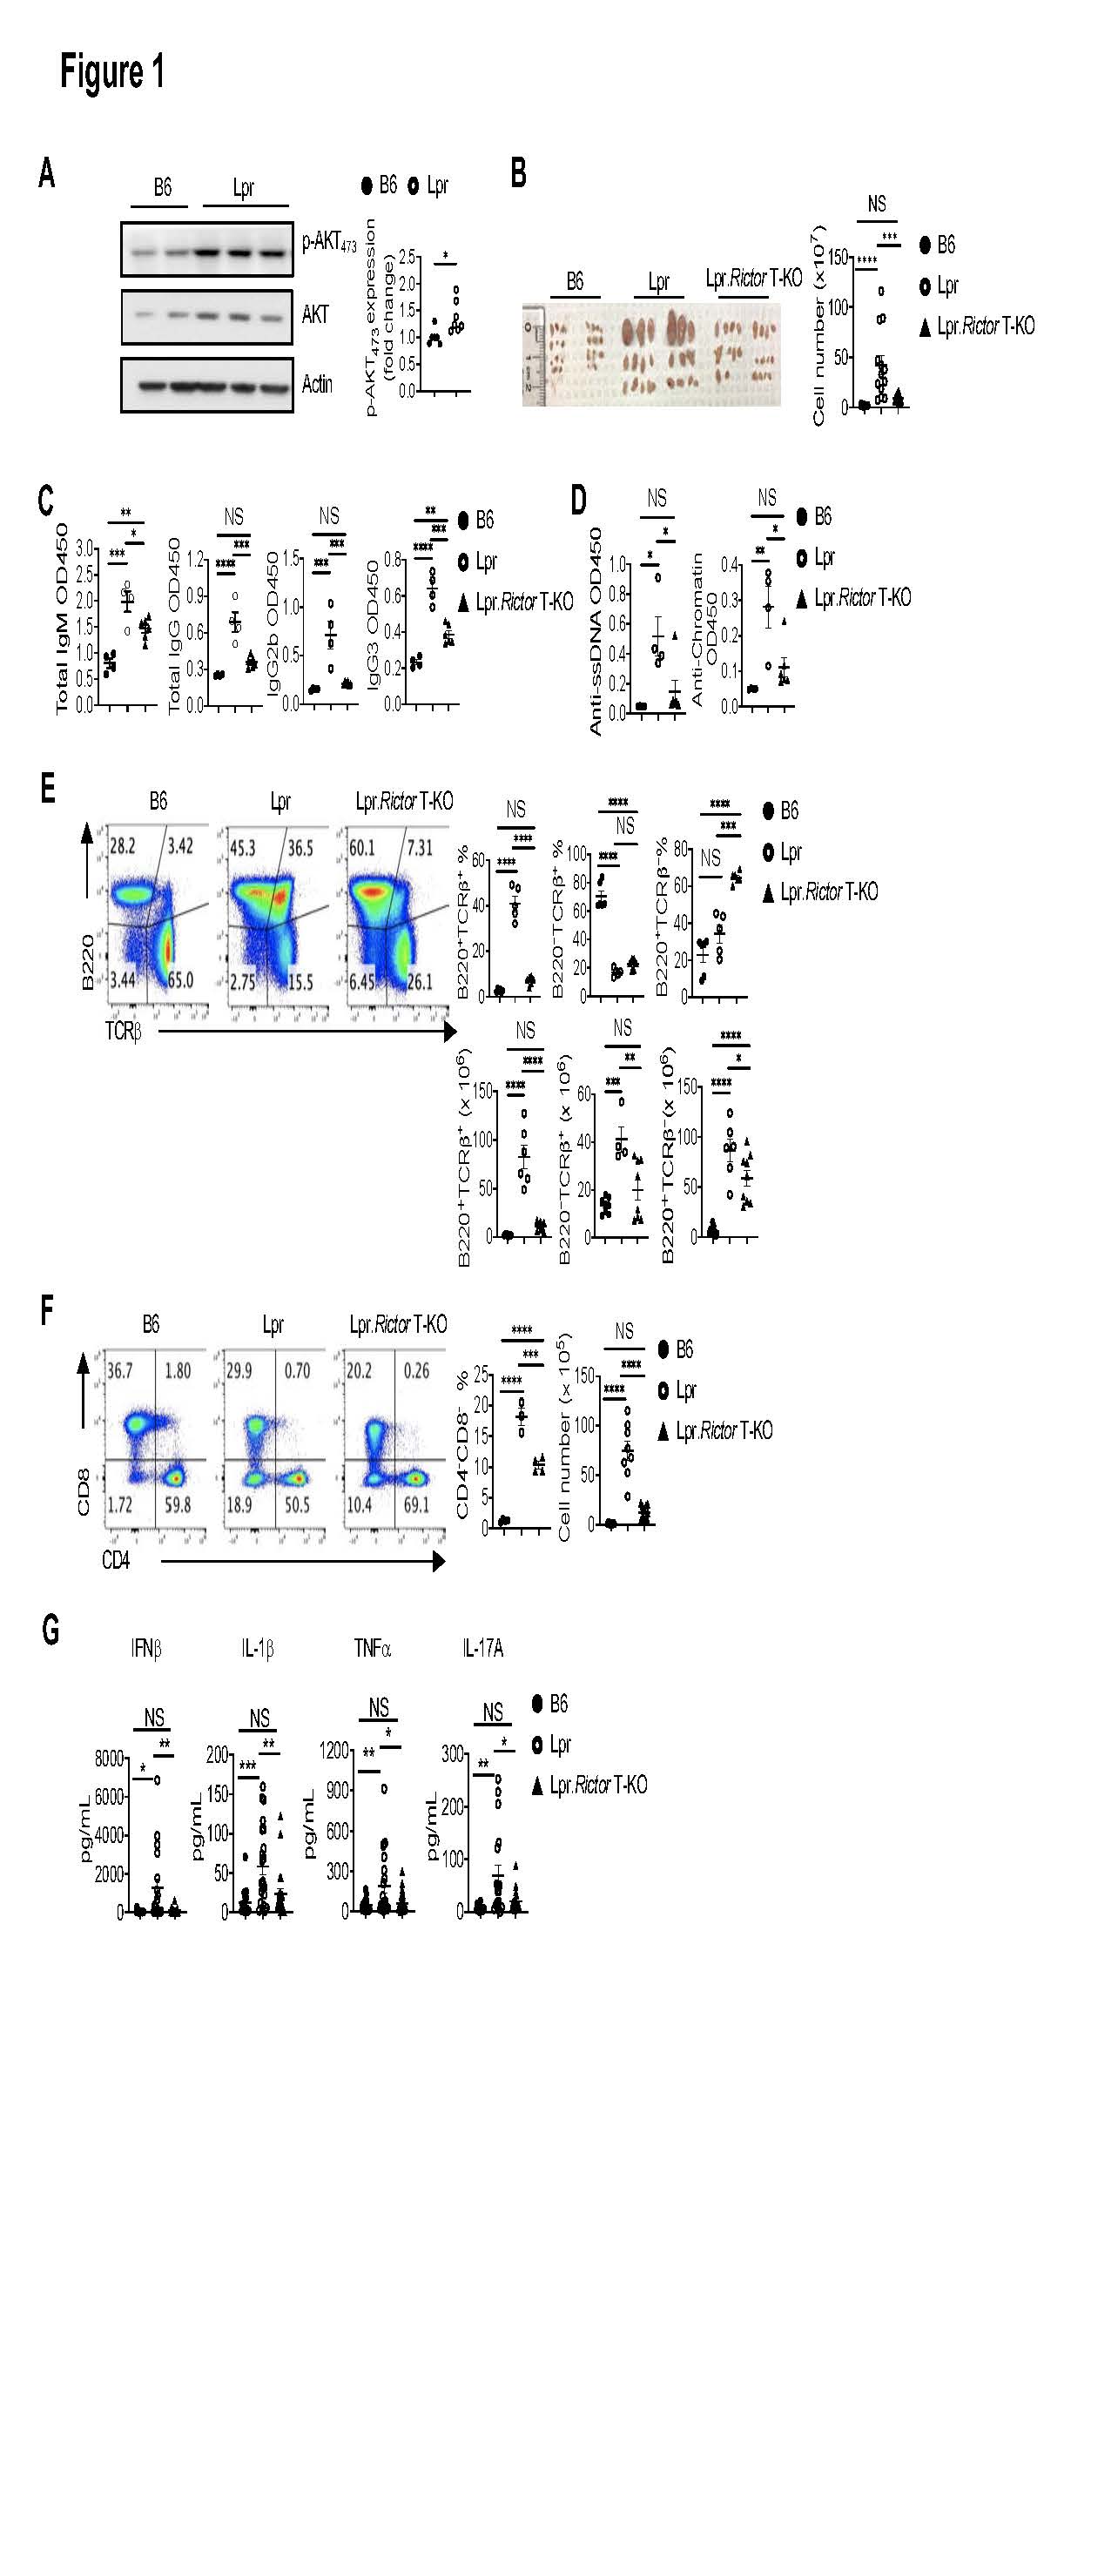 Figure 1. Rictor deletion in T cells rectifies immunopathology in Lpr mice. (A) Immunoblot analysis of p-AKT473 in B6 and Lpr CD4+ T cells isolated from peripheral lymph nodes (pLN). Right, summary of the relative p-AKT473 expression (normalized to that in B6 CD4+ T cells). (B) Image of peripheral lymph nodes taken from 6 months old B6, Lpr and Lpr.Rictor T-KO mice. Right, summary of total cellularity of lymph nodes. (C) Titers of total immunoglobulin (Ig) M, IgG, IgG2b and IgG3 were measured by ELISA. (D) Titers of anti-ssDNA (left) and anti-chromatin (right) were measured by ELISA. Samples were from 9 months old B6, Lpr and Lpr.Rictor T-KO mice. (E) Expression of B220 and TCRon lymphocytes. Right, the frequencies (upper panels) and absolute numbers (lower panels) of B220+TCR+, B220–TCR+, B220+TCR– cells. (F) Flow cytometry analysis of CD4 and CD8 T cells among B220–TCR+ cells. Right, the frequency (left) and absolute number (right) of CD4–CD8– T cell population. (E) and (F) Cells were from peripheral lymph nodes (pLN) of 6 months old B6, Lpr and Lpr.Rictor T-KO mice. (G) The inflammatory cytokine levels in mouse sera samples collected from 5-6 months old B6, Lpr and Lpr.Rictor T-KO mice. NS, not significant; * P < 0.05, ** P < 0.01, *** P < 0.001, **** P < 0.0001. p values were calculated with one-way ANOVA. Results were presentative of 3 (A) independent experiment and pooled from at least 3 (A-G) independent experiments. Error bars represent SEM.
 Figure 2. Rictor deletion in Treg is unable to restore immune dysregulation in Lpr mice. (A) Frequency of FOXP3+ Treg cells in splenic CD4+ T cells. (B) Image of peripheral lymph nodes taken from 6 months old B6, Lpr, Lpr.Rictor T-KO mice and Lpr.Rictor Treg-KO. Right, summary of total cellularity of lymph nodes. (C) Frequency of B220+TCR+ cells in pLN among B6, Lpr, Lpr.Rictor T-KO mice and Lpr.Rictor Treg-KO. (D) Frequencies of pre-Tfh (BCL6 –CXCR5+) and Tfh (BCL6 +CXCR5+) cells in pLN. (E) Frequency of GC B cells. (F) The ratio between Tfh and Treg frequency in CD4+ T cells from B6, Lpr, Lpr.Rictor T-KO and Lpr.Rictor Treg-KO mice. (G) Serum concentrations of immunoglobulin IgG1, IgG2a, and IgG2b were measured by LEGENDplex. NS, not significant; * P < 0.05, ** P < 0.01, *** P < 0.001, **** P < 0.0001 (one-way ANOVA). Results were pooled from at least 3 (A-G) independent experiments. Error bars represent SEM.
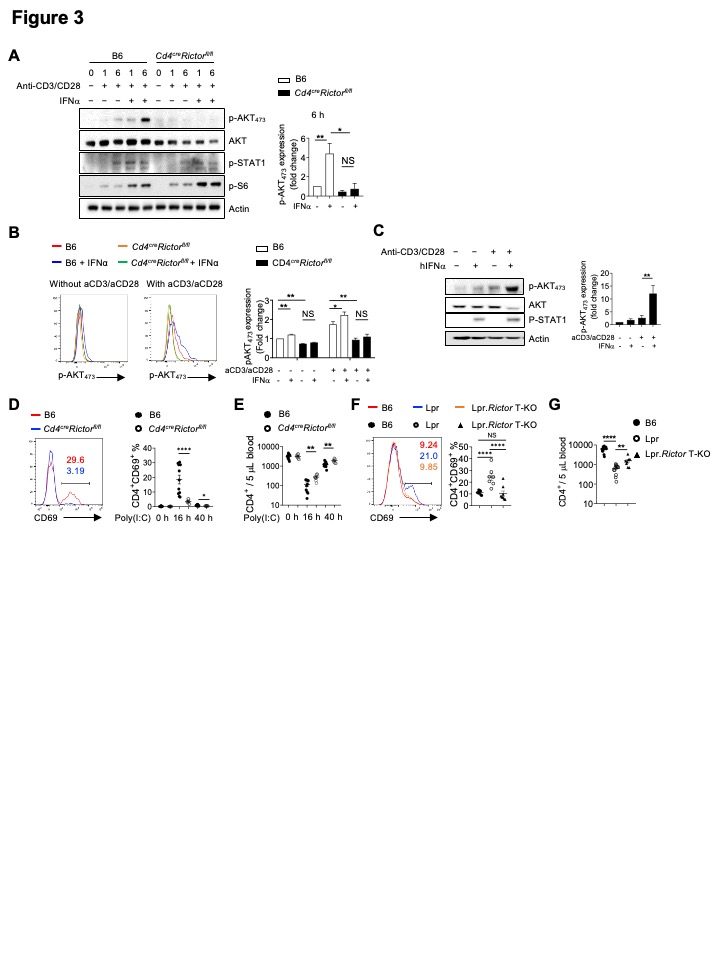 Figure 3. Type I IFN synergizes with TCR to promote CD69 expression and suppress T cell egress. (A) Immunoblot analysis of p-AKT473, AKT (pan), p-STAT1 and p-S6 in CD4+ T cells from B6 and Cd4creRictorfl/fl mice stimulated with or without anti-CD3/anti-CD28 in the presence or absence of IFNα for 1 and 6 hours. Right, summaries of the relative p-AKT473 expression (normalized to total AKT and then compared with baseline B6 CD4+ T cells) stimulated for 6 hours. (B) Flow cytometry analysis of p-AKT473 expression in CD4+ T cells treated with IFNα alone, or in combination with anti-CD3/anti-CD28 overnight. Right, summary of the relative pAKT473 expression (normalized to that in B6 CD4+ T cells without any stimulation). (C) Immunoblot analysis of p-AKT473, AKT (pan), and p-STAT1 in human CD4+ T cells with or without anti-CD3/anti-CD28 activation in presence or absence of human IFN for 3 hours. Right, summary of the relative p-AKT473 expression normalized to total AKT and then compared with baseline. (D) and (E) B6 and Cd4creRictorfl/fl mice were administered with poly(I:C) intraperitoneally. (D) Expression of CD69 in blood CD4+ T cells from B6 and Cd4creRictorfl/fl mice after poly(I:C) administration. Numbers indicate the percentages of CD69+CD4+ T cells. Right, summary of CD69+ percentage in CD4+ T cells at baseline or treated with poly(I:C) for 16 h and 40 h. (E) Blood CD4+ T cell counts were determined before and after poly(I:C) treatment. (F) Expression of CD69 in CD4+ T cells from B6, Lpr and Lpr.Rictor T-KO mice. Right, summary of CD69+ percentages among pLN CD4+ T cells. (G) Blood CD4+ T cell counts were determined in 4-6 months old B6, Lpr and Lpr.Rictor T-KO mice. NS, not significant; * P < 0.05, ** P < 0.01, *** P < 0.001, **** P < 0.0001 (A, B, D and E, unpaired Student’s t test, C, F and G, one-way ANOVA). Results were presentative of 4 (A, C), or pooled from at least 3 (A-G) independent experiments. Error bars represent SEM.