
Abstract Session

H. Mark Kenney, Jr, PhD
University of Rochester School of Medicine and Dentistry
Henrietta, NY, United States
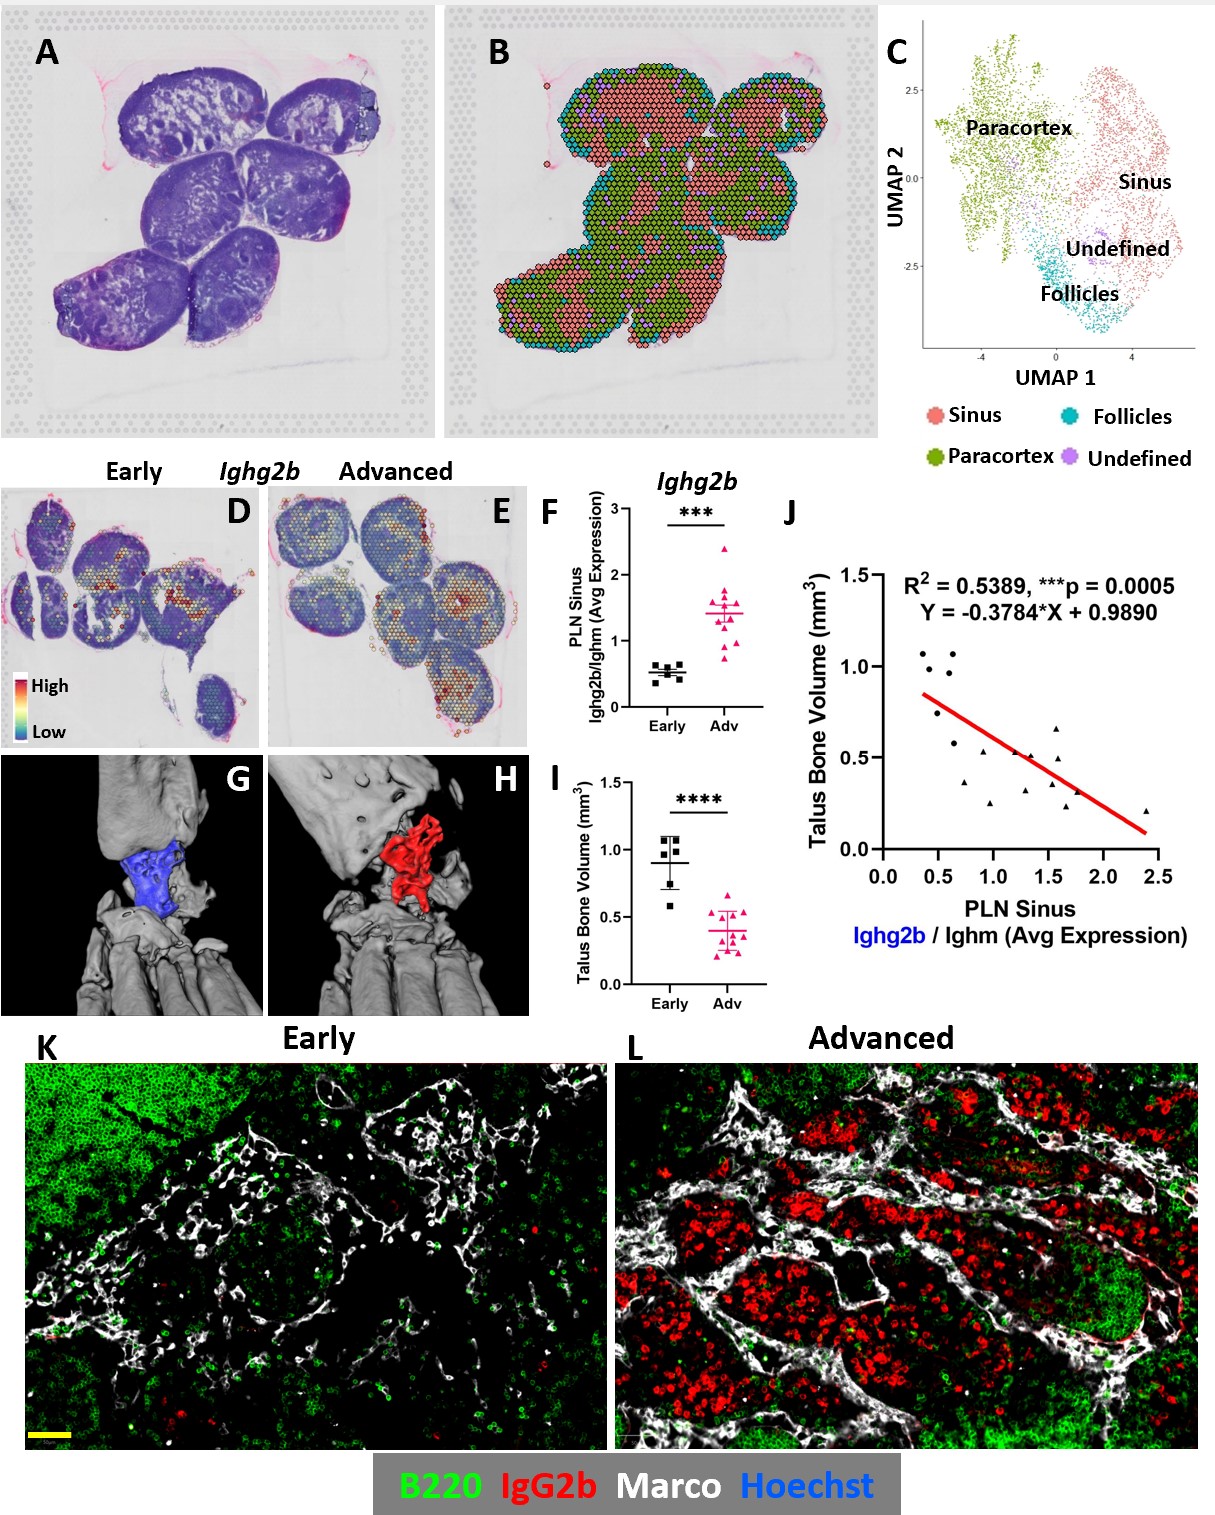 Figure 1. Increased IgG2b expression in PLN sinuses correlates with reduced bone volume in the afferent ankle joint. PLNs from TNF-Tg mice were harvested and processed for spatial transcriptomics. A representative H&E-stained image (A) corresponds to a transcriptional representation (B) of the PLNs from an Advanced capture area where the sinus regions are shown by red spots (C). Differential gene expression of Ighg2b (IgG2b) within the sinus regions are shown by a spatial feature plot overlying the H&E-stained PLNs from Early (D) and Advanced (E) groups with a significant increase in Ighg2b/Ighm expression in Advanced sinuses (p < 0.001) (F). Ex-vivo micro-CT was performed on the hindpaws of TNF-Tg mice with Early (G) and Advanced (H) arthritis with a significant reduction in talus bone volumes in Advanced TNF-Tg mice (p < 0.0001) (I). Linear regression analysis demonstrated negative correlation between PLN sinus Ighg2b expression and talus bone volumes in the afferent ankles (R2 = 0.54, p < 0.001) (J). The increase in IgG2b+ cells in Advanced vs Early TNF-Tg PLNs was validated by immunofluorescence. IgG2b+ cells are limited in Early PLNs (K), while Advanced arthritis is associated with a dramatic accumulation of IgG2b+ (red) / B220- (green) plasma cells localized to the Marco+ (white) PLN peri-follicular medullary sinuses (L). Statistics: Unpaired t-test (F, I); linear regression (J); ***p < 0.001, ****p < 0.0001. Scale bar (yellow) = 50μm (K, L).
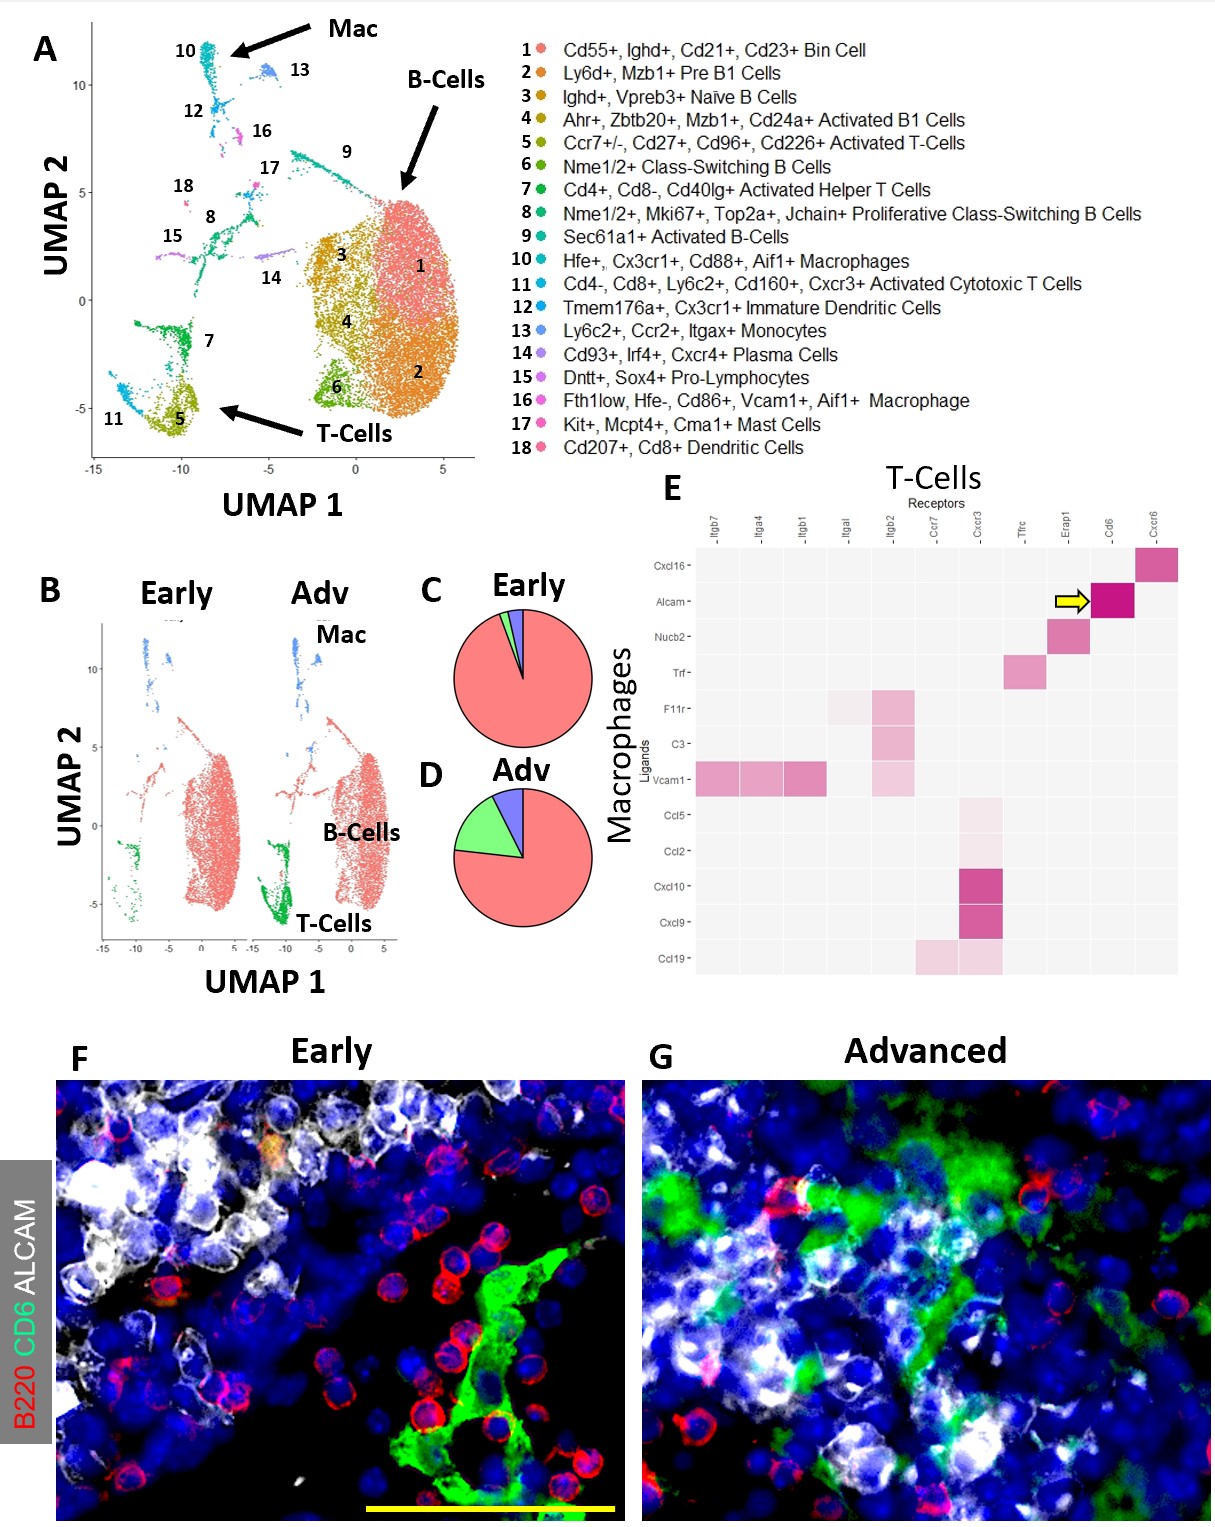 Figure 2. Increased IgG2b+ plasma cells in Advanced PLNs with predicted Alcam+ macrophage and CD6+ T-cell co-stimulation. Single-cell suspensions were collected from Early and Advanced TNF-Tg PLNs (n=3 mice, 6 PLNs pooled/group), flow sorted for Hoechst+ / Sytox- live cells, and processed for scRNAseq. Following integration of the Early (8192 cells) and Advanced (8136 cells) samples, unsupervised clustering in Seurat resolved 18 distinct cell clusters (A), representing subtypes of B-cells, T-cells, and macrophages (B). Comparison of Early vs Advanced PLNs demonstrated a substantial increase in the number of T-cells (green; Early 2.0% (C) vs Adv 15.8% (D)). A remarkable increase was also noted in the proportion of macrophages in Advanced PLNs (3.6% Early (C) vs 7.4% Advanced (D)). Note the color of the pie chart matching the color of unique cell clusters in the UMAP shown in B. To elucidate potential T-cell / macrophage co-stimulatory pathways in Advanced PLNs, cell interaction analysis (NicheNet / Seurat) was performed, which indicated high interaction potential between Alcam (macrophages, ligand) and CD6 (T-cells, receptor) (E, yellow arrow). PLN immunohistochemistry further demonstrated a notable physical separation between Alcam+ and CD6+ cells in the Early condition (F), while these cells were found interacting in close proximity within Advanced PLNs (G). Scale bar (yellow) = 50μm (F, G).