
Abstract Session
Robert Robl, MD
AMPEL BioSolutions
Charlottesville, VA, United States
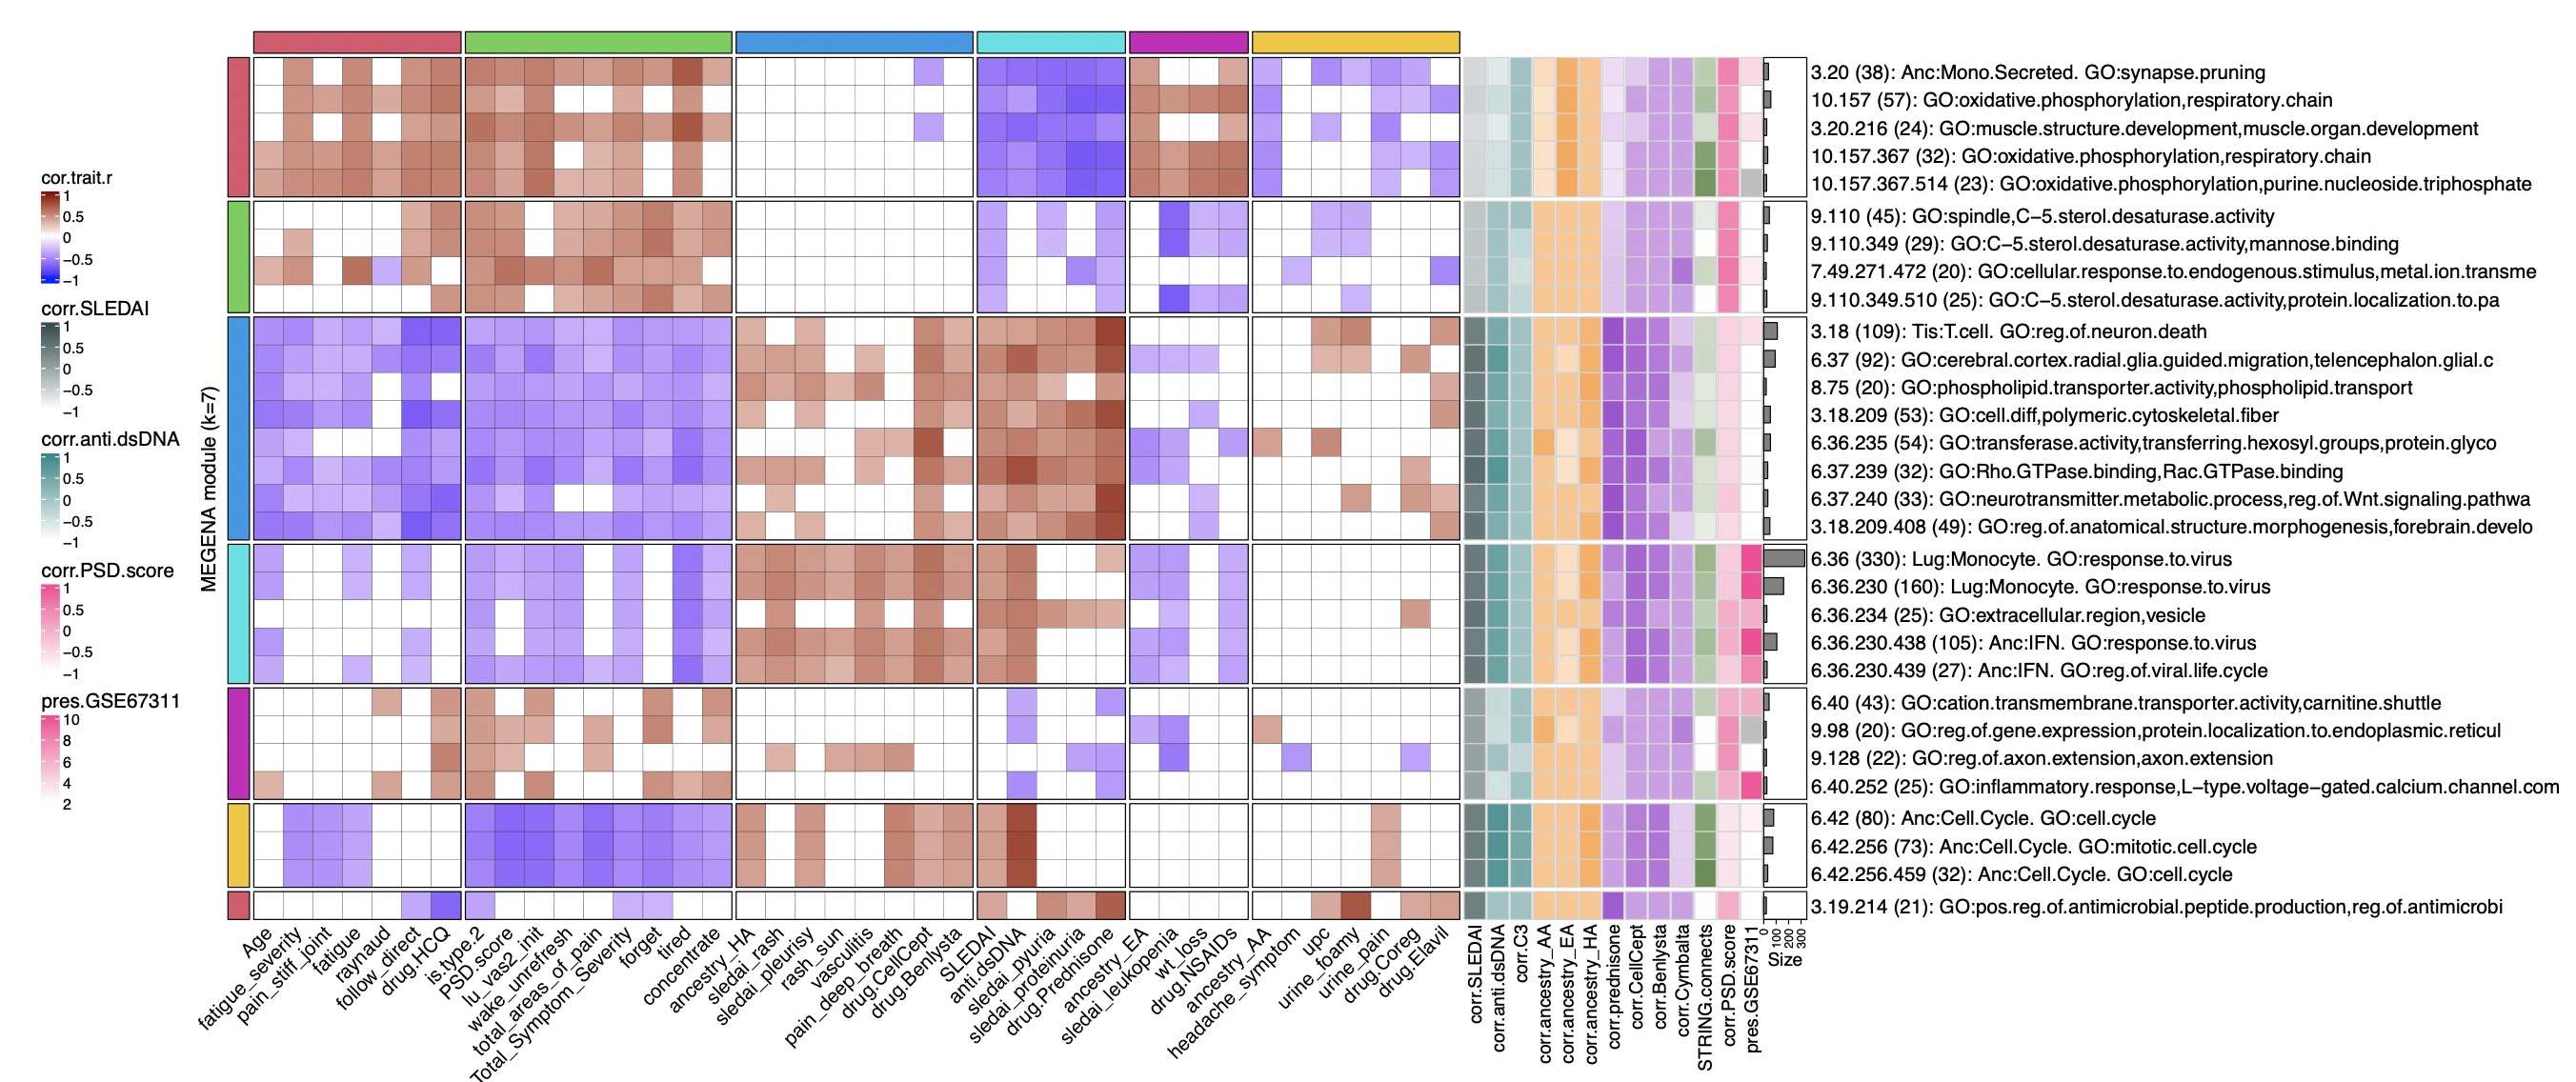 Gene co-expression module correlation to clinical & demographic features. Numerically encoded sample/patient traits were correlated to the first principal components (equivalent to the module eigengene ME) of all gen2 through gen4 MEGENA modules followed by selection of the top 30 significant (p < 0.2) correlations. The top 30 sample trait correlations were identified by descending ranking order of absolute values of the summed correlations per each of the top 30 modules. Row annotations include sample traits that may not have been included in the top 30 filtering but are of interest. These include ME correlations to SLEDAI, PSD score, ancestral background, usage of the immunotherapeutics prednisone, MMF (mycophenolate mofetil), belimumab, and duloxetine (Cymbalta). Also shown is percentage of a given module’s genes participation in predicted protein-protein interactions per the STRING, and the degree of module preservation in the fibromyalgia reference study GSE67311.
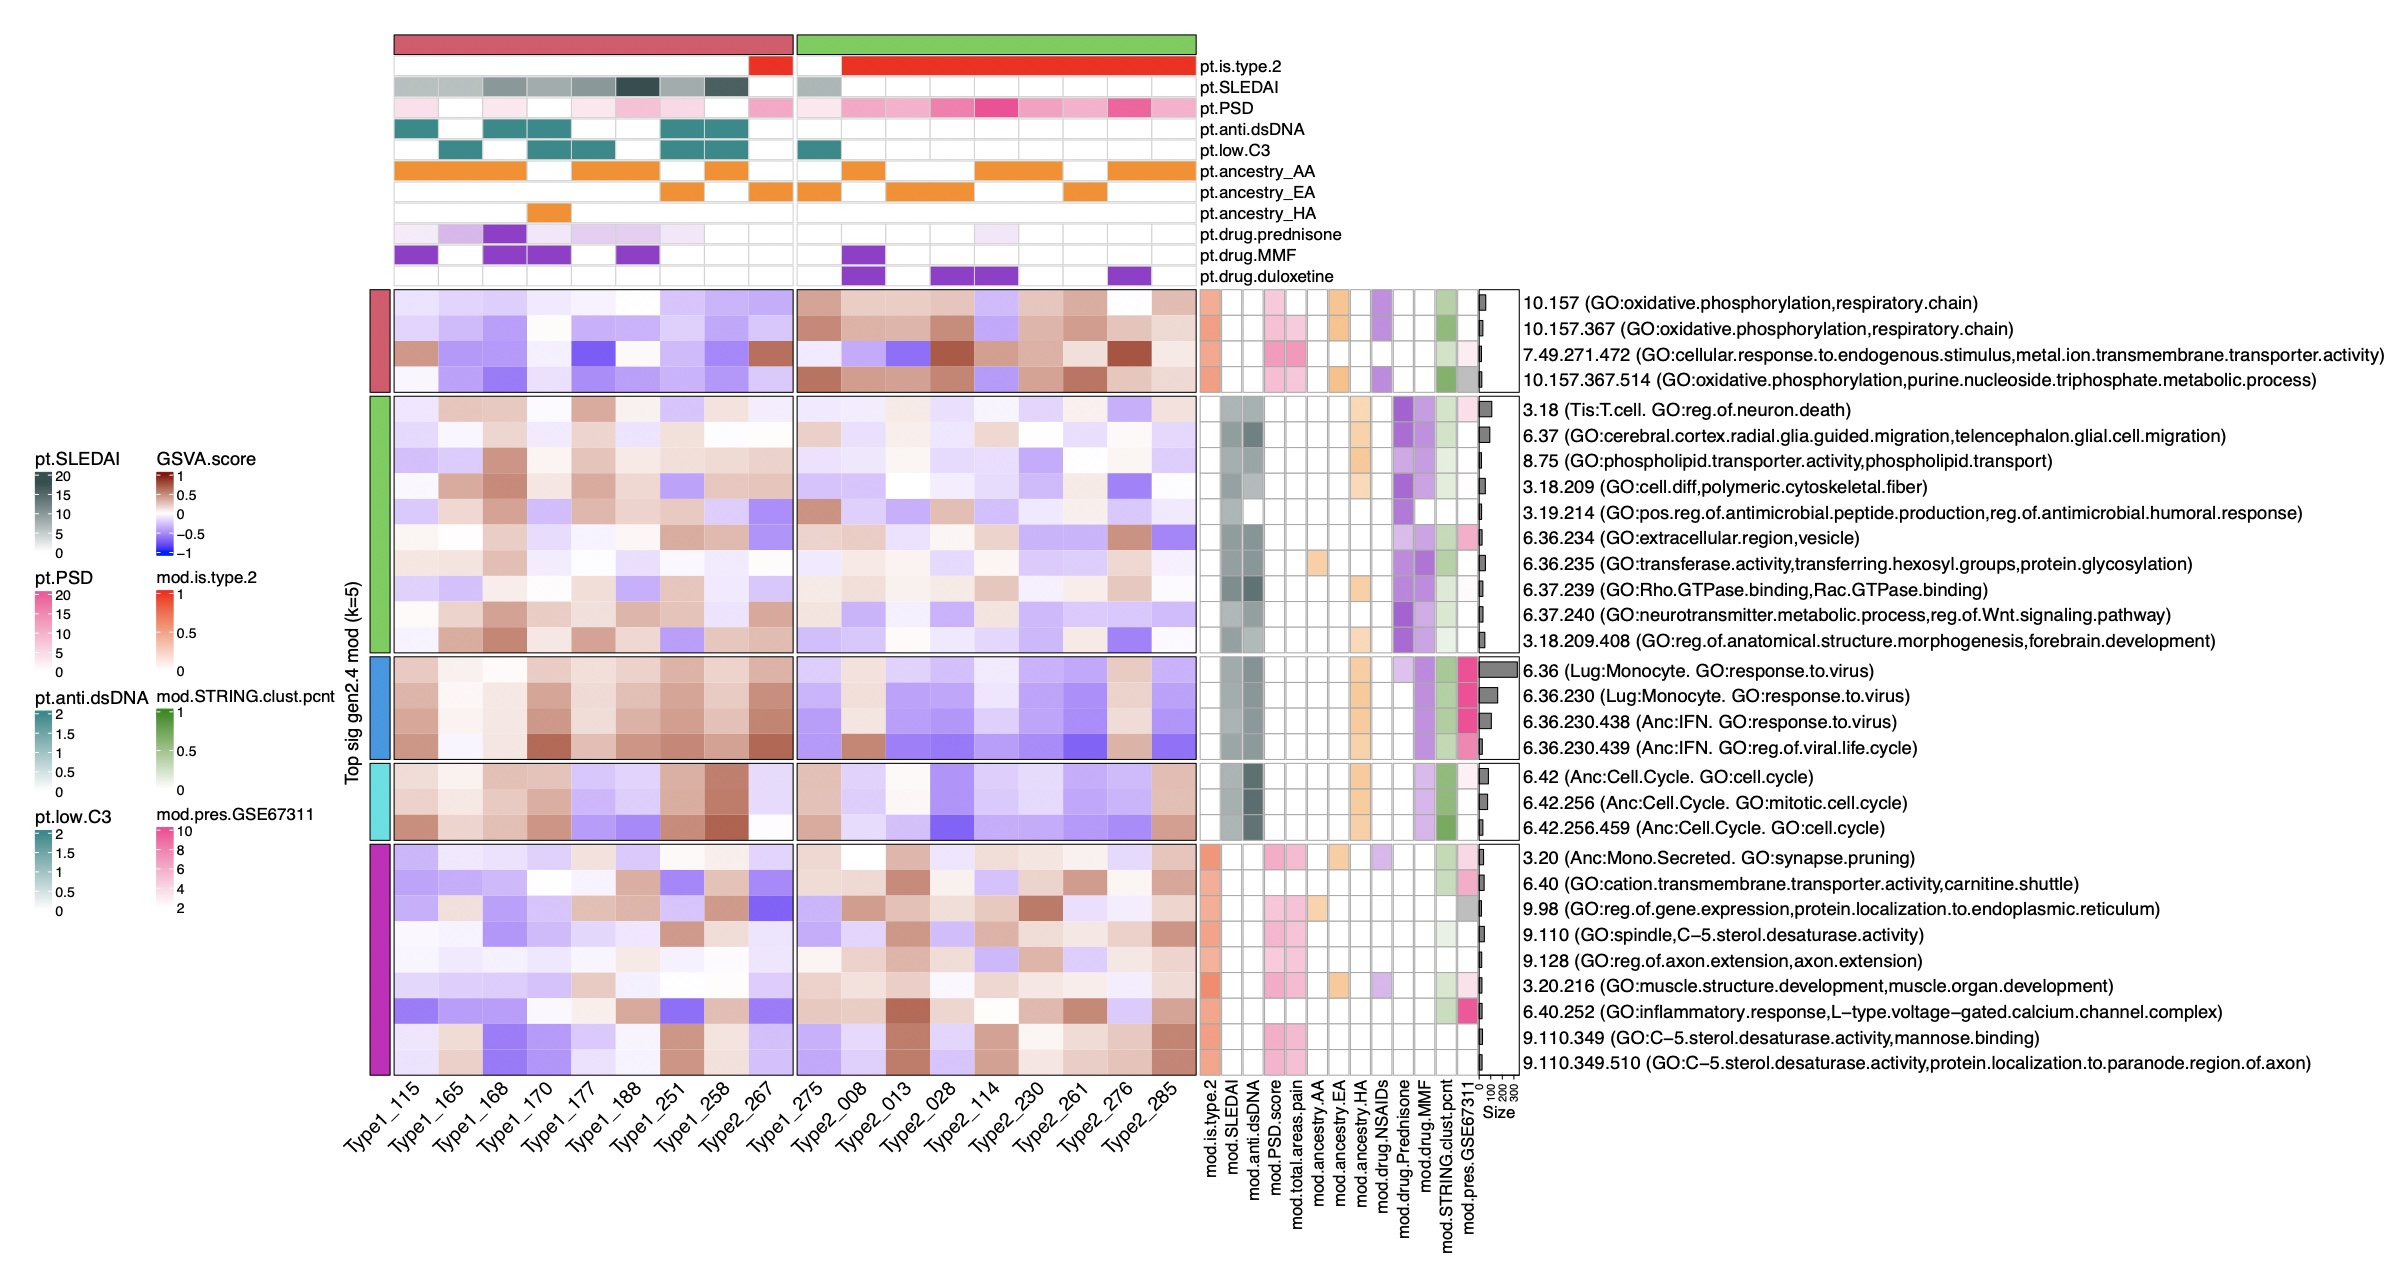 Gene Set Variation Analysis (GSVA) using gene coexpression modules as input gene sets effectively separates subjects with Type 1 and Type 2 SLE. Heatmaps indicate GSVA enrichment scores per patient for each module. Patient column annotations include patient type (type.1.SLE white, type.2.SLE red), SLEDAI score (with lab), PSD score, anti.dsDNA (binary), low C3 (binary), ancestral background (AA, EA, HA), prednisone dosage, and usage of MMF or duloxetine (binary). Columns of sample traits were clustered using optimized k-means clustering using 1,000 iterations on k=2. Module rows were clustered in a similar manner on k=5 and are annotated with only positive correlations to sample traits and range from 0 to +1. Coexpression module gene symbols were used to programmatically query the STRING database and calculate the percentage of genes within a given module predicted to have known protein-protein interactions (PPI) ranging from 0 to 100% (“STRING.clust.pcnt”), along with zsummary module preservation against the GSE67311 fibromyalgia test data set (“pres.GSE67311”).
 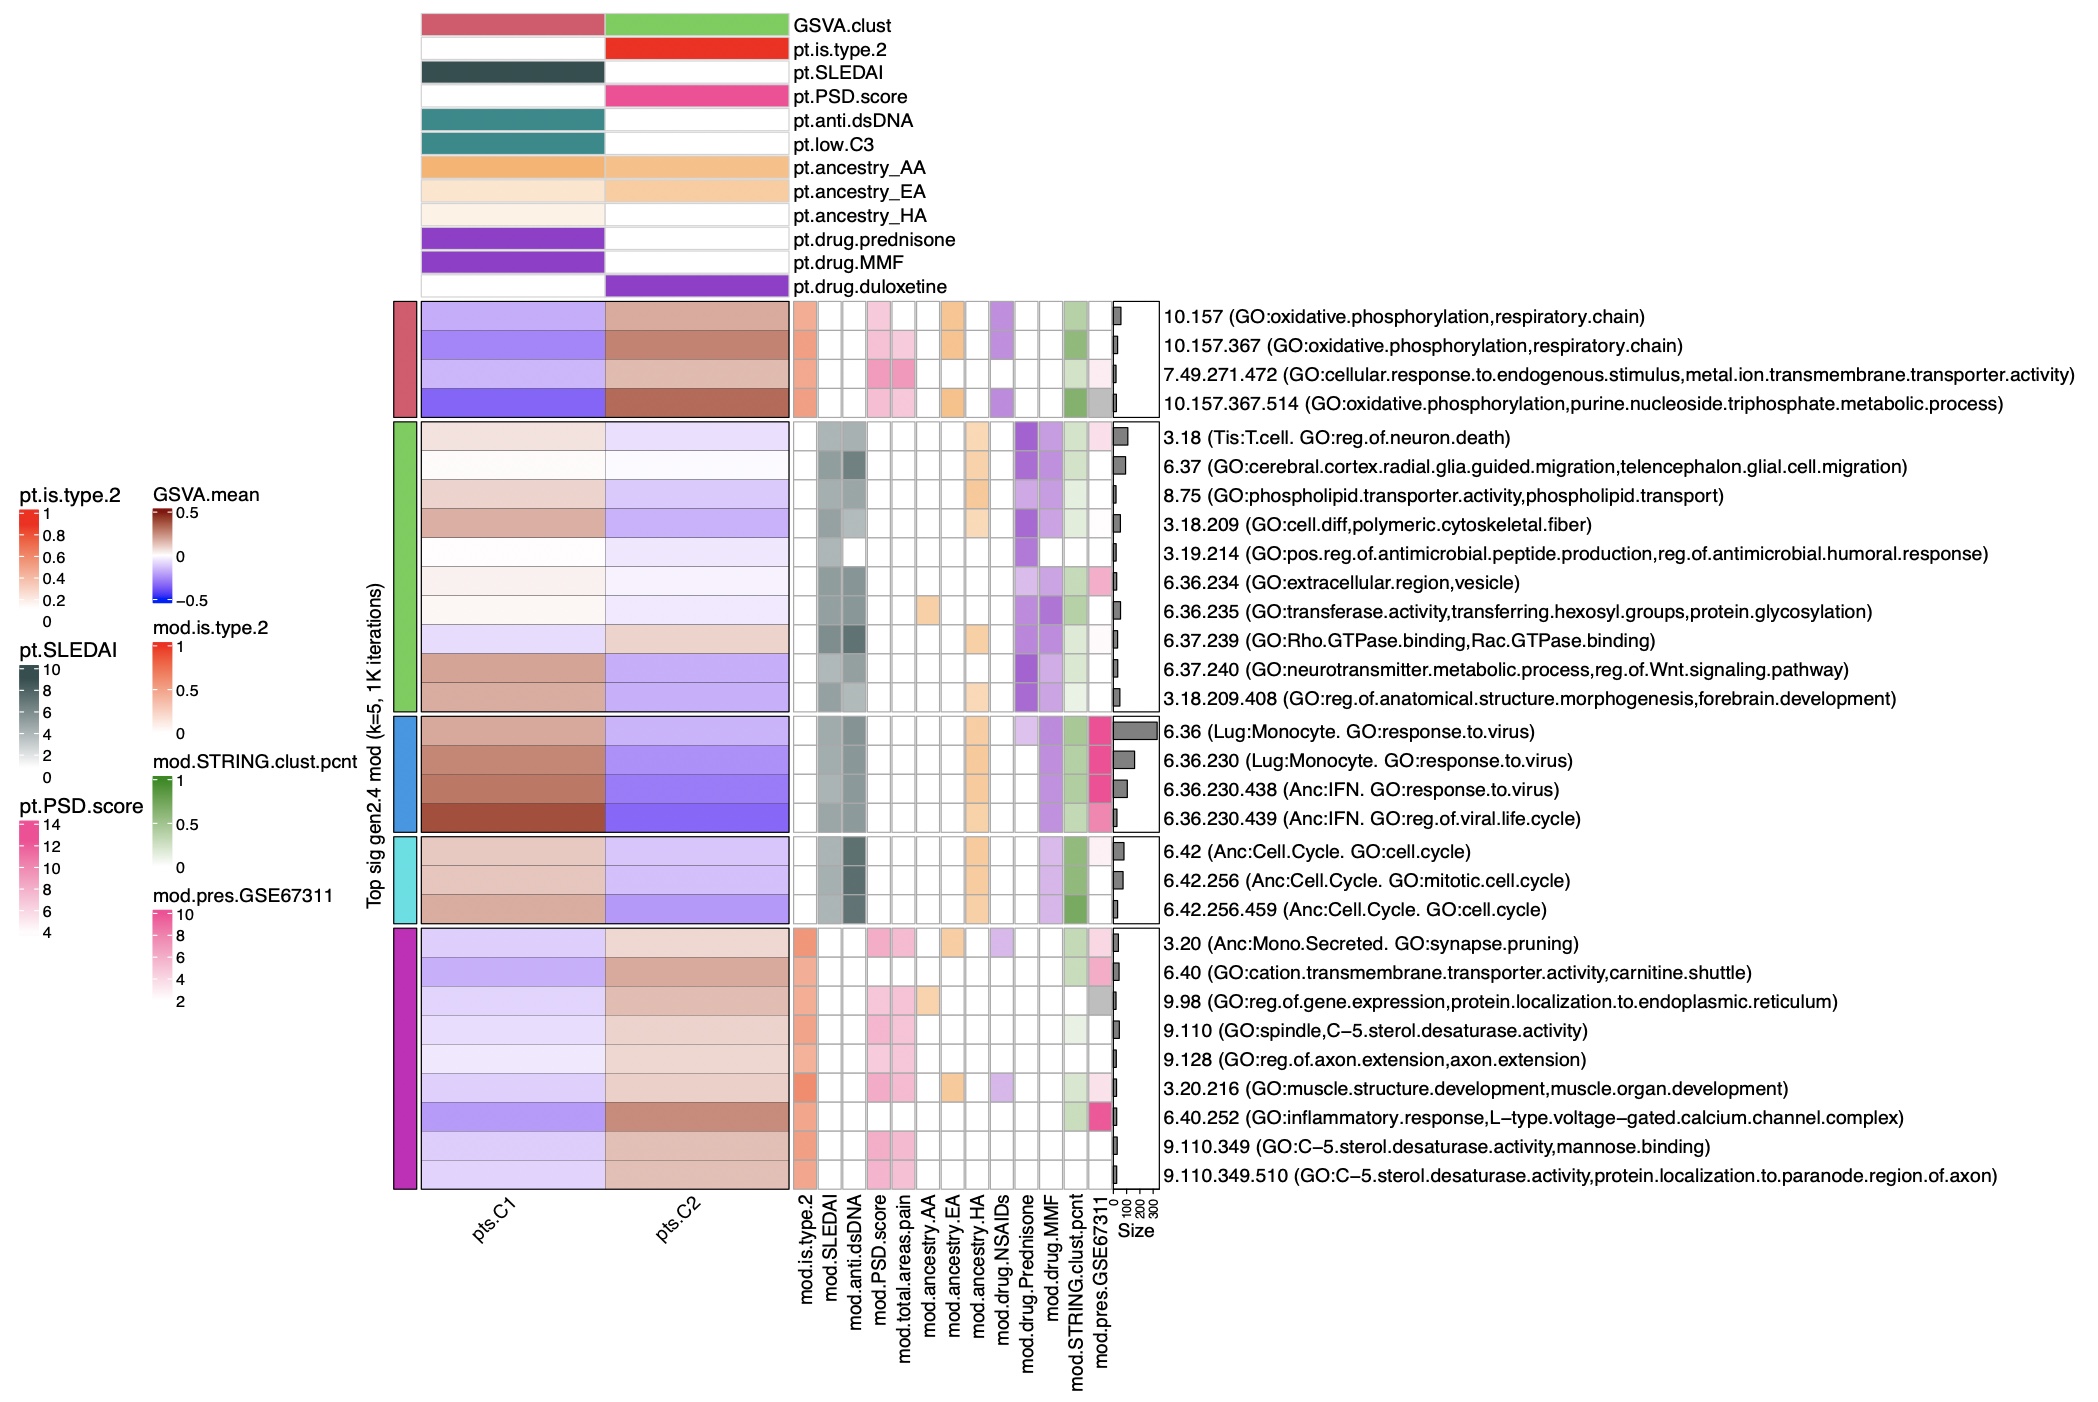 Data from Figure 2 was plotted as a mean of the patients in each cluster.