
Abstract Session

Ryan S. Funk, PhD, PharmD
University of Kansas
Leawood, KS, United States
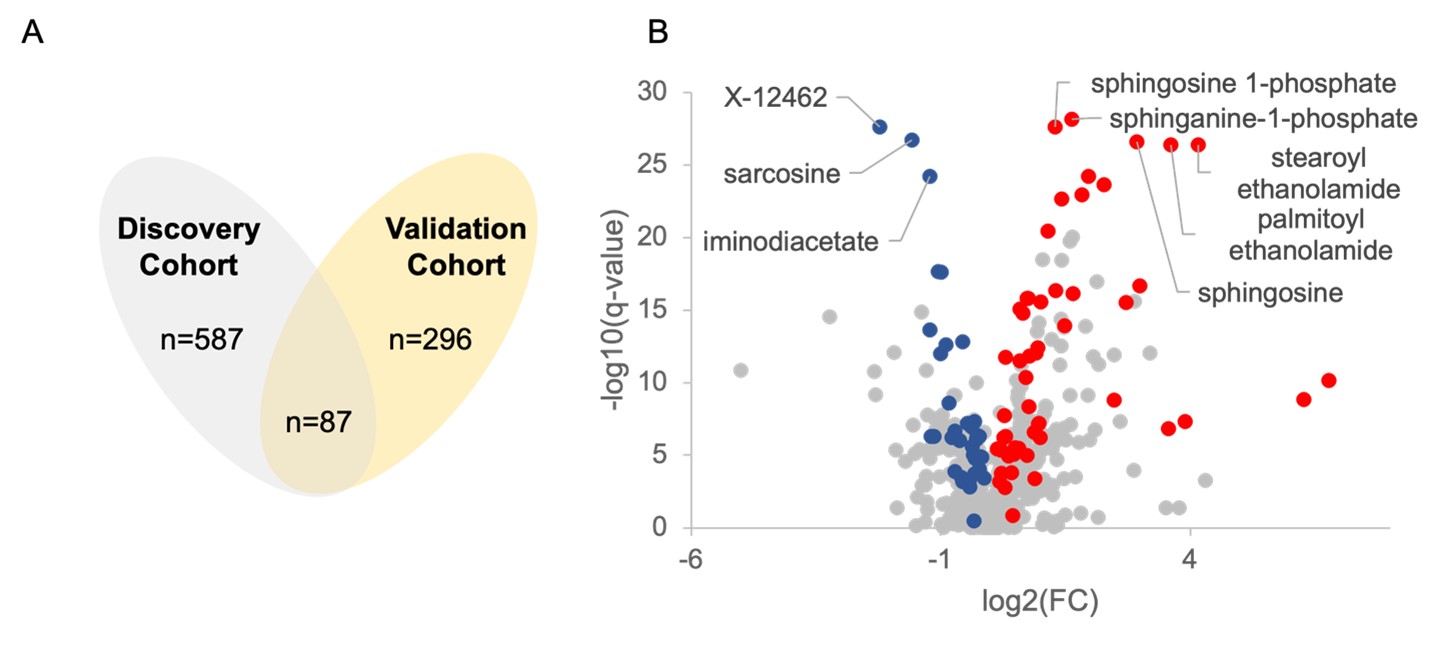 Figure 1. Plasma metabolomic differences in children with JIA. (A) A Venn diagram representation of plasma metabolomic differences in JIA patients compared to non-JIA reference patients in the discovery and validation cohorts, with the respective number (n) of altered metabolites identified. The intersecting area shows the commonly altered metabolites from both datasets based on achievement of statistical significance (q-value < 0.05) and the same directional change in both cohorts. (B) Volcano plot of the merged metabolomic comparison of JIA patients (n=112) and non-JIA reference patients (n=98). The metabolites that significantly differed in both the discovery and validation cohorts (n=87) were colored to indicate directional change (red = increased in JIA, blue = reduced in JIA). The most significant metabolites include the sphingosine metabolites and fatty acid ethanolamides (increased in JIA) and sarcosine, iminodiacetate (IDA), and the unknown metabolite X-12462 (decreased in JIA).
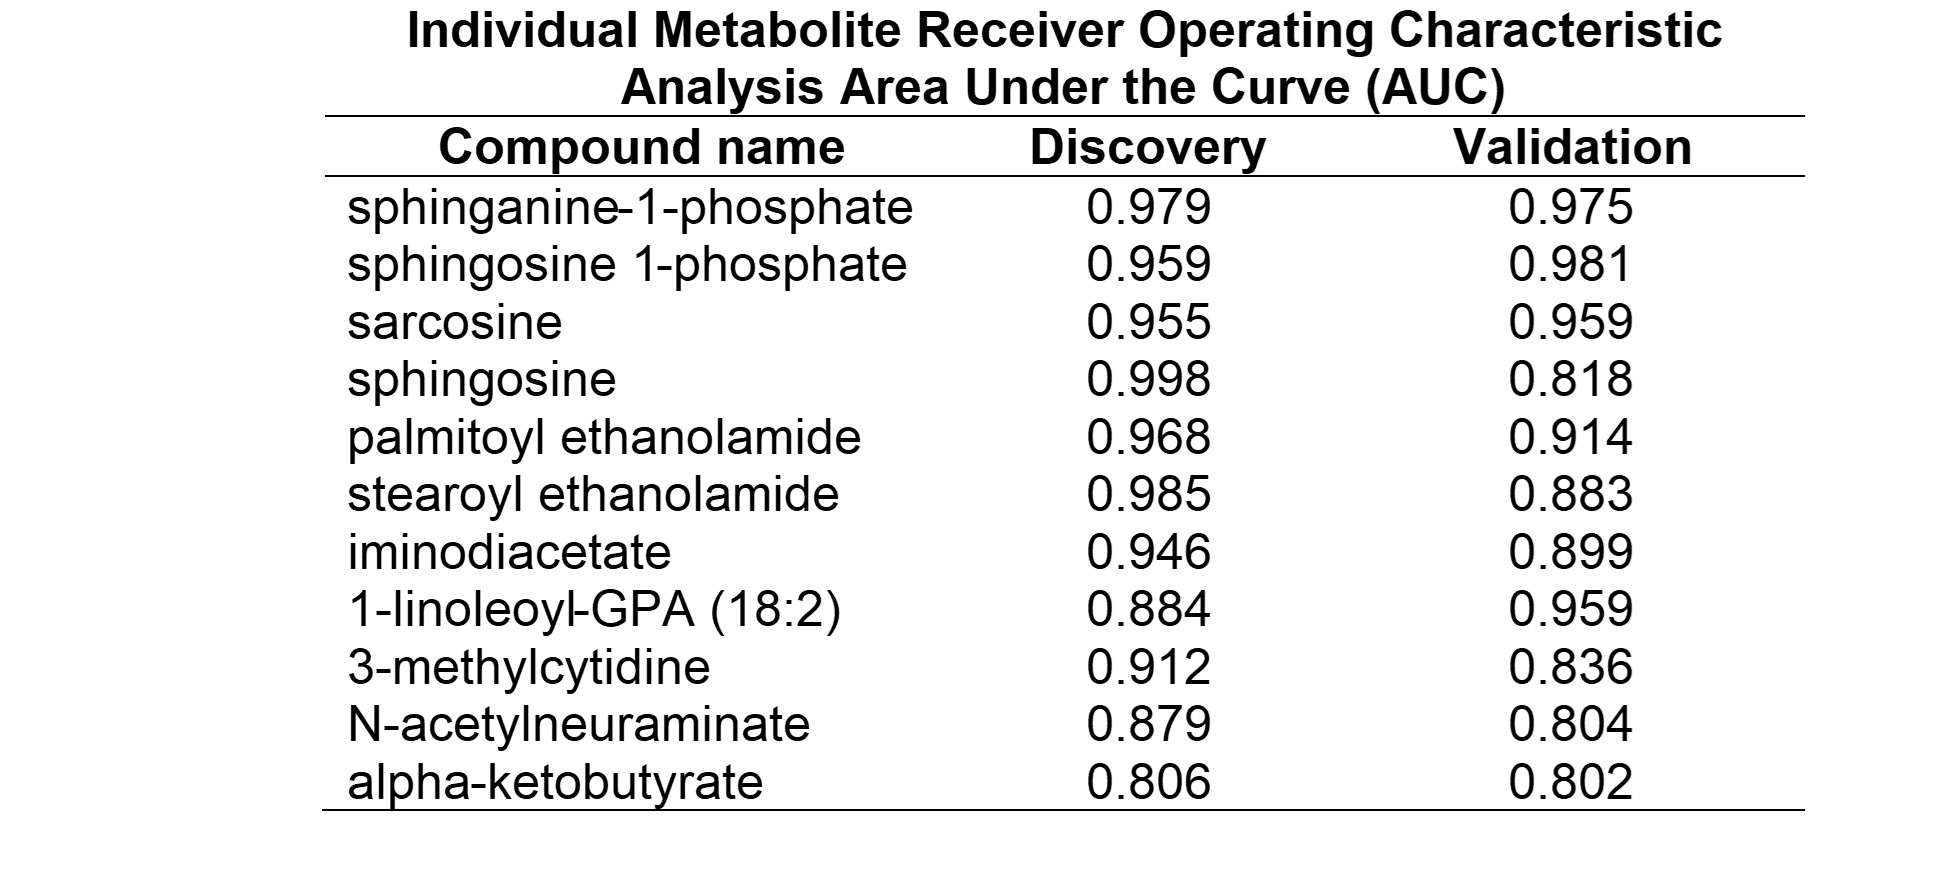 Table 1. Identification of top discriminating metabolomic markers of JIA. The table includes the compounds meeting an individual AUC threshold of > 0.80 in both the discovery and validation cohorts and are sorted based on the individual AUC from a merged data analysis.
 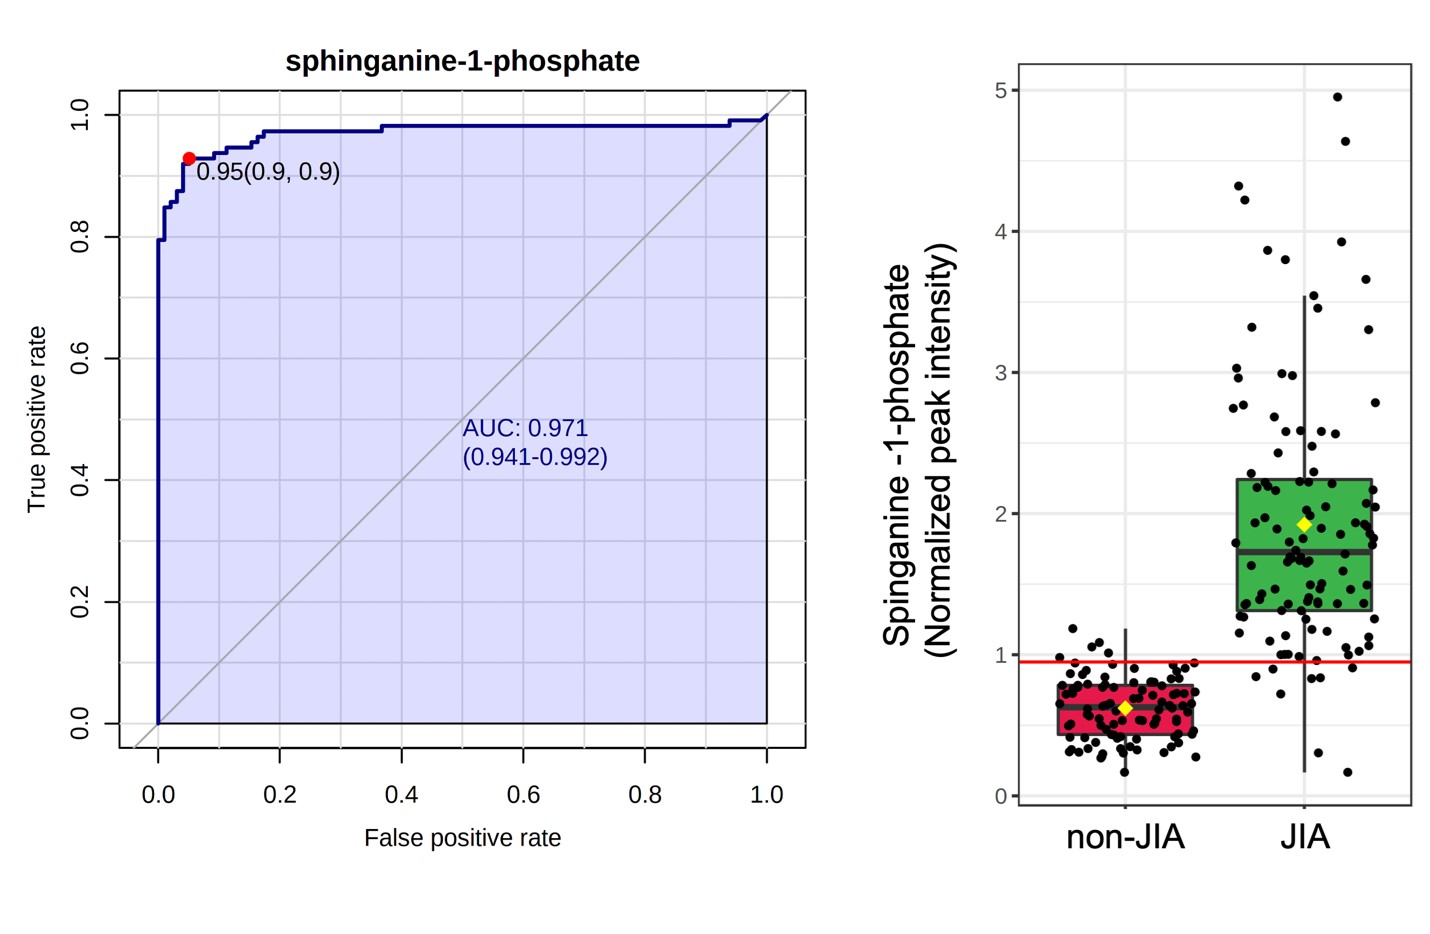 Figure 2. Sphinganine-1-phosphate as the top discriminating metabolite. The ROC curve and the box plot distribution result for plasma spinganine-1-phosphate.