
Abstract Session
Adam Labonte, PhD
AMPEL BioSolutions
Charlottesville, VA, United States
.jpg) Figure 1. PID mCODE clusters show unique expression patterns among immune cell populations. A. Schematic of protein-protein interaction network of PID gene mCODE clusters. Node size correlates to number of genes in each cluster and node color maps to number of intracluster connections. Edge weight thickness represents number of intercluster connections and edge color is mapped to mCODE combined edge score. Each node is labeled with the most highly represented BIG-C category for its member genes. B. DE data from sorted cell datasets overlayed on PID mCODE network. Each node represents one gene, with overexpressed genes shown in red and undexpressed genes shown in blue. Genes that were not significantly DE are shown in grey. Datasets used for each panel include GSE39088 (whole blood), GSE50772 (PBMC), GSE4588 (CD19 B cells), and GSE51997 (CD4 T cells, classical CD14+CD16- monocytes, and nonclassical CD14+CD16+ monocytes).
Figure 1. PID mCODE clusters show unique expression patterns among immune cell populations. A. Schematic of protein-protein interaction network of PID gene mCODE clusters. Node size correlates to number of genes in each cluster and node color maps to number of intracluster connections. Edge weight thickness represents number of intercluster connections and edge color is mapped to mCODE combined edge score. Each node is labeled with the most highly represented BIG-C category for its member genes. B. DE data from sorted cell datasets overlayed on PID mCODE network. Each node represents one gene, with overexpressed genes shown in red and undexpressed genes shown in blue. Genes that were not significantly DE are shown in grey. Datasets used for each panel include GSE39088 (whole blood), GSE50772 (PBMC), GSE4588 (CD19 B cells), and GSE51997 (CD4 T cells, classical CD14+CD16- monocytes, and nonclassical CD14+CD16+ monocytes). 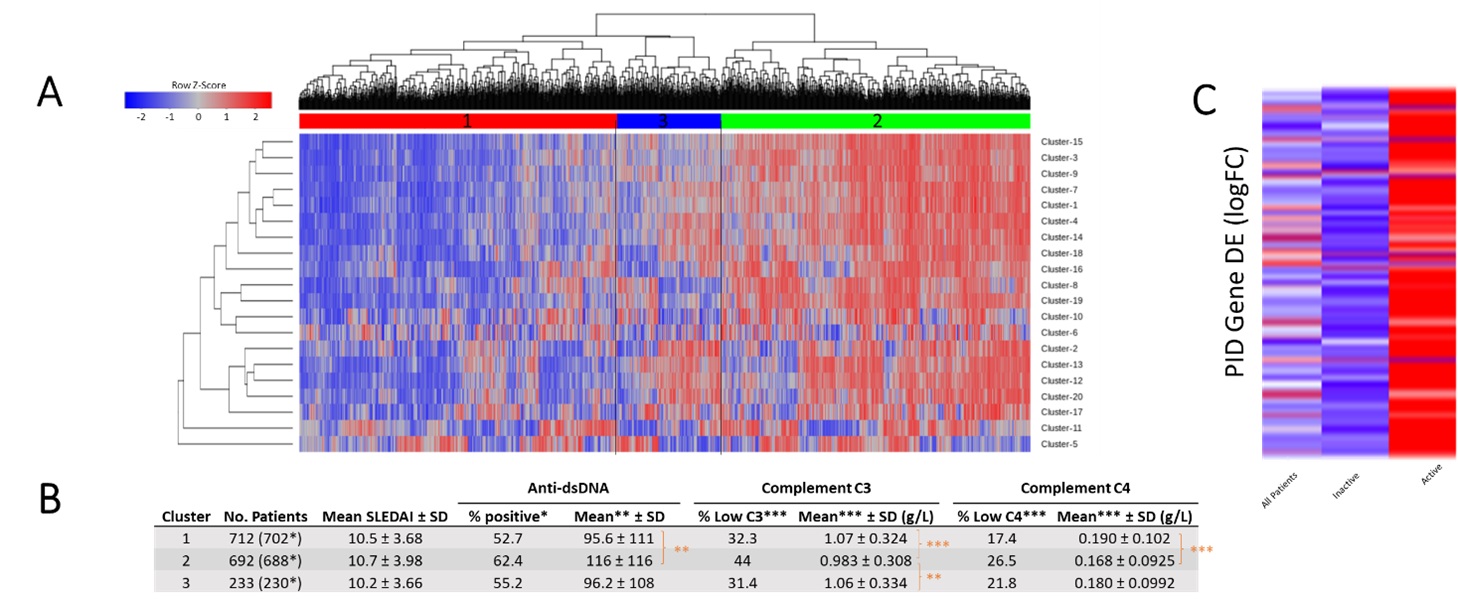 Figure 2. mCODE-derived PID gene clusters can identify clinically meaningful patient groups. A. GSVA of SLE patient DE gene data (GSE88884) using PID mCODE clusters as input gene sets. Output is shown following directed hierarchical clustering set to k=3 (clustering groups are shown as colored and numbered bars between heatmap and dendrogram). B. Clinical data summary and statistics of the three groups resulting from directed hierarchical clustering. *, p < 0.05; **, p < 0.001; ***, p < 0.0001. C. Total PID gene DE profile of patients within GSE88884, shown as logFC analysis for all patients combined, inactive (SLEDAI < 6) patients only, or active (SLEDAI ≥ 6) patients only.
 .jpg) Figure 3. PID gene clusters show utility as ML classifiers for SLE patient disease status. A, B. ROC curves (left) and individual classifier performance statistics (right) for 9 ML classifiers trained using PID mCODE clusters to correctly sort SLE patients from healthy controls (A) or active SLE patients from inactive SLE patients (B). C. Top feature clusters for ML identification of SLE vs control (left) or active SLE vs inactive SLE (right) across all classifiers. Overall feature importance data is mapped onto the PID mCODE schematic by node color, and clusters with positive feature importance values are annotated by defining BIG-C functional category.
Figure 3. PID gene clusters show utility as ML classifiers for SLE patient disease status. A, B. ROC curves (left) and individual classifier performance statistics (right) for 9 ML classifiers trained using PID mCODE clusters to correctly sort SLE patients from healthy controls (A) or active SLE patients from inactive SLE patients (B). C. Top feature clusters for ML identification of SLE vs control (left) or active SLE vs inactive SLE (right) across all classifiers. Overall feature importance data is mapped onto the PID mCODE schematic by node color, and clusters with positive feature importance values are annotated by defining BIG-C functional category.