Back
Poster Session B
Rheumatoid arthritis (RA)
Session: (0589–0628) RA – Etiology and Pathogenesis Poster
0609: Macrophage Response to MAA Modified Fibrinogen in the Presence of Peptidyl Arginine Deiminase Inhibitor
Sunday, November 13, 2022
9:00 AM – 10:30 AM Eastern Time
Location: Virtual Poster Hall
.jpg)
Nozima Aripova, BS
University of Nebraska Medical Center
Omaha, NE, United States
Abstract Poster Presenter(s)
nozima Aripova1, Michael Duryee1, carlos hunter1, Geoffrey Thiele1 and Ted Mikuls2, 1University of Nebraska Medical Center, Omaha, NE, 2Division of Rheumatology, University of Nebraska Medical Center, Omaha, NE
Background/Purpose: The formation of citrullinated (CIT) proteins is catalyzed by a calcium-dependent peptidyl arginine deiminase (PAD). In rheumatoid arthritis (RA), synovial macrophages are main contributors of PAD2 expression and the formation of CIT proteins. Studies from our laboratory have demonstrated that malondialdehyde-acetaldehyde (MAA) modified proteins co-localize with CIT proteins and generate pro-inflammatory (M1-like) and pro-fibrotic (M2-like) responses by macrophages. To identify whether the observed effects of MAA-modified proteins are mediated by PAD activity, we examined the effects of PAD inhibition on macrophages exposed to MAA modified fibrinogen (FIB) with respect to cell polarization, PAD2 expression and protein citrullination.
Methods: Phorbol 12-myristate 13-acetate (PMA)-treated U-937 cells (M0 macrophages) were first stimulated with native or MAA-modified FIB followed without and then in the presence of the pan-PAD inhibitor (BB-Cl-Amidine; BB-CLA). Cell lysates were evaluated for PAD2, citrulline (CIT), phosphorylated Akt (pAkt), vimentin (VIM), and β-actin (bA) using Western Blot, quantifying the most prominent CIT bands. The density of corresponding bands was measured and normalized to values of β-actin. Additionally, RNA was isolated from stimulated M0 cells and evaluated for M1 (CD192, CX3CR1) and M2 (CD163, CD206) markers, and PAD (PAD2, PAD4) enzymes. Relative quantity (Rq) of each marker was reported.
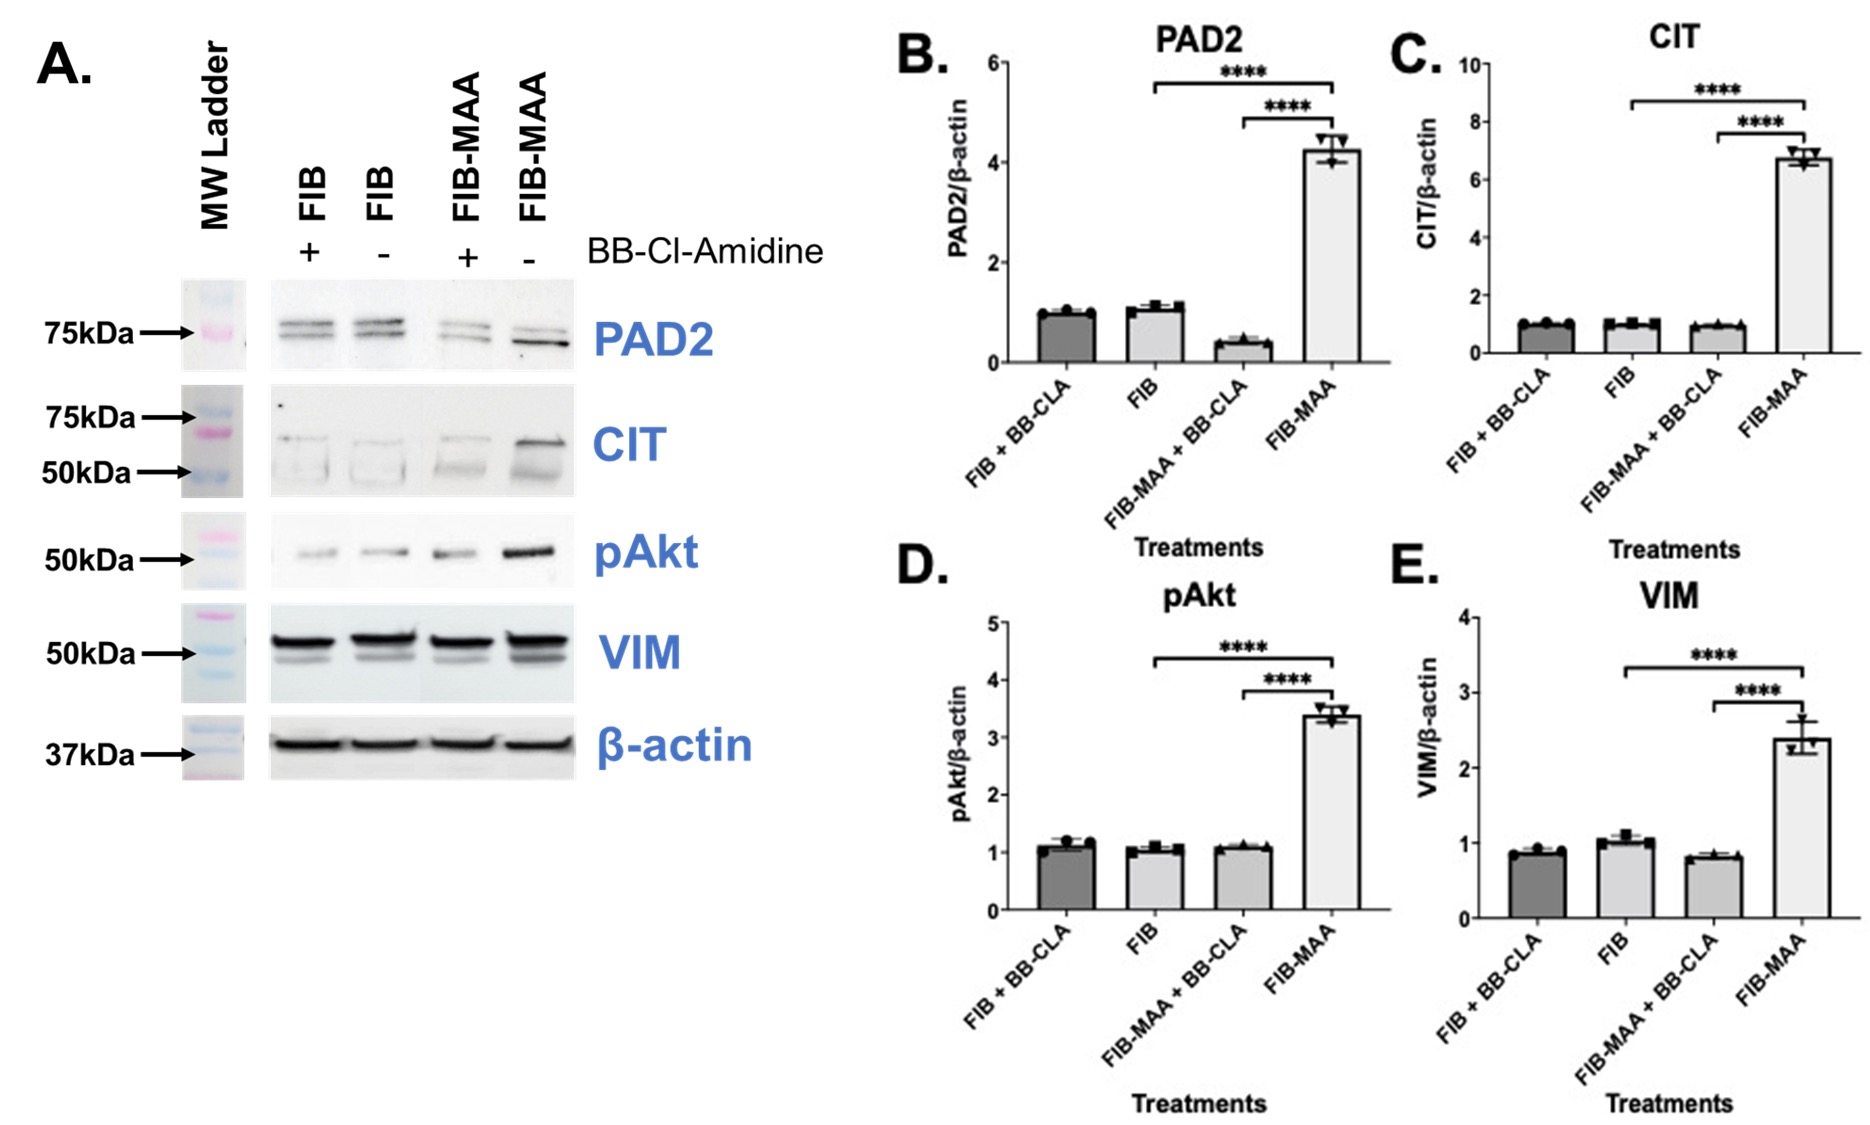
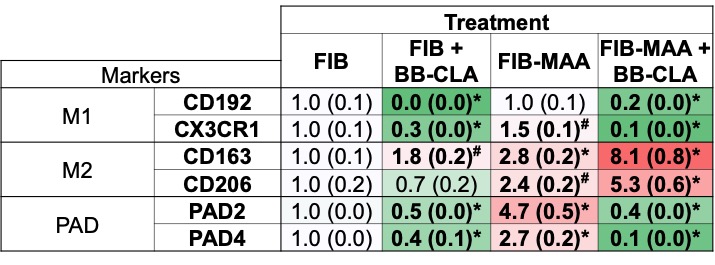
Results: In the absence of BB-CLA and compared to stimulation with unmodified FIB, M0 cells stimulated with FIB-MAA demonstrated increased expression of PAD2 (4-fold, p< 0.001; Fig.1A,B), 75 kDa CIT protein (6-fold, p< 0.001; Fig.1A,C), pAkt (3.5-fold, p< 0.001; Fig.1A,D), and VIM (2.5-fold, p< 0.001; Fig.1A,E). The two most prominent CIT bands were at 75 kDa and ~57 kDa, confirmed to be PAD2 and VIM, respectively. In the presence of BB-CLA, cellular responses to FIB-MAA were significantly attenuated and approached that observed with unmodified FIB. RT-PCR studies following FIB-MAA treatment of M0 cells in the absence of BB-CLA showed increased mRNA levels of CX3CR1 (1.5-fold, p< 0.05; Fig.2), CD163 (3-fold, p< 0.001), CD206 (2-fold, p< 0.001), PAD2 (5-fold, p< 0.001), and PAD4 (3-fold, p< 0.001). In the presence of BB-CLA and FIB-MAA treatment, the mRNA levels for M1 markers (CD192, CX3CR1) and PAD2/4 decreased significantly. In contrast, mRNA levels for M2 markers (CD163, CD206) increased significantly in the presence of BB-CLA compared to FIB-MAA treatment alone. Effects of BB-CLA treatment on cells exposed to unmodified FIB were similar.
Conclusion: This study and others by our group show that human macrophages exposed to MAA-modified fibrinogen increase PAD2 and vimentin expression and potentially leads to their citrullination. Importantly, these effects are attenuated with PAD inhibition, which appears to simultaneously shift the balance from a M1 pro-inflammatory response to a M2 pro-fibrotic response. These observations demonstrate that the biological effects of MAA-modified proteins on macrophage function can be altered with PAD inhibition, a strategy that could potentially be refined and harnessed in RA management.
 Figure 1. Western Blot from stimulated M0 cells. M0 cells were stimulated with modified fibrinogen for 48 hours. BB-CLA: BB-Cl-amidine, CIT: citrullination, FIB: fibrinogen, FIB-MAA: fibrinogen-MAA, PAD: peptidyl-arginine deiminase, pAKT: phosphorylated serine/threonine protein kinase (Akt), VIM: vimentin. (A) Cell lysates were probed with anti-PAD2, anti-CIT, anti-pAkt, anti-VIM, and anti-β-actin antibodies. Densitometry of normalized values to β-actin of (B) PAD2, (C) 75 kDa citrullination band for CIT, (D) pAkt, and (E) VIM. The data is represented as a mean densitometry normalized value. Tukey’s post-hoc test comparisons are illustrated between treatment groups, and only significant differences are illustrated: ****p < 0.001.
 Figure 2. RT-PCR for M1 and M2 markers and PAD from stimulated U-937 cells. BB-CLA: BB-Cl-Amidine, FIB: fibrinogen, FIB-MAA: fibrinogen-MAA, PAD: peptidyl arginine deiminase. M1 markers: CD192, CX3CR1; M2 markers: CD163, CD206; PAD markers: PAD2 and PAD4. The data is represented as a mean (standard deviation) of Relative quantity (Rq) markers. Red boxes represent increased mRNA levels, while green boxes represent decreased mRNA levels. All the values are compared to FIB. *p < 0.001, #p < 0.05, n=3.
Disclosures: n. Aripova, None; M. Duryee, None; c. hunter, None; G. Thiele, None; T. Mikuls, Gilead Sciences, Bristol-Myers Squibb, Horizon, Sanofi, Pfizer Inc.
Background/Purpose: The formation of citrullinated (CIT) proteins is catalyzed by a calcium-dependent peptidyl arginine deiminase (PAD). In rheumatoid arthritis (RA), synovial macrophages are main contributors of PAD2 expression and the formation of CIT proteins. Studies from our laboratory have demonstrated that malondialdehyde-acetaldehyde (MAA) modified proteins co-localize with CIT proteins and generate pro-inflammatory (M1-like) and pro-fibrotic (M2-like) responses by macrophages. To identify whether the observed effects of MAA-modified proteins are mediated by PAD activity, we examined the effects of PAD inhibition on macrophages exposed to MAA modified fibrinogen (FIB) with respect to cell polarization, PAD2 expression and protein citrullination.
Methods: Phorbol 12-myristate 13-acetate (PMA)-treated U-937 cells (M0 macrophages) were first stimulated with native or MAA-modified FIB followed without and then in the presence of the pan-PAD inhibitor (BB-Cl-Amidine; BB-CLA). Cell lysates were evaluated for PAD2, citrulline (CIT), phosphorylated Akt (pAkt), vimentin (VIM), and β-actin (bA) using Western Blot, quantifying the most prominent CIT bands. The density of corresponding bands was measured and normalized to values of β-actin. Additionally, RNA was isolated from stimulated M0 cells and evaluated for M1 (CD192, CX3CR1) and M2 (CD163, CD206) markers, and PAD (PAD2, PAD4) enzymes. Relative quantity (Rq) of each marker was reported.
Results: In the absence of BB-CLA and compared to stimulation with unmodified FIB, M0 cells stimulated with FIB-MAA demonstrated increased expression of PAD2 (4-fold, p< 0.001; Fig.1A,B), 75 kDa CIT protein (6-fold, p< 0.001; Fig.1A,C), pAkt (3.5-fold, p< 0.001; Fig.1A,D), and VIM (2.5-fold, p< 0.001; Fig.1A,E). The two most prominent CIT bands were at 75 kDa and ~57 kDa, confirmed to be PAD2 and VIM, respectively. In the presence of BB-CLA, cellular responses to FIB-MAA were significantly attenuated and approached that observed with unmodified FIB. RT-PCR studies following FIB-MAA treatment of M0 cells in the absence of BB-CLA showed increased mRNA levels of CX3CR1 (1.5-fold, p< 0.05; Fig.2), CD163 (3-fold, p< 0.001), CD206 (2-fold, p< 0.001), PAD2 (5-fold, p< 0.001), and PAD4 (3-fold, p< 0.001). In the presence of BB-CLA and FIB-MAA treatment, the mRNA levels for M1 markers (CD192, CX3CR1) and PAD2/4 decreased significantly. In contrast, mRNA levels for M2 markers (CD163, CD206) increased significantly in the presence of BB-CLA compared to FIB-MAA treatment alone. Effects of BB-CLA treatment on cells exposed to unmodified FIB were similar.
Conclusion: This study and others by our group show that human macrophages exposed to MAA-modified fibrinogen increase PAD2 and vimentin expression and potentially leads to their citrullination. Importantly, these effects are attenuated with PAD inhibition, which appears to simultaneously shift the balance from a M1 pro-inflammatory response to a M2 pro-fibrotic response. These observations demonstrate that the biological effects of MAA-modified proteins on macrophage function can be altered with PAD inhibition, a strategy that could potentially be refined and harnessed in RA management.
 Figure 1. Western Blot from stimulated M0 cells. M0 cells were stimulated with modified fibrinogen for 48 hours. BB-CLA: BB-Cl-amidine, CIT: citrullination, FIB: fibrinogen, FIB-MAA: fibrinogen-MAA, PAD: peptidyl-arginine deiminase, pAKT: phosphorylated serine/threonine protein kinase (Akt), VIM: vimentin. (A) Cell lysates were probed with anti-PAD2, anti-CIT, anti-pAkt, anti-VIM, and anti-β-actin antibodies. Densitometry of normalized values to β-actin of (B) PAD2, (C) 75 kDa citrullination band for CIT, (D) pAkt, and (E) VIM. The data is represented as a mean densitometry normalized value. Tukey’s post-hoc test comparisons are illustrated between treatment groups, and only significant differences are illustrated: ****p < 0.001.
 Figure 2. RT-PCR for M1 and M2 markers and PAD from stimulated U-937 cells. BB-CLA: BB-Cl-Amidine, FIB: fibrinogen, FIB-MAA: fibrinogen-MAA, PAD: peptidyl arginine deiminase. M1 markers: CD192, CX3CR1; M2 markers: CD163, CD206; PAD markers: PAD2 and PAD4. The data is represented as a mean (standard deviation) of Relative quantity (Rq) markers. Red boxes represent increased mRNA levels, while green boxes represent decreased mRNA levels. All the values are compared to FIB. *p < 0.001, #p < 0.05, n=3.
Disclosures: n. Aripova, None; M. Duryee, None; c. hunter, None; G. Thiele, None; T. Mikuls, Gilead Sciences, Bristol-Myers Squibb, Horizon, Sanofi, Pfizer Inc.

