
Abstract Session
Claire Hoy, BS
University of Michigan
Ann Arbor, MI, United States
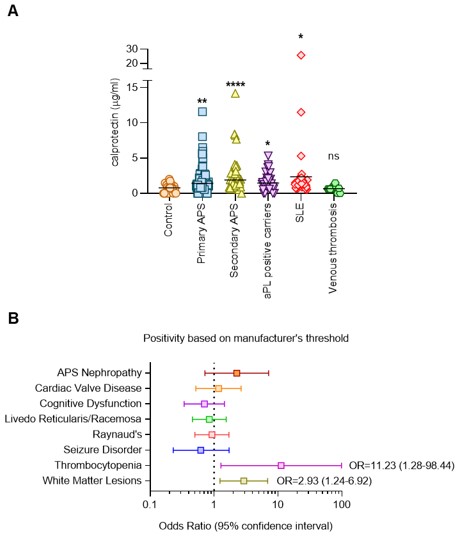 Figure 1: Calprotectin in APS plasma. A, Levels of calprotectin were measured in the indicated groups and compared with healthy controls by Kruskal-Wallis test corrected for multiple comparisons by Dunn’s method; *p < 0.05, **p < 0.01, ****p < 0.0001, ns=not significant. B, Calprotectin was determined to be positive based on manufacturer’s threshold. Non-criteria manifestations of APS were assessed by multivariate logistic regression adjusted for age and sex. OR=Odds ratio.
 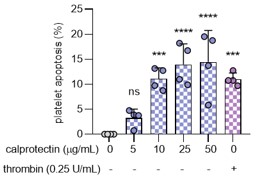 Figure 2: Induction of platelet apoptosis by calprotectin. Donor platelets were treated with recombinant calprotectin at the concentrations indicated. After 2 hours incubation, a platelet specific viability dye (calcein-AM) was used to determine platelet survival by flow cytometry. Percent platelet apoptosis was then calculated and compared to untreated cells by ANOVA test corrected for multiple comparison by Dunnett’s test. Thrombin was used as a positive control; ***p < 0.001, ****p < 0.0001, ns=not significant.