Back
Poster Session A
Pediatric autoimmune diseases: Kawasaki disease, juvenile dermatomyositis and juvenile localized scleroderma
Session: (0034–0044) Pediatric Rheumatology – Basic Science Poster
0043: Non-invasive Tape Strip Gene Expression Profiling of Lesional Juvenile Dermatomyositis Skin Identifies Immunoregulatory Module That Associates with Skin, Muscle and Global Disease Activity
Saturday, November 12, 2022
1:00 PM – 3:00 PM Eastern Time
Location: Virtual Poster Hall
- JT
Jessica L. Turnier, MD, MS
University of Michigan
Saline, MI, United States
Abstract Poster Presenter(s)
Jessica Turnier1, Celine Berthier2, Madison McClune2, Sarah Vandenbergen2, Johann Gudjonsson2, Alex Tsoi2 and J. Michelle Kahlenberg2, 1University of Michigan, Saline, MI, 2University of Michigan, Ann Arbor, MI
Background/Purpose: Skin inflammation in juvenile dermatomyositis (JDM) frequently persists even in the absence of active muscle disease. Tape stripping is a non-invasive skin sampling method that can be combined with transcriptome profiling to understand the connection of cutaneous signatures to disease activity. The objectives in this study were to 1) define gene expression signatures in lesional and non-lesional JDM skin recovered with tape stripping and 2) determine association of expression signatures with clinical disease activity.
Methods: We utilized tape stripping to collect lesional (L) and non-lesional (NL) skin in a JDM cohort (n=28 with ≥1 NL; n=18 with ≥1 paired L) and healthy controls (CTL; n=20, NL only). JDM patients met 2017 EULAR/ACR classification criteria and had standardized disease activity measures collected, including the Cutaneous Dermatomyositis Disease Area and Severity Index (CDASI), Manual Muscle Testing (MMT-8), and Physician's Global Assessment of Disease Activity (PGA). mRNA was extracted from tape strips and RNA-seq libraries were generated and sequenced through the University of Michigan Advanced Genomics Core. Differentially expressed genes (DEGs; p-adjusted≤10%) between groups were identified using Limma-Voom. Literature-based pathway and network analyses were performed using Ingenuity Pathway Analysis (IPA) and Genomatix Pathway System (GePS). Weighted gene co-expression network analysis (WGCNA) was used to identify gene modules that were correlated with clinical measures. We also performed cell type enrichment analysis (xCell).
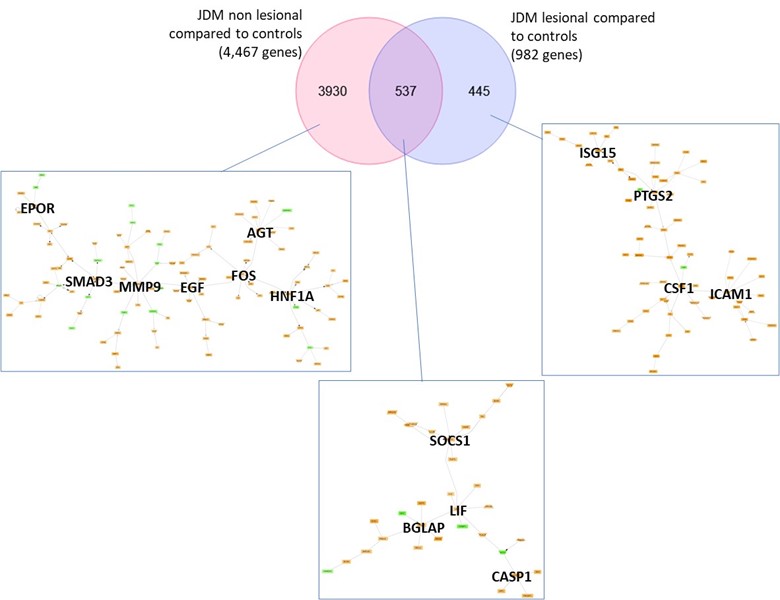
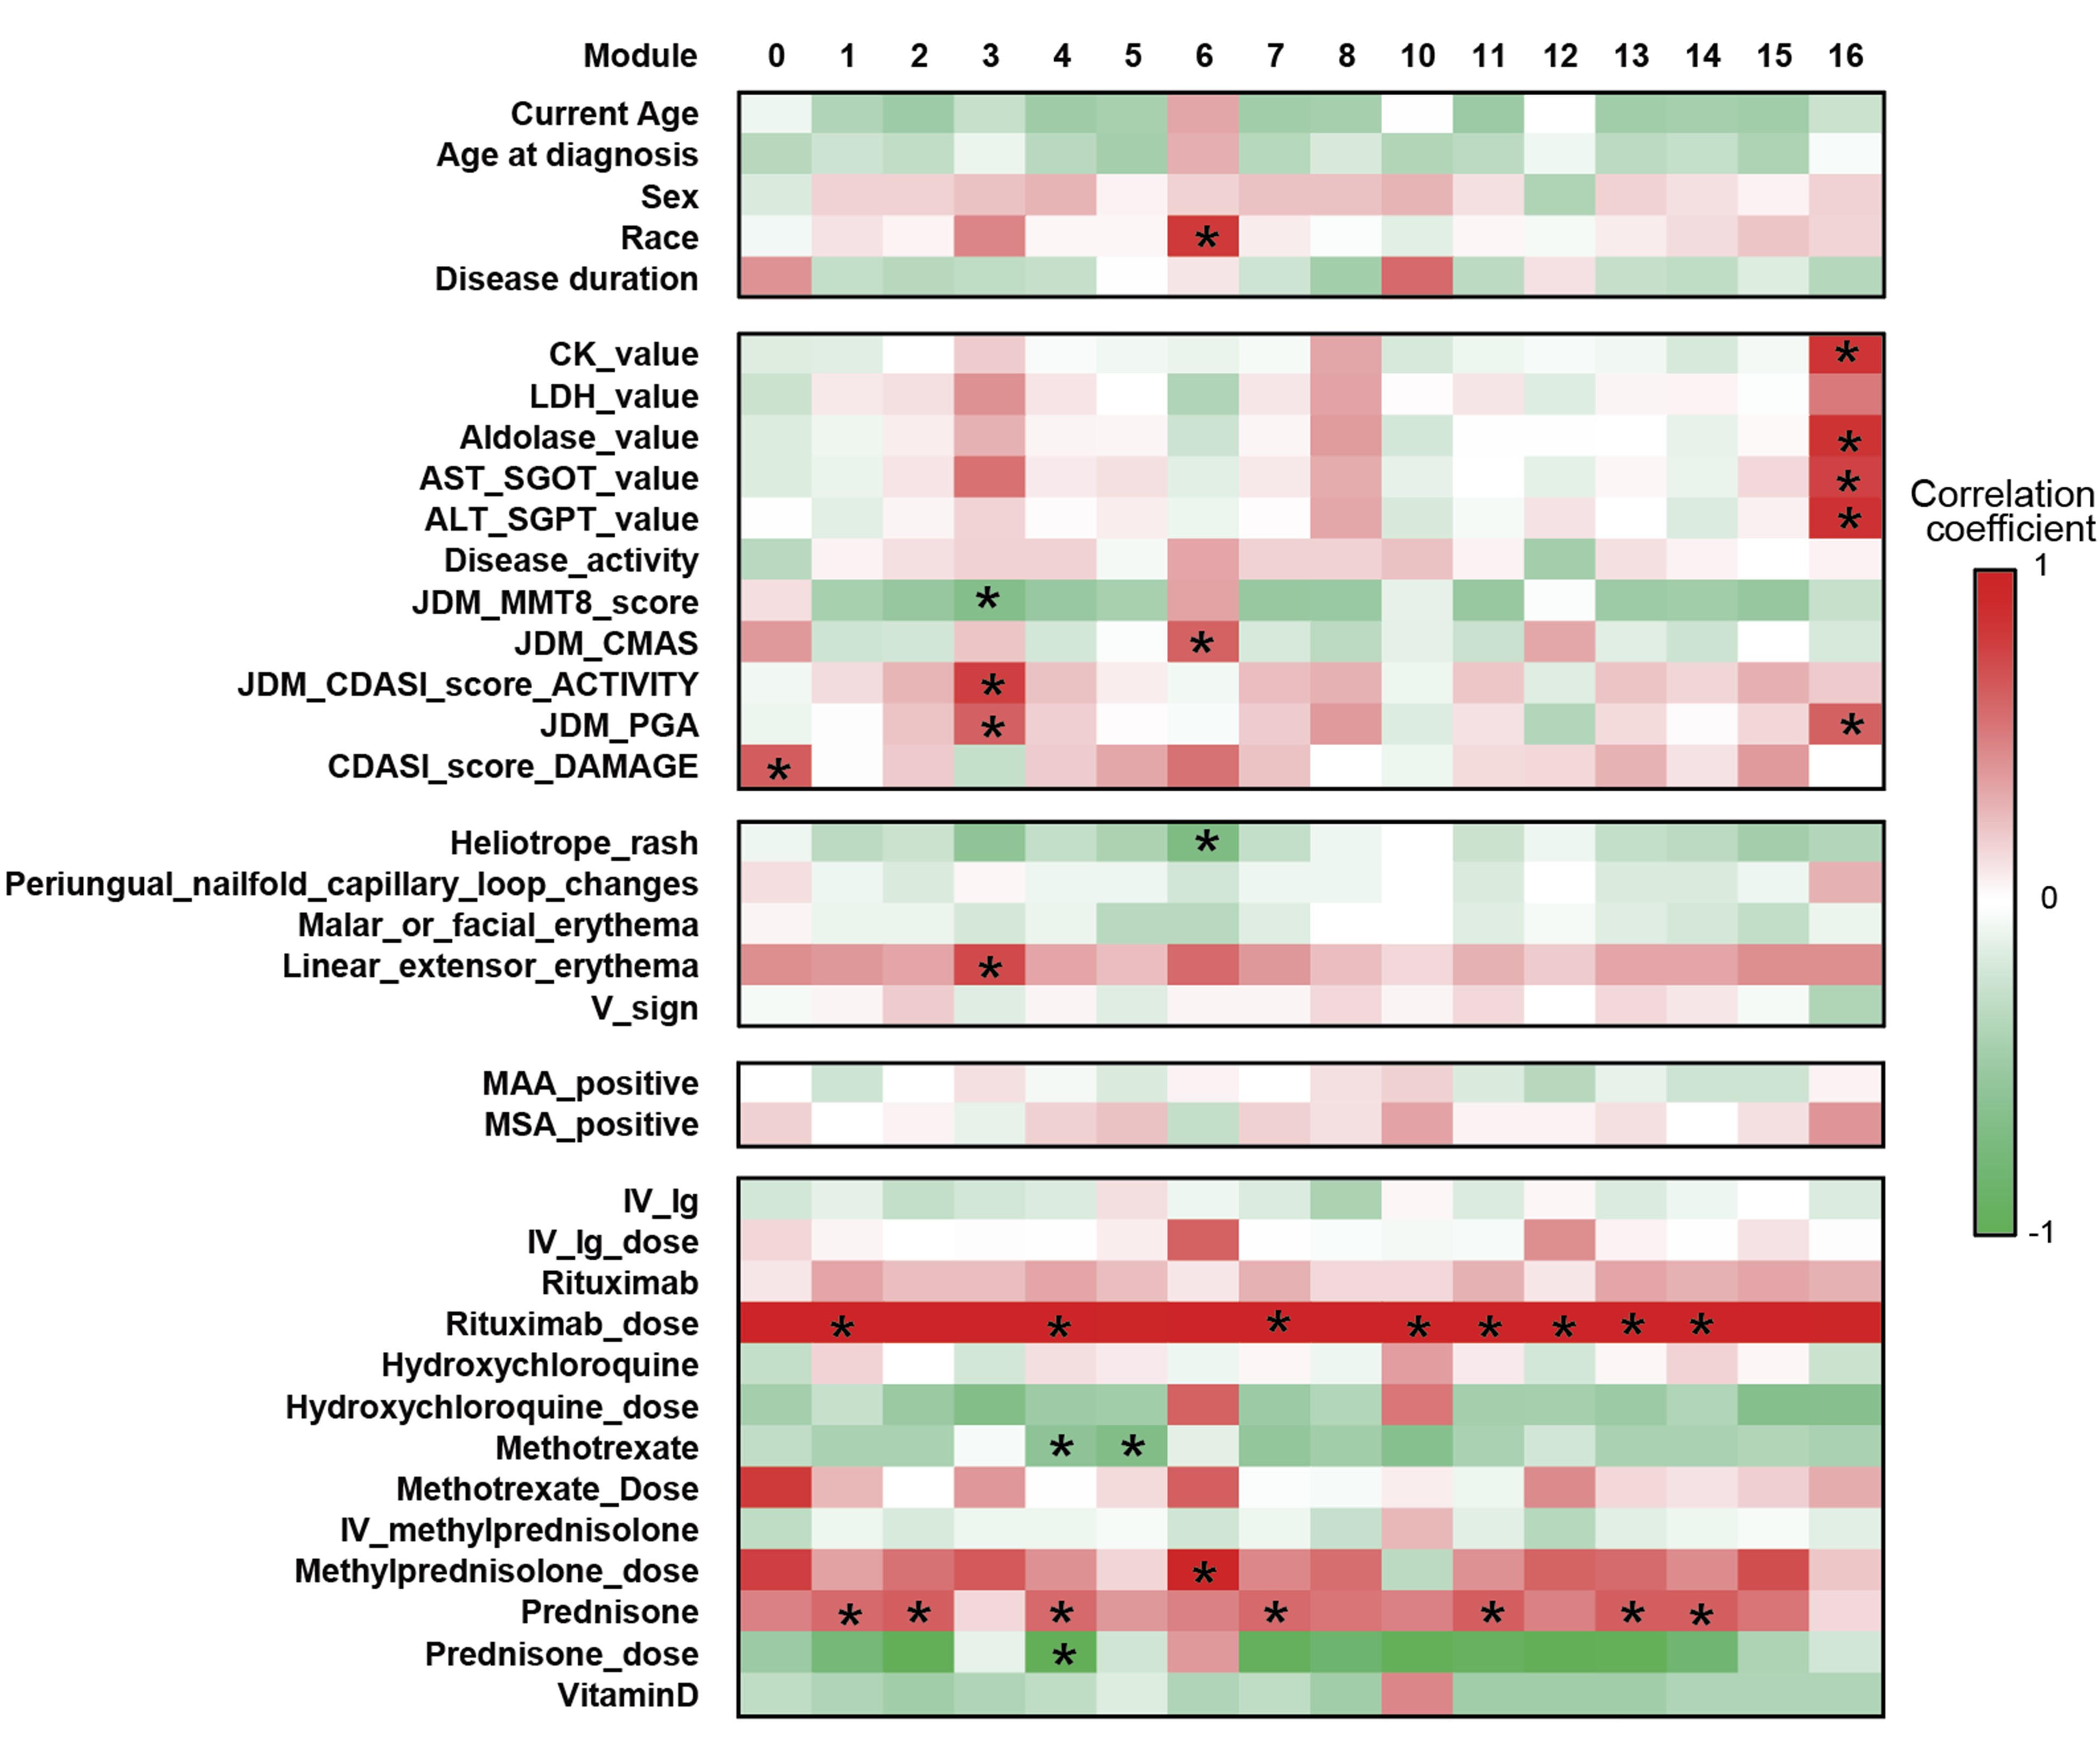
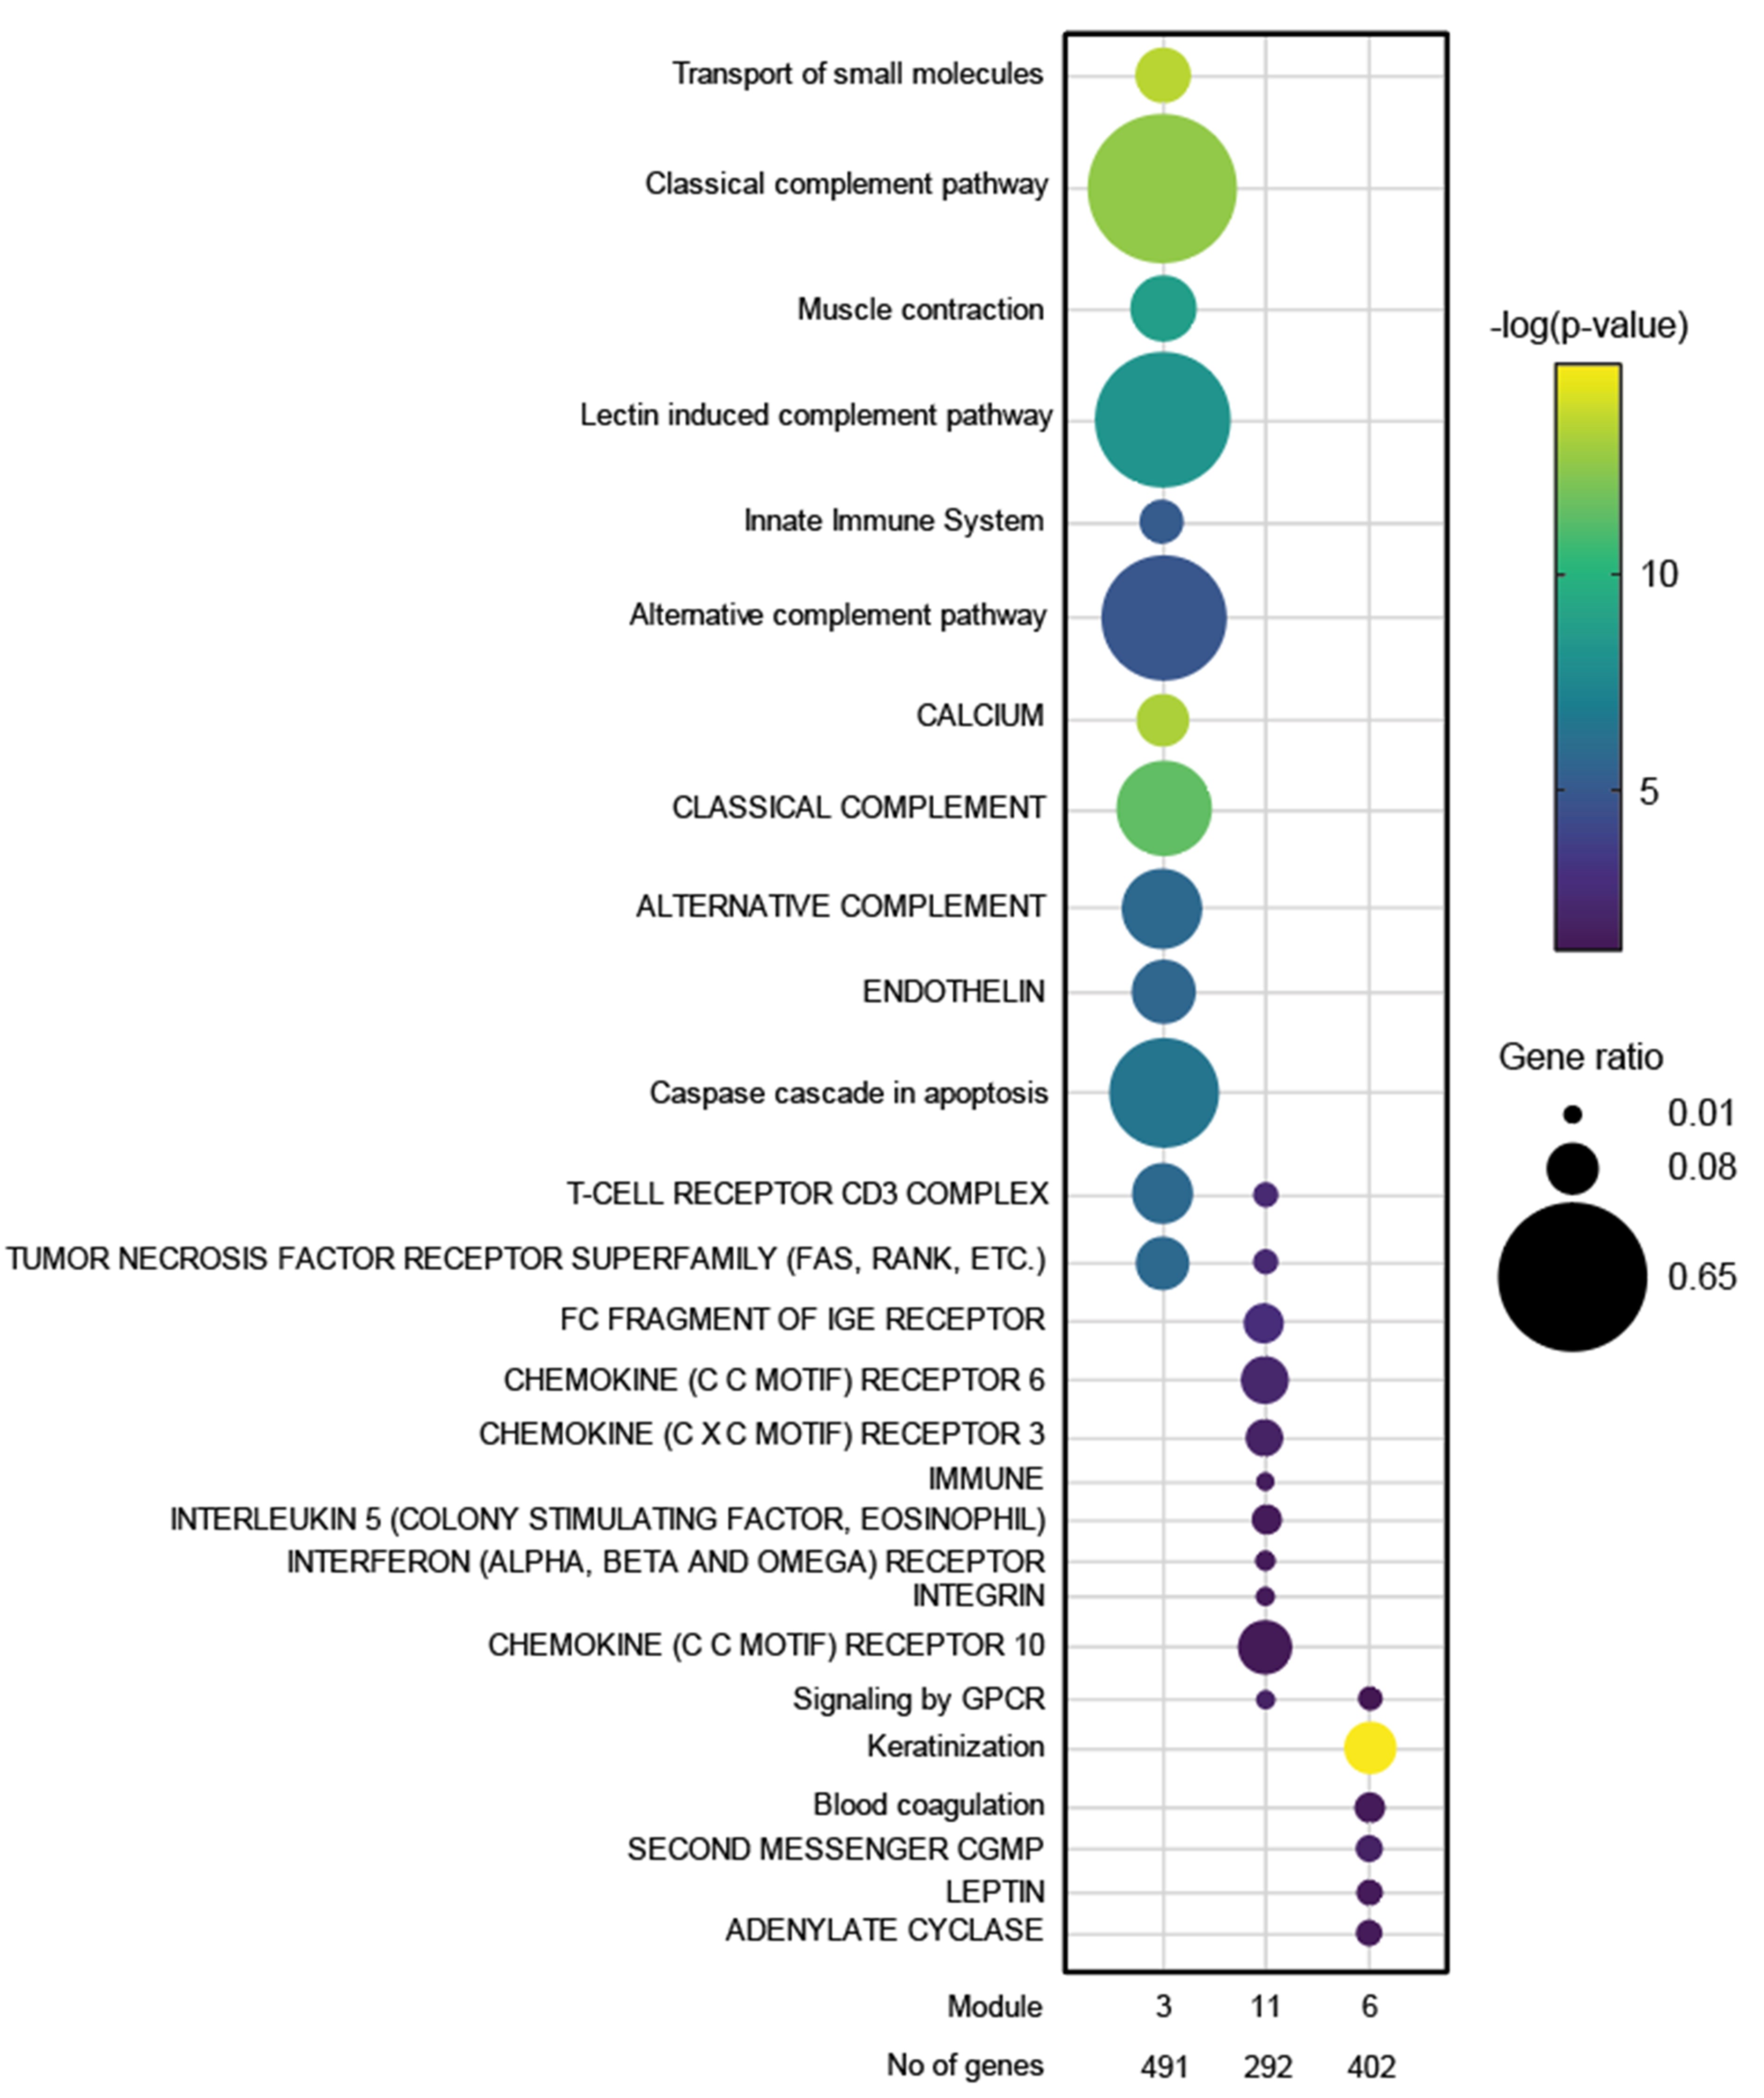
Results: JDM_L compared to CTL revealed 929 upregulated and 53 downregulated genes, with interferon signaling noted as the top upregulated pathway (p< 0.0001). Literature-based central nodes unique to JDM_L included ISG15, ICAM1 and CSF1, genes involved in interferon response, immune cell trafficking and macrophage regulation (Figure 1). JDM_NL demonstrated 4,138 upregulated and 329 downregulated genes compared to CTL, with regulated pathways predominantly involved in metabolism, angiogenesis and calcium signaling. JDM_L and JDM_NL relative to CTL displayed an overlap of 537 DEGs and highlighted common upregulation of the inflammasome pathway (p=0.0129), with increased CASP1, an activator of IL1B and IL18 (Figure 1). WGCNA of JDM_L identified 17 gene modules, with module 3 expression scores being positively associated with CDASI activity (r=0.78, p=0.002) and PGA (r=0.63, p=0.02) and negatively associated with MMT-8 (r=-0.66, p=0.014) (Figure 2). Module 3 was enriched for processes involving complement, innate immune system, apoptosis, T-cell and TNF receptors (Figure 3). Cell type enrichment analysis demonstrated enrichment for myeloid cell signatures, with M1 macrophage signatures in JDM_NL correlating with CDASI activity (r=0.6, p=0.0007), MMT-8 (r=-0.43, p=0.026) and PGA (r=0.39, p=0.042).
Conclusion: Tape stripping in JDM skin is feasible and able to identify gene expression changes associated with disease activity. Further analysis into association of modular expression signatures from tape stripping with disease activity and response to therapy has the potential to develop precision medicine approaches to JDM care.
 Figure 1. Transcriptomic comparison of JDM_L and JDM_NL skin compared to CTL (q-value ≤ 10%) using DEGS to generate GePS networks. The pictures display the 100 best connected genes co-cited in PubMed abstracts in the same sentence linked to a function word (most relevant genes/interactions). Orange represents the genes that are upregulated and green represent the genes that are downregulated in JDM_NL and/or JDM_L compared to CTL.
 Figure 2. Association of gene modules identified by WGCNA with JDM clinical features and disease activity measures. Heatmap displaying the correlation value of z-scores from the JDM_L WGCNA gene expression modules with clinical correlates. Each column represents a gene module, each row represents a different clinical correlate. Correlation coefficients are depicted using the color scale shown with red and green indicating positive and negative correlation respectively. Significant associations on the heatmap are depicted by an asterisk (p-value < 0.05).
 Figure 3. Dot plot representation of the top regulated GePS pathway-based networks (lower case) and pathway transduction networks (upper case) from JDM_L selected WGCNA modules (p < 0.05). The dot size represents the number of genes regulated in each pathway compared to the total number of genes in the pathway (gene ratio). The dot color represents the -log(p-value).
Disclosures: J. Turnier, None; C. Berthier, None; M. McClune, None; S. Vandenbergen, None; J. Gudjonsson, None; A. Tsoi, None; J. Kahlenberg, AstraZeneca, Bristol-Myers Squibb(BMS), Eli Lilly, GlaxoSmithKlein(GSK), Janssen, Merck/MSD, Gilead.
Background/Purpose: Skin inflammation in juvenile dermatomyositis (JDM) frequently persists even in the absence of active muscle disease. Tape stripping is a non-invasive skin sampling method that can be combined with transcriptome profiling to understand the connection of cutaneous signatures to disease activity. The objectives in this study were to 1) define gene expression signatures in lesional and non-lesional JDM skin recovered with tape stripping and 2) determine association of expression signatures with clinical disease activity.
Methods: We utilized tape stripping to collect lesional (L) and non-lesional (NL) skin in a JDM cohort (n=28 with ≥1 NL; n=18 with ≥1 paired L) and healthy controls (CTL; n=20, NL only). JDM patients met 2017 EULAR/ACR classification criteria and had standardized disease activity measures collected, including the Cutaneous Dermatomyositis Disease Area and Severity Index (CDASI), Manual Muscle Testing (MMT-8), and Physician's Global Assessment of Disease Activity (PGA). mRNA was extracted from tape strips and RNA-seq libraries were generated and sequenced through the University of Michigan Advanced Genomics Core. Differentially expressed genes (DEGs; p-adjusted≤10%) between groups were identified using Limma-Voom. Literature-based pathway and network analyses were performed using Ingenuity Pathway Analysis (IPA) and Genomatix Pathway System (GePS). Weighted gene co-expression network analysis (WGCNA) was used to identify gene modules that were correlated with clinical measures. We also performed cell type enrichment analysis (xCell).
Results: JDM_L compared to CTL revealed 929 upregulated and 53 downregulated genes, with interferon signaling noted as the top upregulated pathway (p< 0.0001). Literature-based central nodes unique to JDM_L included ISG15, ICAM1 and CSF1, genes involved in interferon response, immune cell trafficking and macrophage regulation (Figure 1). JDM_NL demonstrated 4,138 upregulated and 329 downregulated genes compared to CTL, with regulated pathways predominantly involved in metabolism, angiogenesis and calcium signaling. JDM_L and JDM_NL relative to CTL displayed an overlap of 537 DEGs and highlighted common upregulation of the inflammasome pathway (p=0.0129), with increased CASP1, an activator of IL1B and IL18 (Figure 1). WGCNA of JDM_L identified 17 gene modules, with module 3 expression scores being positively associated with CDASI activity (r=0.78, p=0.002) and PGA (r=0.63, p=0.02) and negatively associated with MMT-8 (r=-0.66, p=0.014) (Figure 2). Module 3 was enriched for processes involving complement, innate immune system, apoptosis, T-cell and TNF receptors (Figure 3). Cell type enrichment analysis demonstrated enrichment for myeloid cell signatures, with M1 macrophage signatures in JDM_NL correlating with CDASI activity (r=0.6, p=0.0007), MMT-8 (r=-0.43, p=0.026) and PGA (r=0.39, p=0.042).
Conclusion: Tape stripping in JDM skin is feasible and able to identify gene expression changes associated with disease activity. Further analysis into association of modular expression signatures from tape stripping with disease activity and response to therapy has the potential to develop precision medicine approaches to JDM care.
 Figure 1. Transcriptomic comparison of JDM_L and JDM_NL skin compared to CTL (q-value ≤ 10%) using DEGS to generate GePS networks. The pictures display the 100 best connected genes co-cited in PubMed abstracts in the same sentence linked to a function word (most relevant genes/interactions). Orange represents the genes that are upregulated and green represent the genes that are downregulated in JDM_NL and/or JDM_L compared to CTL.
 Figure 2. Association of gene modules identified by WGCNA with JDM clinical features and disease activity measures. Heatmap displaying the correlation value of z-scores from the JDM_L WGCNA gene expression modules with clinical correlates. Each column represents a gene module, each row represents a different clinical correlate. Correlation coefficients are depicted using the color scale shown with red and green indicating positive and negative correlation respectively. Significant associations on the heatmap are depicted by an asterisk (p-value < 0.05).
 Figure 3. Dot plot representation of the top regulated GePS pathway-based networks (lower case) and pathway transduction networks (upper case) from JDM_L selected WGCNA modules (p < 0.05). The dot size represents the number of genes regulated in each pathway compared to the total number of genes in the pathway (gene ratio). The dot color represents the -log(p-value).
 Disclosures: J. Turnier, None; C. Berthier, None; M. McClune, None; S. Vandenbergen, None; J. Gudjonsson, None; A. Tsoi, None; J. Kahlenberg, AstraZeneca, Bristol-Myers Squibb(BMS), Eli Lilly, GlaxoSmithKlein(GSK), Janssen, Merck/MSD, Gilead.

