Back
Poster Session C
Spondyloarthritis (SpA) including psoriatic arthritis (PsA)
Session: (1486–1517) Spondyloarthritis Including PsA – Diagnosis, Manifestations, and Outcomes Poster III
1500: Investigating Serum Lipids Classifying Psoriatic Arthritis Disease Activity Using Solid Phase Microextraction – Liquid Chromatography – High-Resolution Mass Spectrometry
Sunday, November 13, 2022
1:00 PM – 3:00 PM Eastern Time
Location: Virtual Poster Hall
- JK
John Koussiouris, BSc
McMaster University Medical School
Toronto, ON, Canada
Abstract Poster Presenter(s)
John Koussiouris1, Nikita Looby2, Max Kotlyar3, Vathany Kulasingam4, Igor Jurisica5 and Vinod Chandran6, 1Department of Laboratory Medicine and Pathobiology, University of Toronto/ Schroeder Arthritis Institute, Krembil Research Institute, University Health Network, Toronto, ON, Canada, 2Schroeder Arthritis Institute, Krembil Research Institute, University Health Network, Toronto, ON, Canada, 3Osteoarthritis Research Program, Division of Orthopedic Surgery, Schroeder Arthritis Institute/ Data Science Discovery Centre for Chronic Diseases, Krembil Research Institute, University Health Network, Toronto, ON, Canada, 4Department of Laboratory Medicine and Pathobiology, University of Toronto/ Division of Clinical Biochemistry, Laboratory Medicine Program, University Health Network, Toronto, ON, Canada, 5Osteoarthritis Research Program, Division of Orthopedic Surgery, Schroeder Arthritis Institute, University Health Network/ Departments of Medical Biophysics and Computer Science, University of Toronto, Toronto, ON, Canada, 6Departments of Medicine and Laboratory Medicine and Pathobiology, University of Toronto/ Schroeder Arthritis Institute, Krembil Research Institute, University Health Network, Toronto, ON, Canada
Background/Purpose: Psoriasis is an inflammatory skin disease that affects over 7.25 million Americans and 1.25 million Canadians. Approximately 25% of psoriasis patients, have an inflammatory arthritis termed psoriatic arthritis (PsA). PsA is a heterogeneous disease and therefore accurate assessment of disease activity is difficult. There are currently no clinically validated biomarkers for PsA disease activity. We therefore applied solid phase microextraction (SPME) – liquid chromatography – high resolution mass spectrometry (LC-HRMS) based lipidomics method to serum samples collected from PsA patients, to identify a panel of lipids that classify levels of PsA disease activity.
Methods: Serum samples were obtained from the University of Toronto Psoriatic Disease Research Program Biobank from PsA patients not previously treated with biologics and with no active infection or history of cancer. Patients were classified as having low (n=134), moderate (n=134), or high (n=104) disease activity, based on Psoriatic Arthritis Disease Activity Scores (PASDAS). Serum samples were prepared using SPME, which consisted of a thin stainless-steel blade coated with HLB and PS-DVB-WAX particles. After sample processing, LC-HRMS was performed using a Vanquish Flex autosampler and pump coupled to a Q-Exactive Plus Hybrid Quadrupole-Orbitrap Mass Spectrometer. Data pre-preprocessing and feature identification were performed using Compound Discoverer 3.3. Classification analysis was performed using area under the receiver operating characteristic (AUROC) curve with five models: linear discriminant analysis, Naïve Bayes, support vector machine, logistic regression and random forest. Only models with an area under the curve of 0.7 or greater were considered to include candidate biomarkers.
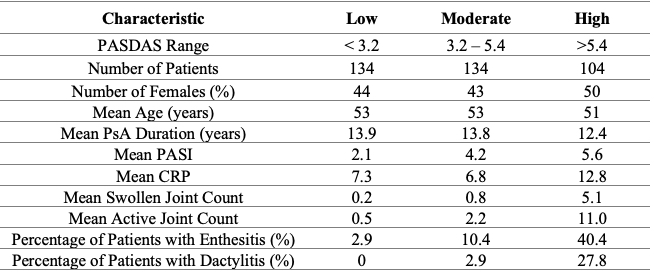
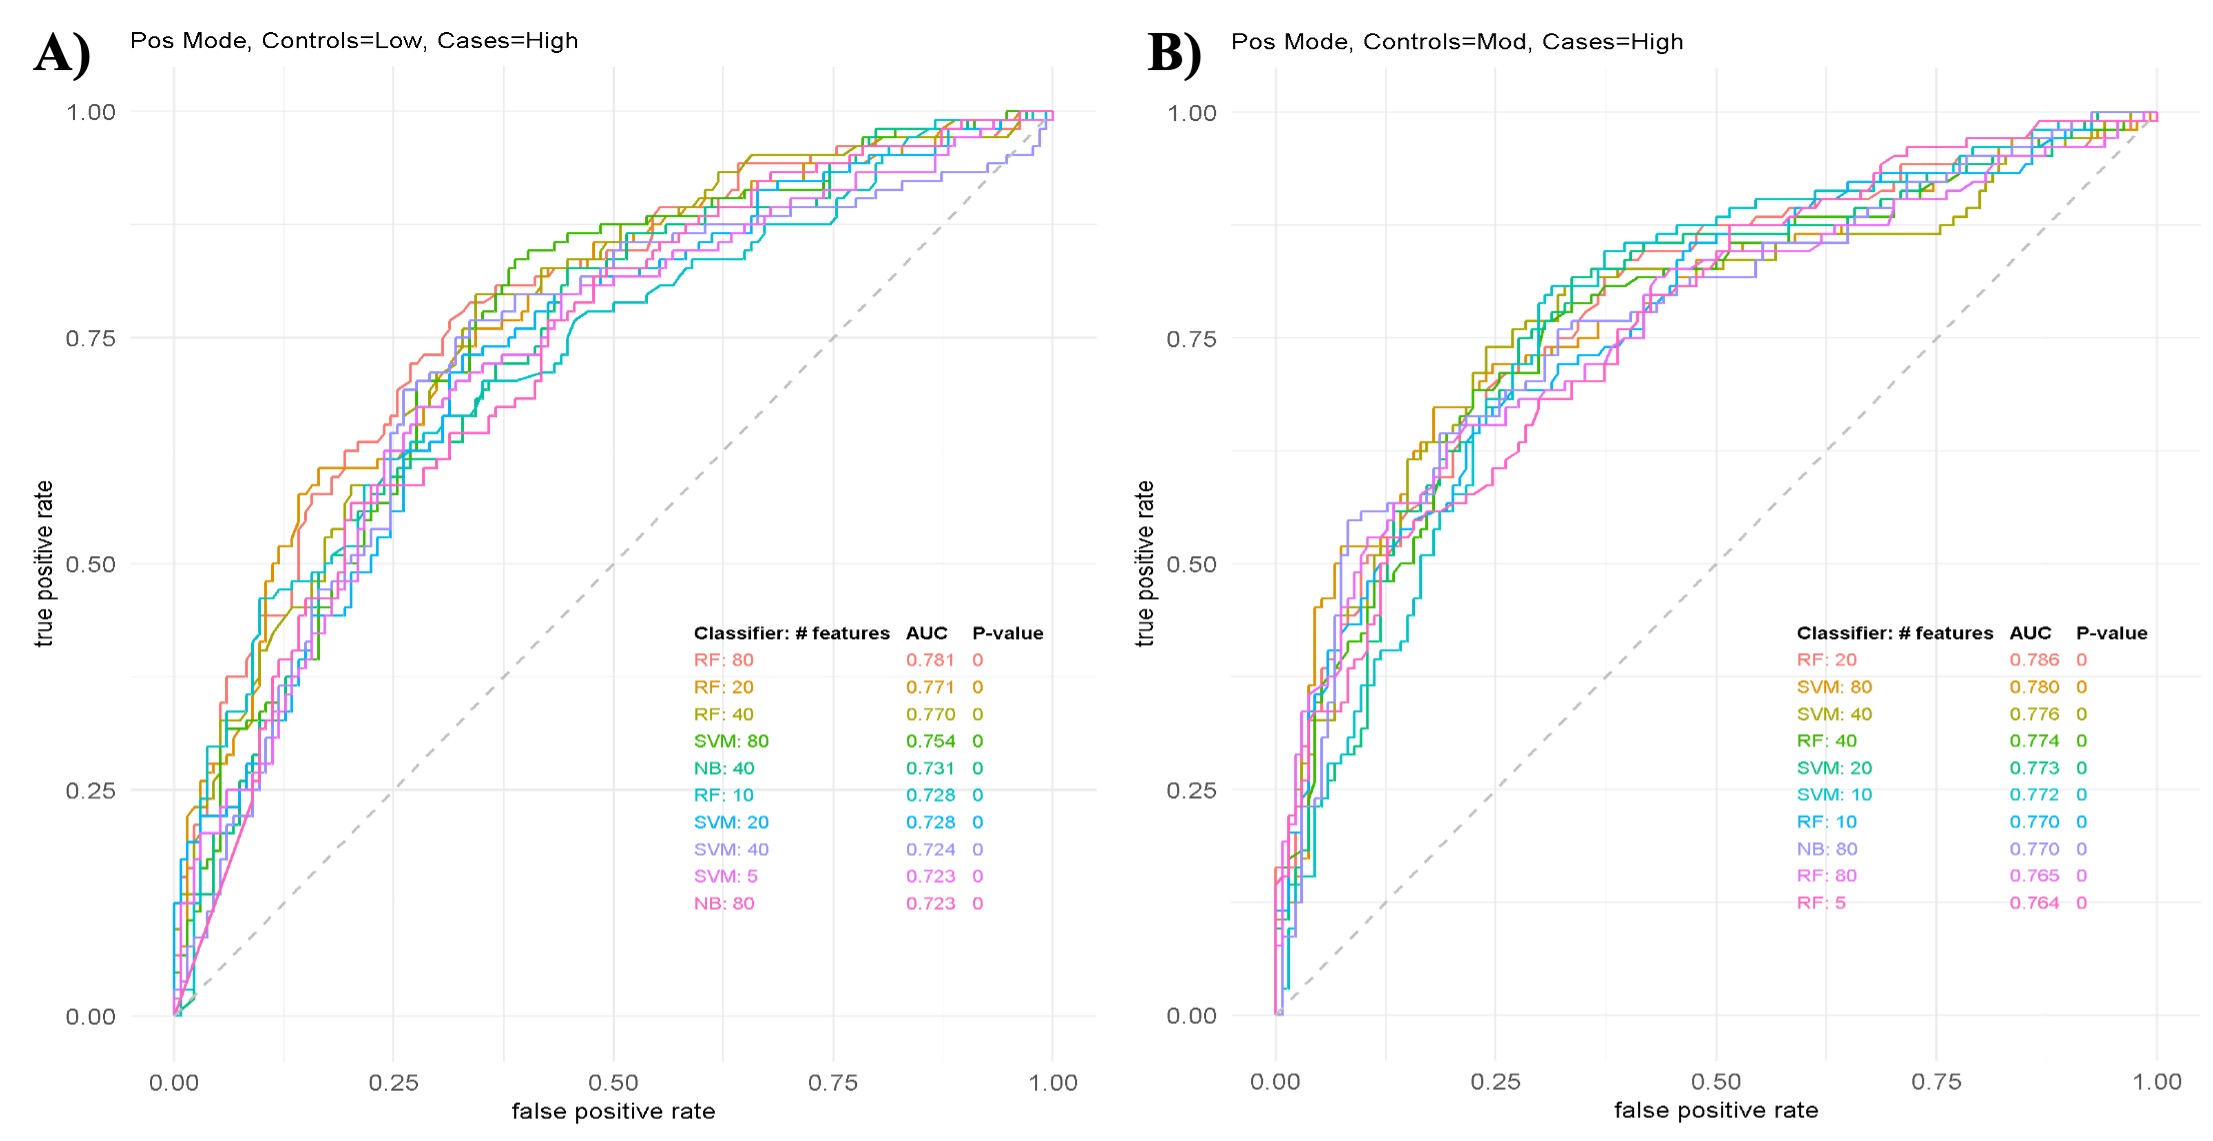
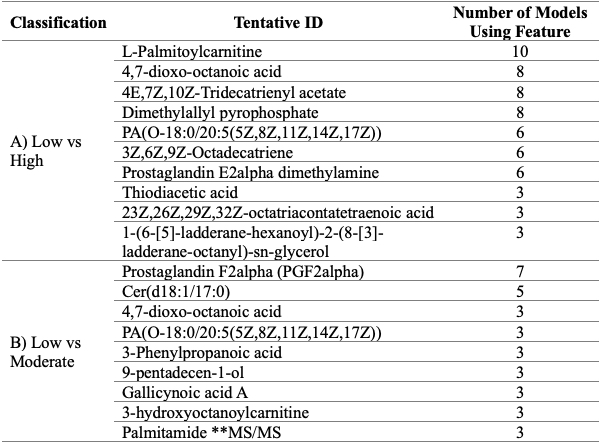
Results: A total of 372 patients with PsA, categorized as low, moderate and high disease activity were analyzed (see Table 1 for patient demographics). Five features classified moderate disease activity from low disease activity and three features classified high disease activity from low disease activity. None of these features however could be identified using currently available spectral databases. A combination of several lipids could classify disease activity in various classifying models. These models were able to classify high disease activity from both low and moderate disease activity with as little as five features (Figure 1). Lipids of key interest included palmitamide which was confirmed using MS/MS as well as features that appeared in multiple classifying models such as acylcarnitines, eicosanoids and fatty acids (Table 2).
Conclusion: Individual metabolites may be able to classify global PsA disease activity; however, identification of said metabolites with available databases remains a challenge. Higher levels of classification were achieved when multiple individual lipid markers (acylcarnitines, eicosanoids and fatty acids) were combined into a single multivariate model. Quantitative LC-MS assays based on selected reaction monitoring are recommended to quantify and further validate the candidate biomarkers identified.
 Table 1: Patient demographics.
 Figure 1: Top performing classifying models. A) ROC curves for models using feature combinations to classify low and high disease activity. B) ROC curves of models using feature combinations to classify moderate and high disease activity Abbreviations: ROC, receiver operating characteristic; SVM, support vector machine; LR, logistic regression; NB, Naïve Bayes; LDA, linear discriminant analysis; RF, random forest.
 Table 2: Tentatively identified compounds in the top performing classification models. **MS/MS signifies that the compound’s identity was confirmed using MS/MS.
Disclosures: J. Koussiouris, None; N. Looby, None; M. Kotlyar, None; V. Kulasingam, None; I. Jurisica, None; V. Chandran, AbbVie, AstraZeneca, Bristol-Myers Squibb, Eli Lilly, Janssen, Novartis, Amgen, Pfizer Inc, UCB.
Background/Purpose: Psoriasis is an inflammatory skin disease that affects over 7.25 million Americans and 1.25 million Canadians. Approximately 25% of psoriasis patients, have an inflammatory arthritis termed psoriatic arthritis (PsA). PsA is a heterogeneous disease and therefore accurate assessment of disease activity is difficult. There are currently no clinically validated biomarkers for PsA disease activity. We therefore applied solid phase microextraction (SPME) – liquid chromatography – high resolution mass spectrometry (LC-HRMS) based lipidomics method to serum samples collected from PsA patients, to identify a panel of lipids that classify levels of PsA disease activity.
Methods: Serum samples were obtained from the University of Toronto Psoriatic Disease Research Program Biobank from PsA patients not previously treated with biologics and with no active infection or history of cancer. Patients were classified as having low (n=134), moderate (n=134), or high (n=104) disease activity, based on Psoriatic Arthritis Disease Activity Scores (PASDAS). Serum samples were prepared using SPME, which consisted of a thin stainless-steel blade coated with HLB and PS-DVB-WAX particles. After sample processing, LC-HRMS was performed using a Vanquish Flex autosampler and pump coupled to a Q-Exactive Plus Hybrid Quadrupole-Orbitrap Mass Spectrometer. Data pre-preprocessing and feature identification were performed using Compound Discoverer 3.3. Classification analysis was performed using area under the receiver operating characteristic (AUROC) curve with five models: linear discriminant analysis, Naïve Bayes, support vector machine, logistic regression and random forest. Only models with an area under the curve of 0.7 or greater were considered to include candidate biomarkers.
Results: A total of 372 patients with PsA, categorized as low, moderate and high disease activity were analyzed (see Table 1 for patient demographics). Five features classified moderate disease activity from low disease activity and three features classified high disease activity from low disease activity. None of these features however could be identified using currently available spectral databases. A combination of several lipids could classify disease activity in various classifying models. These models were able to classify high disease activity from both low and moderate disease activity with as little as five features (Figure 1). Lipids of key interest included palmitamide which was confirmed using MS/MS as well as features that appeared in multiple classifying models such as acylcarnitines, eicosanoids and fatty acids (Table 2).
Conclusion: Individual metabolites may be able to classify global PsA disease activity; however, identification of said metabolites with available databases remains a challenge. Higher levels of classification were achieved when multiple individual lipid markers (acylcarnitines, eicosanoids and fatty acids) were combined into a single multivariate model. Quantitative LC-MS assays based on selected reaction monitoring are recommended to quantify and further validate the candidate biomarkers identified.
 Table 1: Patient demographics.
 Figure 1: Top performing classifying models. A) ROC curves for models using feature combinations to classify low and high disease activity. B) ROC curves of models using feature combinations to classify moderate and high disease activity Abbreviations: ROC, receiver operating characteristic; SVM, support vector machine; LR, logistic regression; NB, Naïve Bayes; LDA, linear discriminant analysis; RF, random forest.
 Table 2: Tentatively identified compounds in the top performing classification models. **MS/MS signifies that the compound’s identity was confirmed using MS/MS.
Disclosures: J. Koussiouris, None; N. Looby, None; M. Kotlyar, None; V. Kulasingam, None; I. Jurisica, None; V. Chandran, AbbVie, AstraZeneca, Bristol-Myers Squibb, Eli Lilly, Janssen, Novartis, Amgen, Pfizer Inc, UCB.

