Back
Poster Session C
Genetics, genomics and proteomics
Session: (1118–1149) Genetics, Genomics and Proteomics Poster
1147: Transcriptomic Changes Induced by Tocilizumab in Ex-Vivo PBMCs from Patients with GCA in Remission. Predictors of Response
Sunday, November 13, 2022
1:00 PM – 3:00 PM Eastern Time
Location: Virtual Poster Hall
- FK
FARAH KAMBEROVIC, MSc
Faculty of Medicine, University of Barcelona
Barcelona, Spain
Abstract Poster Presenter(s)
Marco A Alba1, Roser Alba1, Georgina Espigol Frigolé2, Javier Marco Hernández2, Sergio Prieto2, Marc Corbera-Bellalta3 and Maria C Cid3, 1IDIBAPS, Barcelona, Spain, 2Hospital Clínic de Barcelona, Barcelona, Spain, 3Hospital Clinic, University of Barcelona, Barcelona, Spain
Background/Purpose: Glucocorticoids (GCs) are only effective therapy able to induce disease remission, but most patients relapse when GC are tapered and suffer from GC-related toxicity. Interleukin 6 (IL-6) may play a pivotal role in GCA pathogenesis since its transcripts are increased in vascular lesions and elevated serum levels have been reported in active GCA patients. Blocking IL-6 receptor with tocilizumab (TCZ) has demonstrated effectiveness in reducing GCA flares and sparing GC. However, 40% of patients still relapse when GCs are discontinued, indicating heterogeneity in TCZ-response. Therefore, identifying predictors of response to TCZ is crucial. The aim of this study was to investigate transcriptomic changes induced by IL-6 and IL-6 +TCZ on ex-vivo PBMCs from patients in clinical remission.
Methods: PBMCs were isolated from 17 patients consecutively recruited from outpatient visits and 5 age and sex – matched controls, using Lymphoprep™ density gradient. Fourteen patients were receiving prednisone (< 5mg/day) and 4 patients were in sustained remission without treatment. PBMCs were exposed to recombinant human (rh) IL-6 (IL6 group) (20 ng/ml) and combination of rhIL-6 and tocilizumab (20 µg/ml) (TCZ+IL6 group) and cultured for 24h.Total RNA was extracted from cells using TRIzol™ reagent. RNA (100ng/sample) was processed using nCounter Prep Station screening for 256 genes from Human Inflammation Nanostring panel. Barcode counts were processed with nSolver 4.0 Software. Normalized data were analysed using R Studio 4.0.3 and GraphPad Prism v 9.0.
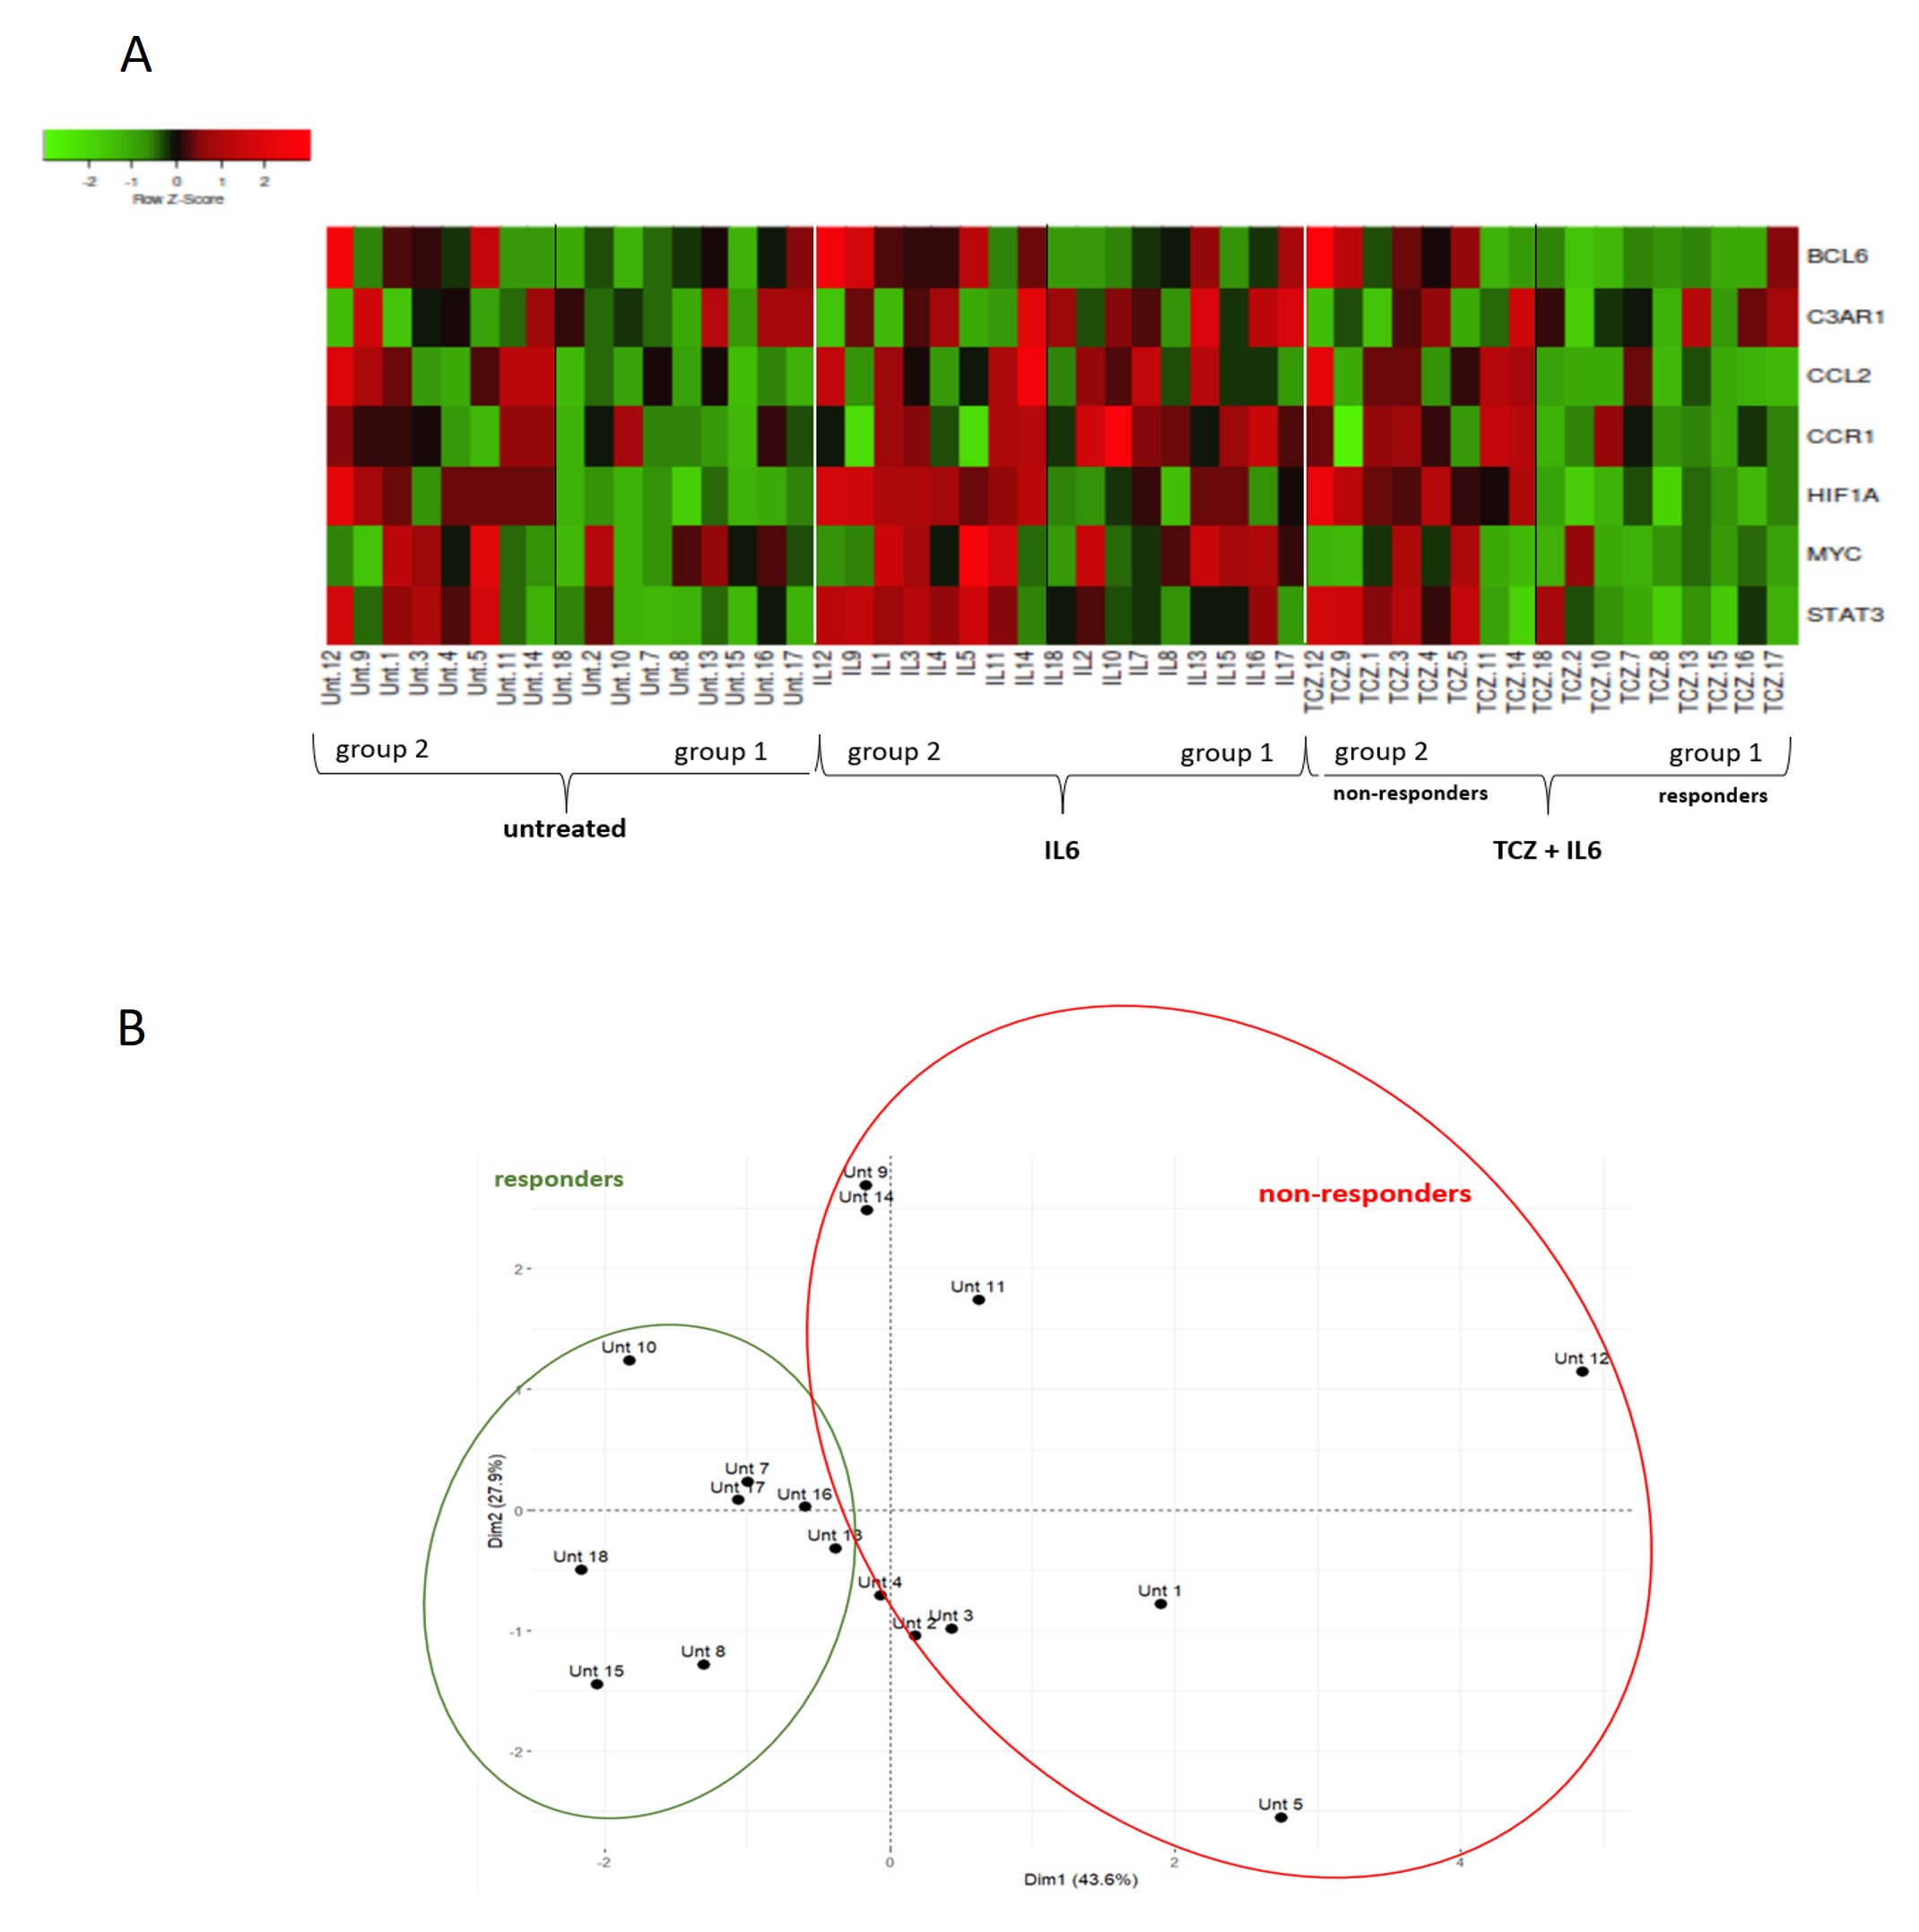
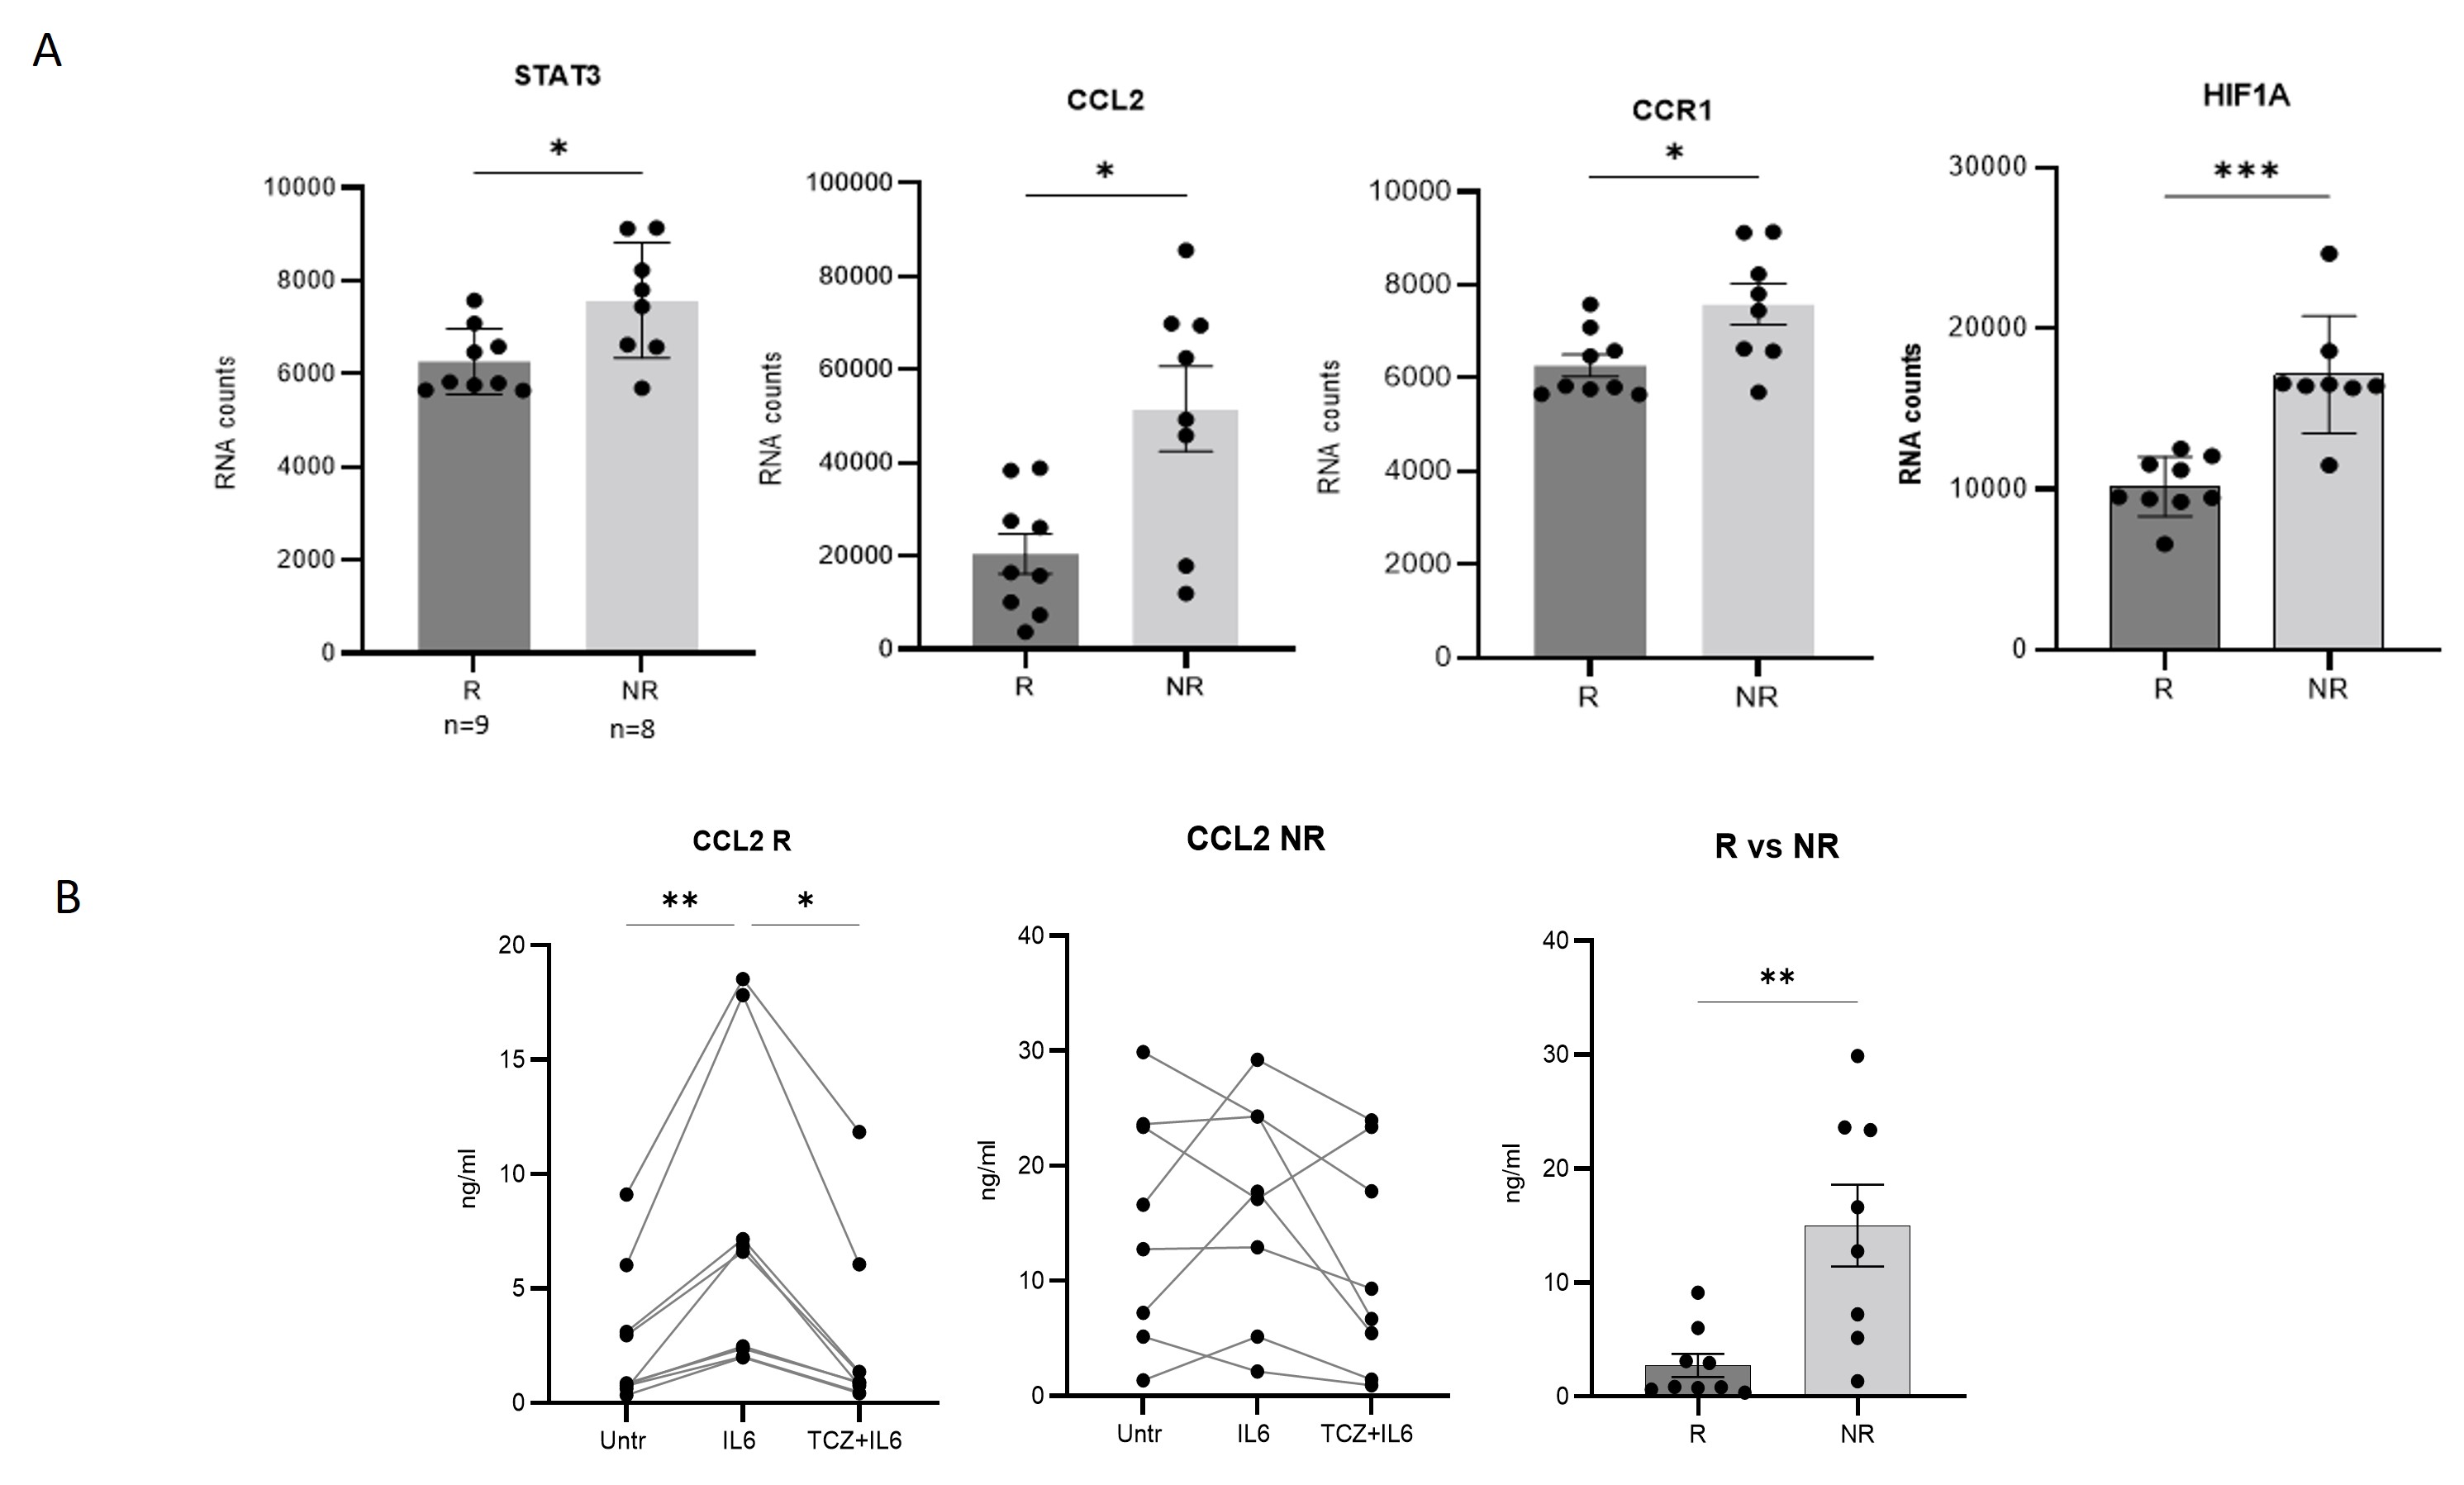
Results: After stimulation with IL-6, 12 transcripts were increased and 34 decreased respect to baseline condition. A total of 113 transcripts were differentially expressed between IL-6 group and IL-6+TCZ group (Fig 1). After correction for multiple comparisons, 73 transcripts remained significant (FDR< 0.05) of which only 7 were increased with IL-6 stimulation and decreased expression after exposure to TCZ: STAT3, HIF1A, CCL2, CCR1, BCL6, MYC, TLR2 and C3AR1; all of them being target genes of STAT3. Mapping these genes showed 2 clusters that differ in gene expression in response to TCZ. Group 1 ("responders", R) decreased expression of these 7 transcripts after exposure to TCZ and in group 2 ("non-responders",NR) there were no changes in transcripts between conditions (Fig 2A). PCA analysis confirmed 2 distinct patient groups (Fig 2B). Four of 7 genes were differentially expressed between R and NR (STAT3, HIF1A, CCR1 and CCL2) at baseline (untreated) condition, with NR having higher levels than R (Fig 3A). As CCL2 is a soluble cytokine, its concentration was measured by immunoassay in cell culture fluid and results again showed higher levels of protein in NR than R (Fig 3B).
Conclusion: Tocilizumab reduces expression of STAT3 and 7 other transcripts downstream from STAT3. Two clusters of patients with different response pattern to TCZ were identified with higher levels of STAT3, HIF1A and CCL2 in NR. Results indicate that these molecules could be potential predictors of response to TCZ. Validation on a new patient cohort is in process. Project was funded by HORIZON 2020 programe (MSCA agreement No.813545) and Spanish Ministry for Science and Innovation (No.PID2020-114909RB-I00).
.jpg) Figure 1. Differentially expressed genes (RNA counts, nCounter) between baseline condition (untreated PBMCs) vs IL-6 stimulation (A) and IL6 group vs TCZ+IL6 group (B).
Figure 1. Differentially expressed genes (RNA counts, nCounter) between baseline condition (untreated PBMCs) vs IL-6 stimulation (A) and IL6 group vs TCZ+IL6 group (B).
 Figure 2. Heatmap (A) and PCA (B) of 7 genes that increased expression with IL-6 stimulation and decreased after exposure to TCZ revealing 2 different groups of patients that respond and cluster differently in response to tocilizumab.
 Figure 3. Baseline expression levels of differentially expressed transcripts (STAT3, HIF1A, CCR1 and CCL2) between R and NR (RNA counts)(A) and expression of soluble CCL2 between R and NR on protein level (B).
Disclosures: M. Alba, None; R. Alba, None; G. Espigol Frigolé, GlaxoSmithKlein(GSK); J. Hernández, None; S. Prieto, None; M. Corbera-Bellalta, None; M. Cid, GlaxoSmithKlein(GSK), VIFOR PHARMA, KINIKSA, GlaxoSmithKlein(GSK), Roche, VIFOR PHARMA, KINIKSA, Roche.
Background/Purpose: Glucocorticoids (GCs) are only effective therapy able to induce disease remission, but most patients relapse when GC are tapered and suffer from GC-related toxicity. Interleukin 6 (IL-6) may play a pivotal role in GCA pathogenesis since its transcripts are increased in vascular lesions and elevated serum levels have been reported in active GCA patients. Blocking IL-6 receptor with tocilizumab (TCZ) has demonstrated effectiveness in reducing GCA flares and sparing GC. However, 40% of patients still relapse when GCs are discontinued, indicating heterogeneity in TCZ-response. Therefore, identifying predictors of response to TCZ is crucial. The aim of this study was to investigate transcriptomic changes induced by IL-6 and IL-6 +TCZ on ex-vivo PBMCs from patients in clinical remission.
Methods: PBMCs were isolated from 17 patients consecutively recruited from outpatient visits and 5 age and sex – matched controls, using Lymphoprep™ density gradient. Fourteen patients were receiving prednisone (< 5mg/day) and 4 patients were in sustained remission without treatment. PBMCs were exposed to recombinant human (rh) IL-6 (IL6 group) (20 ng/ml) and combination of rhIL-6 and tocilizumab (20 µg/ml) (TCZ+IL6 group) and cultured for 24h.Total RNA was extracted from cells using TRIzol™ reagent. RNA (100ng/sample) was processed using nCounter Prep Station screening for 256 genes from Human Inflammation Nanostring panel. Barcode counts were processed with nSolver 4.0 Software. Normalized data were analysed using R Studio 4.0.3 and GraphPad Prism v 9.0.
Results: After stimulation with IL-6, 12 transcripts were increased and 34 decreased respect to baseline condition. A total of 113 transcripts were differentially expressed between IL-6 group and IL-6+TCZ group (Fig 1). After correction for multiple comparisons, 73 transcripts remained significant (FDR< 0.05) of which only 7 were increased with IL-6 stimulation and decreased expression after exposure to TCZ: STAT3, HIF1A, CCL2, CCR1, BCL6, MYC, TLR2 and C3AR1; all of them being target genes of STAT3. Mapping these genes showed 2 clusters that differ in gene expression in response to TCZ. Group 1 ("responders", R) decreased expression of these 7 transcripts after exposure to TCZ and in group 2 ("non-responders",NR) there were no changes in transcripts between conditions (Fig 2A). PCA analysis confirmed 2 distinct patient groups (Fig 2B). Four of 7 genes were differentially expressed between R and NR (STAT3, HIF1A, CCR1 and CCL2) at baseline (untreated) condition, with NR having higher levels than R (Fig 3A). As CCL2 is a soluble cytokine, its concentration was measured by immunoassay in cell culture fluid and results again showed higher levels of protein in NR than R (Fig 3B).
Conclusion: Tocilizumab reduces expression of STAT3 and 7 other transcripts downstream from STAT3. Two clusters of patients with different response pattern to TCZ were identified with higher levels of STAT3, HIF1A and CCL2 in NR. Results indicate that these molecules could be potential predictors of response to TCZ. Validation on a new patient cohort is in process. Project was funded by HORIZON 2020 programe (MSCA agreement No.813545) and Spanish Ministry for Science and Innovation (No.PID2020-114909RB-I00).
.jpg) Figure 1. Differentially expressed genes (RNA counts, nCounter) between baseline condition (untreated PBMCs) vs IL-6 stimulation (A) and IL6 group vs TCZ+IL6 group (B).
Figure 1. Differentially expressed genes (RNA counts, nCounter) between baseline condition (untreated PBMCs) vs IL-6 stimulation (A) and IL6 group vs TCZ+IL6 group (B). Figure 2. Heatmap (A) and PCA (B) of 7 genes that increased expression with IL-6 stimulation and decreased after exposure to TCZ revealing 2 different groups of patients that respond and cluster differently in response to tocilizumab.
 Figure 3. Baseline expression levels of differentially expressed transcripts (STAT3, HIF1A, CCR1 and CCL2) between R and NR (RNA counts)(A) and expression of soluble CCL2 between R and NR on protein level (B).
Disclosures: M. Alba, None; R. Alba, None; G. Espigol Frigolé, GlaxoSmithKlein(GSK); J. Hernández, None; S. Prieto, None; M. Corbera-Bellalta, None; M. Cid, GlaxoSmithKlein(GSK), VIFOR PHARMA, KINIKSA, GlaxoSmithKlein(GSK), Roche, VIFOR PHARMA, KINIKSA, Roche.

