Back
Poster Session B
Systemic lupus erythematosus (SLE)
Session: (0629–0670) SLE – Etiology and Pathogenesis Poster
0664: Development of a Novel Gene Expression-based Molecular Score That Characterizes Individual Lupus Patients
Sunday, November 13, 2022
9:00 AM – 10:30 AM Eastern Time
Location: Virtual Poster Hall
- PB
Prathyusha Bachali, MS
AMPEL BioSolutions
Redmond, WA, United States
Abstract Poster Presenter(s)
Prathyusha Bachali1, Erika Hubbard2, Kathryn Kingsmore Allison2, Yisha He2, Amrie Grammer3 and Peter Lipsky2, 1AMPEL BioSolutions, Redmond, WA, 2AMPEL BioSolutions, Charlottesville, VA, 3AMPEL LLC, Charlottesville, VA
Background/Purpose: Patients with SLE can exhibit considerable clinical heterogeneity. A robust patient stratification approach can help to characterize individual lupus patients more effectively based on their molecular profile. Machine learning (ML) and analysis of molecular profiles can help to classify lupus patients more precisely, but proper validation is required for clinical implementation of these methods by rheumatologists.
Methods: This study comprised 3,166 lupus samples extracted from 17 lupus blood gene expression datasets. Gene set variation analysis (GSVA) was carried out on each normalized dataset using 32 cell and process gene modules and resulting module enrichment scores were used as input into stable k-means clustering to subset lupus patients based on their gene expression profiles. We employed five different classification models including logistic regression (LR), Support Vector Machine (SVM), random forest (RF), and neural network to classify the lupus patients into patient subsets determined by k-means. The OnevsOne multi-class classification approach was used to avoid class imbalance. SHapley Additive exPlanations (SHAP) values were calculated for each patient subset to determine the most important features used in model prediction. The abnormalities of each lupus subset were summarized by a composite score developed by ridge regression modeling.
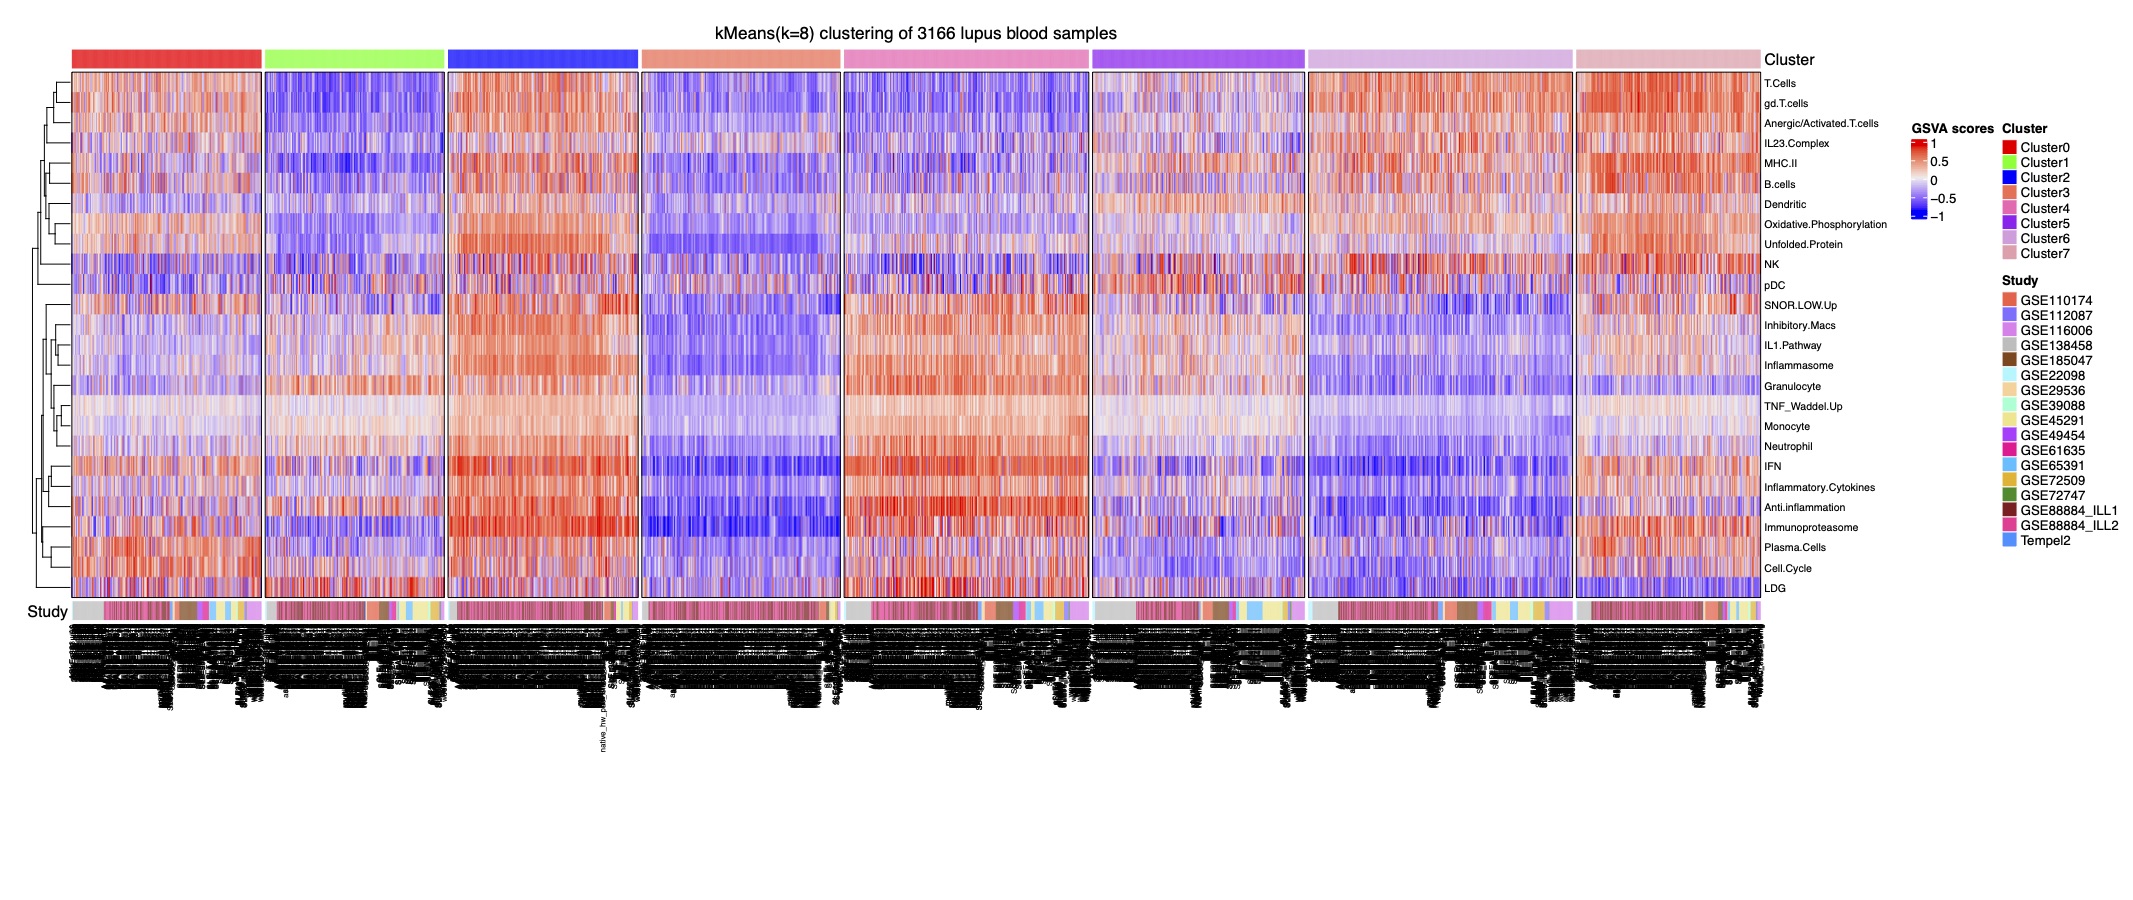
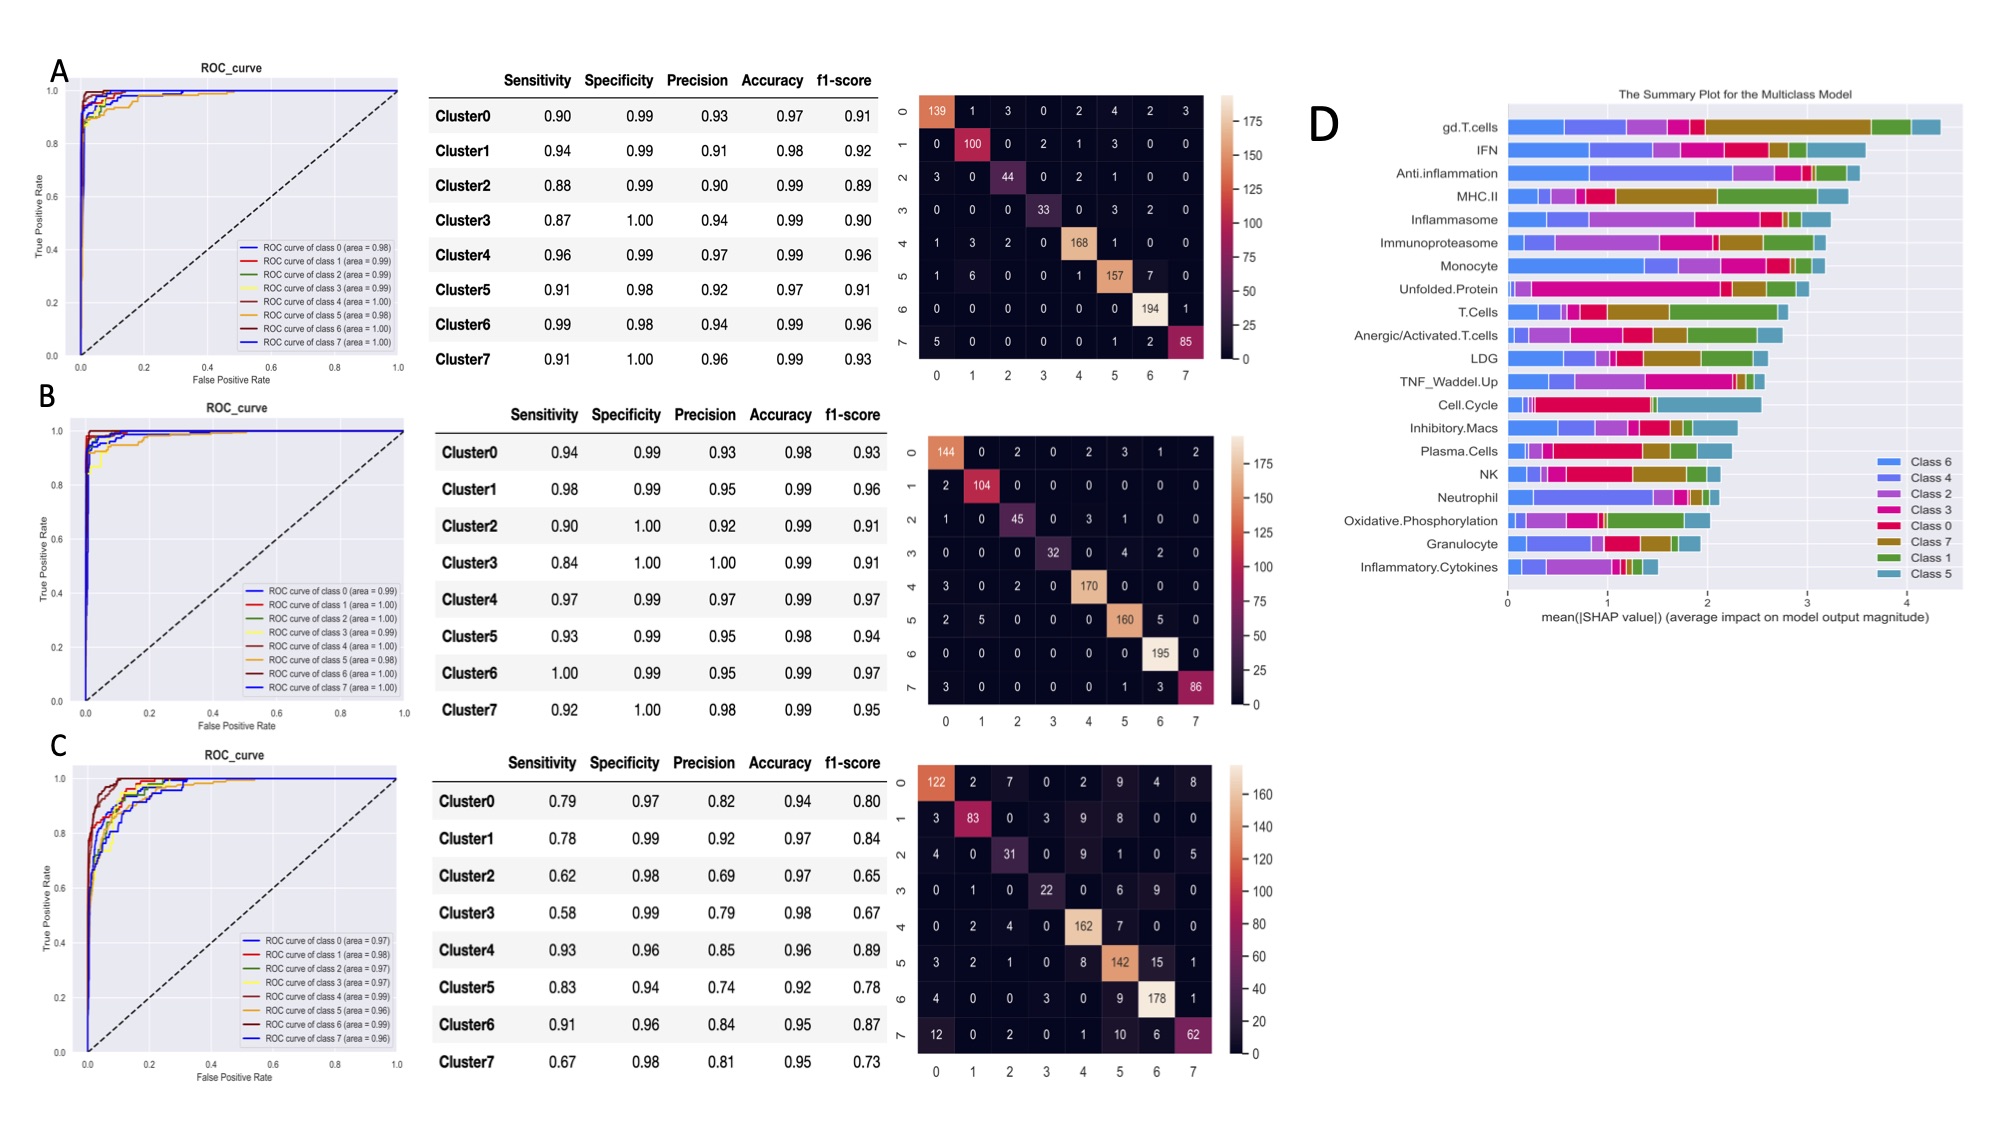
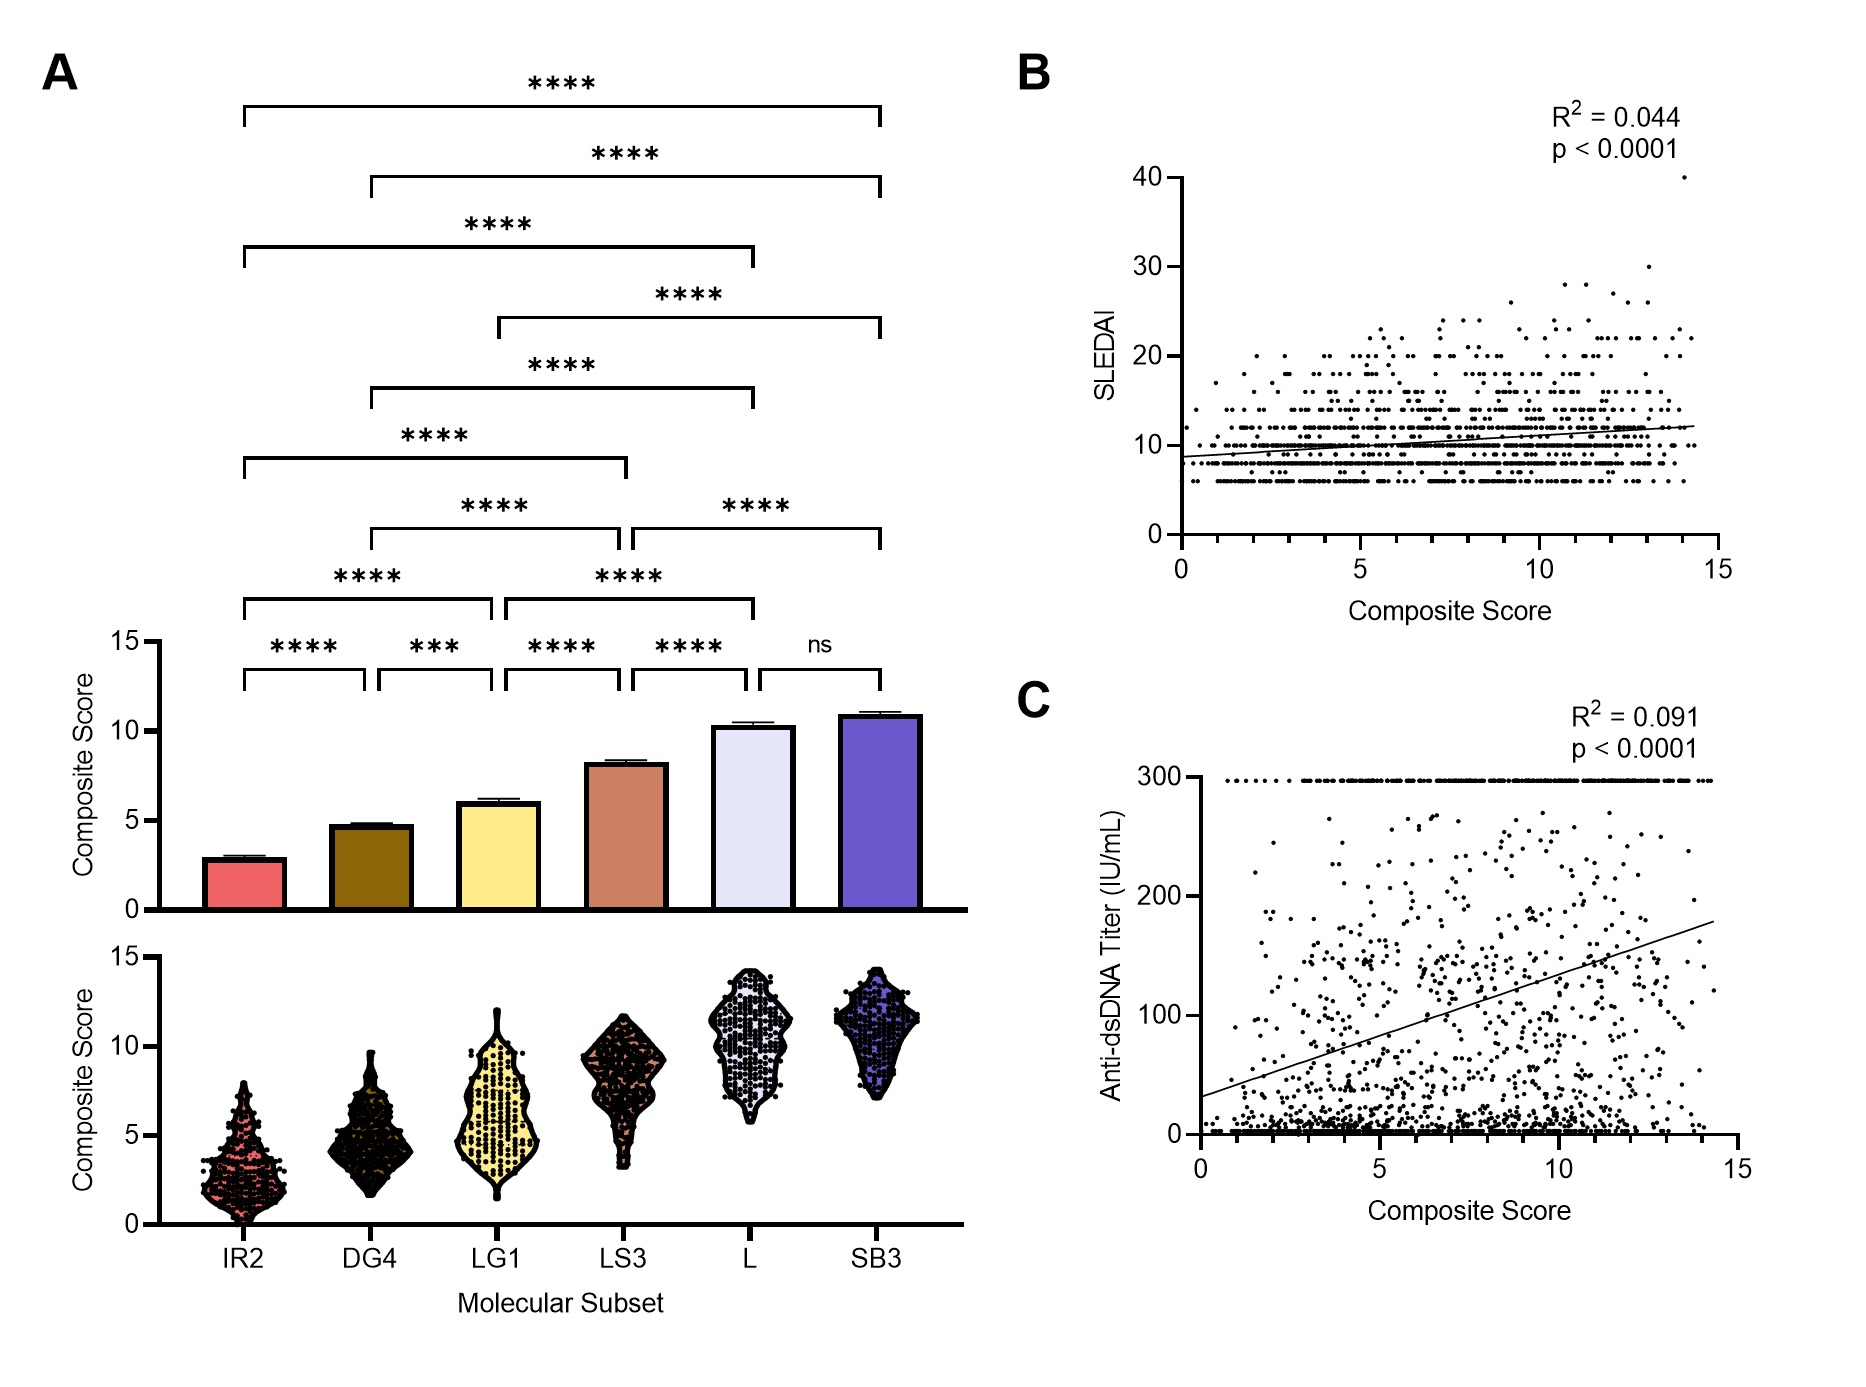
Results: Implementation of stable k-means clustering with the elbow method on GSVA scores of 3,166 lupus profiles identified eight subsets of lupus patients (Fig. 1). To evaluate and validate the classifiers, the trained models were applied to unseen data from 13 independent datasets. Among the four classifiers, SVM and LR performed best, with high degrees of accuracy (98%), precision (94%), sensitivity, and specificity (Fig. 2A-C). SHAP identified the IFN, monocyte, and anti-inflammation modules as the top contributors for classification of the lupus subsets (Fig. 2D). A composite molecular score, which comprised aggregate molecular scores of each GSVA gene module, was developed by ridge regression modeling and allowed for calculation of a molecular score for each lupus patient (Fig. 3A). A subset of patients was identified whose molecular scores were not different than those found in normal subjects, whereas other subsets of lupus patients had progressively higher scores indicative of the aggregation of molecular abnormalities. The composite molecular scores were significantly correlated with both anti-DNA titers and SLEDAI (Fig. 3B-C)
Conclusion: Altogether, the separation of lupus patients into molecular subsets was reproducible across 17 datasets. ML and SHAP allowed for the identification of key features necessary for the classification of distinct subsets of lupus patients and ridge regression permitted reduction of gene expression profiles to a score to assess lupus-related immune activity that correlated with clinical features. The implementation of a molecular score may provide a means to categorize lupus patients numerically based on the nature of each individual's underlying molecular abnormalities.
 Figure 1. Stable k-Means clustering analysis of 3,166 samples reveals eight lupus subsets. Heatmap of k-means clustering using GSVA enrichment scores for 32 cell and pathway modules (rows) in 3,166 samples (columns).
 Figure 2. Machine learning algorithms can predict lupus subset memberships with high accuracy and identify the key contributors. Area under the ROC curve (AUC), performance metrics, and confusion matrices of each of 3 classifiers are summarized: (A) support vector machine, (B) logistic regression, and (C) random forest. Each model was trained and validated on 2,183 samples and tested on the 13 independent datasets (n=983). (D) Top 20 key contributors identified by SHapley Additive exPlanations (SHAP).
 Figure 3. Gene expression-based molecular score as a metric to determine lupus patient disease severity. (a) The mean + SEM (top) and distribution (bottom) of the composite molecular score for the six molecular subsets in GSE88884. Statistical differences between mean scores of the molecular subsets were evaluated with Kruskal-Wallis test with Dunn’s multiple comparisons. Linear regression between (b) SLEDAI or (c) Anti-dsDNA and the molecular score.
Disclosures: P. Bachali, None; E. Hubbard, None; K. Kingsmore Allison, None; Y. He, None; A. Grammer, None; P. Lipsky, None.
Background/Purpose: Patients with SLE can exhibit considerable clinical heterogeneity. A robust patient stratification approach can help to characterize individual lupus patients more effectively based on their molecular profile. Machine learning (ML) and analysis of molecular profiles can help to classify lupus patients more precisely, but proper validation is required for clinical implementation of these methods by rheumatologists.
Methods: This study comprised 3,166 lupus samples extracted from 17 lupus blood gene expression datasets. Gene set variation analysis (GSVA) was carried out on each normalized dataset using 32 cell and process gene modules and resulting module enrichment scores were used as input into stable k-means clustering to subset lupus patients based on their gene expression profiles. We employed five different classification models including logistic regression (LR), Support Vector Machine (SVM), random forest (RF), and neural network to classify the lupus patients into patient subsets determined by k-means. The OnevsOne multi-class classification approach was used to avoid class imbalance. SHapley Additive exPlanations (SHAP) values were calculated for each patient subset to determine the most important features used in model prediction. The abnormalities of each lupus subset were summarized by a composite score developed by ridge regression modeling.
Results: Implementation of stable k-means clustering with the elbow method on GSVA scores of 3,166 lupus profiles identified eight subsets of lupus patients (Fig. 1). To evaluate and validate the classifiers, the trained models were applied to unseen data from 13 independent datasets. Among the four classifiers, SVM and LR performed best, with high degrees of accuracy (98%), precision (94%), sensitivity, and specificity (Fig. 2A-C). SHAP identified the IFN, monocyte, and anti-inflammation modules as the top contributors for classification of the lupus subsets (Fig. 2D). A composite molecular score, which comprised aggregate molecular scores of each GSVA gene module, was developed by ridge regression modeling and allowed for calculation of a molecular score for each lupus patient (Fig. 3A). A subset of patients was identified whose molecular scores were not different than those found in normal subjects, whereas other subsets of lupus patients had progressively higher scores indicative of the aggregation of molecular abnormalities. The composite molecular scores were significantly correlated with both anti-DNA titers and SLEDAI (Fig. 3B-C)
Conclusion: Altogether, the separation of lupus patients into molecular subsets was reproducible across 17 datasets. ML and SHAP allowed for the identification of key features necessary for the classification of distinct subsets of lupus patients and ridge regression permitted reduction of gene expression profiles to a score to assess lupus-related immune activity that correlated with clinical features. The implementation of a molecular score may provide a means to categorize lupus patients numerically based on the nature of each individual's underlying molecular abnormalities.
 Figure 1. Stable k-Means clustering analysis of 3,166 samples reveals eight lupus subsets. Heatmap of k-means clustering using GSVA enrichment scores for 32 cell and pathway modules (rows) in 3,166 samples (columns).
  Figure 2. Machine learning algorithms can predict lupus subset memberships with high accuracy and identify the key contributors. Area under the ROC curve (AUC), performance metrics, and confusion matrices of each of 3 classifiers are summarized: (A) support vector machine, (B) logistic regression, and (C) random forest. Each model was trained and validated on 2,183 samples and tested on the 13 independent datasets (n=983). (D) Top 20 key contributors identified by SHapley Additive exPlanations (SHAP).
 Figure 3. Gene expression-based molecular score as a metric to determine lupus patient disease severity. (a) The mean + SEM (top) and distribution (bottom) of the composite molecular score for the six molecular subsets in GSE88884. Statistical differences between mean scores of the molecular subsets were evaluated with Kruskal-Wallis test with Dunn’s multiple comparisons. Linear regression between (b) SLEDAI or (c) Anti-dsDNA and the molecular score.
Disclosures: P. Bachali, None; E. Hubbard, None; K. Kingsmore Allison, None; Y. He, None; A. Grammer, None; P. Lipsky, None.

