Back
Poster Session B
Spondyloarthritis (SpA) including psoriatic arthritis (PsA)
Session: (1004–1034) Spondyloarthritis Including PsA – Diagnosis, Manifestations, and Outcomes Poster II
1011: Trends in Fracture Rates Among Veterans with Ankylosing Spondylitis
Sunday, November 13, 2022
9:00 AM – 10:30 AM Eastern Time
Location: Virtual Poster Hall
- SM
Sali Merjanah, MD
Boston University
Boston, MA, United States
Abstract Poster Presenter(s)
Sali Merjanah1, Jean Liew1, John Bihn2, Nathanael Fillmore2, Nhan Do3 and Maureen Dubreuil4, 1Boston University, Boston, MA, 2VA Boston Healthcare System, Boston, MA, 3VA Boston Healthcare System, Boston University School of Medicine, Boston, MA, 4Department of Rheumatology, Boston University School of Medicine, Boston, MA
Background/Purpose: A meta-analysis demonstrated that the risk of vertebral fractures in Ankylosing Spondylitis (AS) is doubled compared to non-AS comparators. Increased fracture risk in AS is thought to be due to local bone remodeling and systemic inflammatory effects. However, data are limited regarding changes in fracture rates in AS over time. We assessed fracture rates in AS and general population comparators and performed an interrupted time series to assess whether fracture rates have changed since the introduction of biologics for AS treatment.
Methods: We used the national Veterans Affairs Corporate Data Warehouse and included adults ≥ 18 years old with ≥1 ICD-9/10 code for AS from an outpatient data source from 1999 to 2021, and at least one disease modifying antirheumatic drug medication fill or administration. Subjects were excluded if they had ≥1 ICD-9/-10 code of rheumatoid arthritis or psoriatic arthritis, had missing age data, or a history of the outcome of interest (radius, femoral or vertebral fracture) prior to inclusion. As comparators, we selected a 20% random sample of adults ≥18 years old without a prior AS diagnosis. For each AS subject, follow up time began at the time of AS diagnosis. Subjects were followed until they had a fracture, reached age 90, died, were disenrolled from the VA, or at the study’s end in May 2021.
Statistical analysis:Annual incidence rates were calculated as the number of incident fractures divided by the number of person-years (PY) separately for the AS and comparison groups. Rates were stratified by sex. For male patients, rates were also stratified for age and race. We directly standardized fracture rates to the structure of the cohort in 2017. To examine trends over time we calculated the adjusted relative risk of fracture in the AS group compared to the comparison group for each year. We then performed an interrupted time series analysis to compare rates of fractures from 2001-2003, and then from 2004-2021 as estimates of fracture rates in the pre-TNFi and TNFi eras. In this analysis we divided standardized fracture rates in AS by the comparator rates to account for a secular trend in fractures.
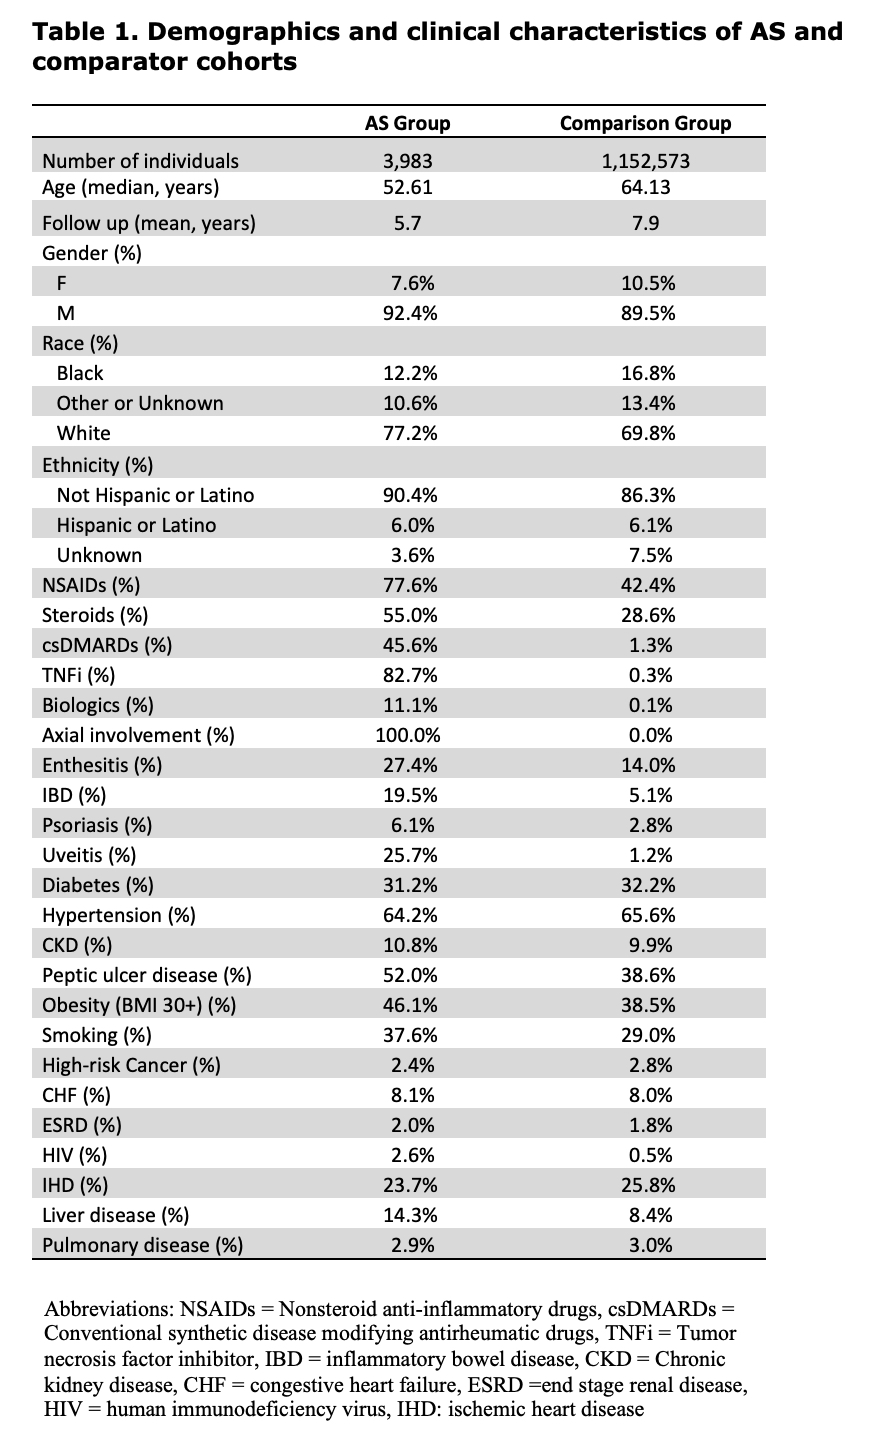
Results: As of 2017, the baseline year used for standardization, we identified 3,983 patients with AS (median age 52.61 years, 92.4% men, 77.2% white) and 1,152,573 randomly selected general population comparators (median age 64.13 years, 89.5% men, 69.8% white; Table 1).
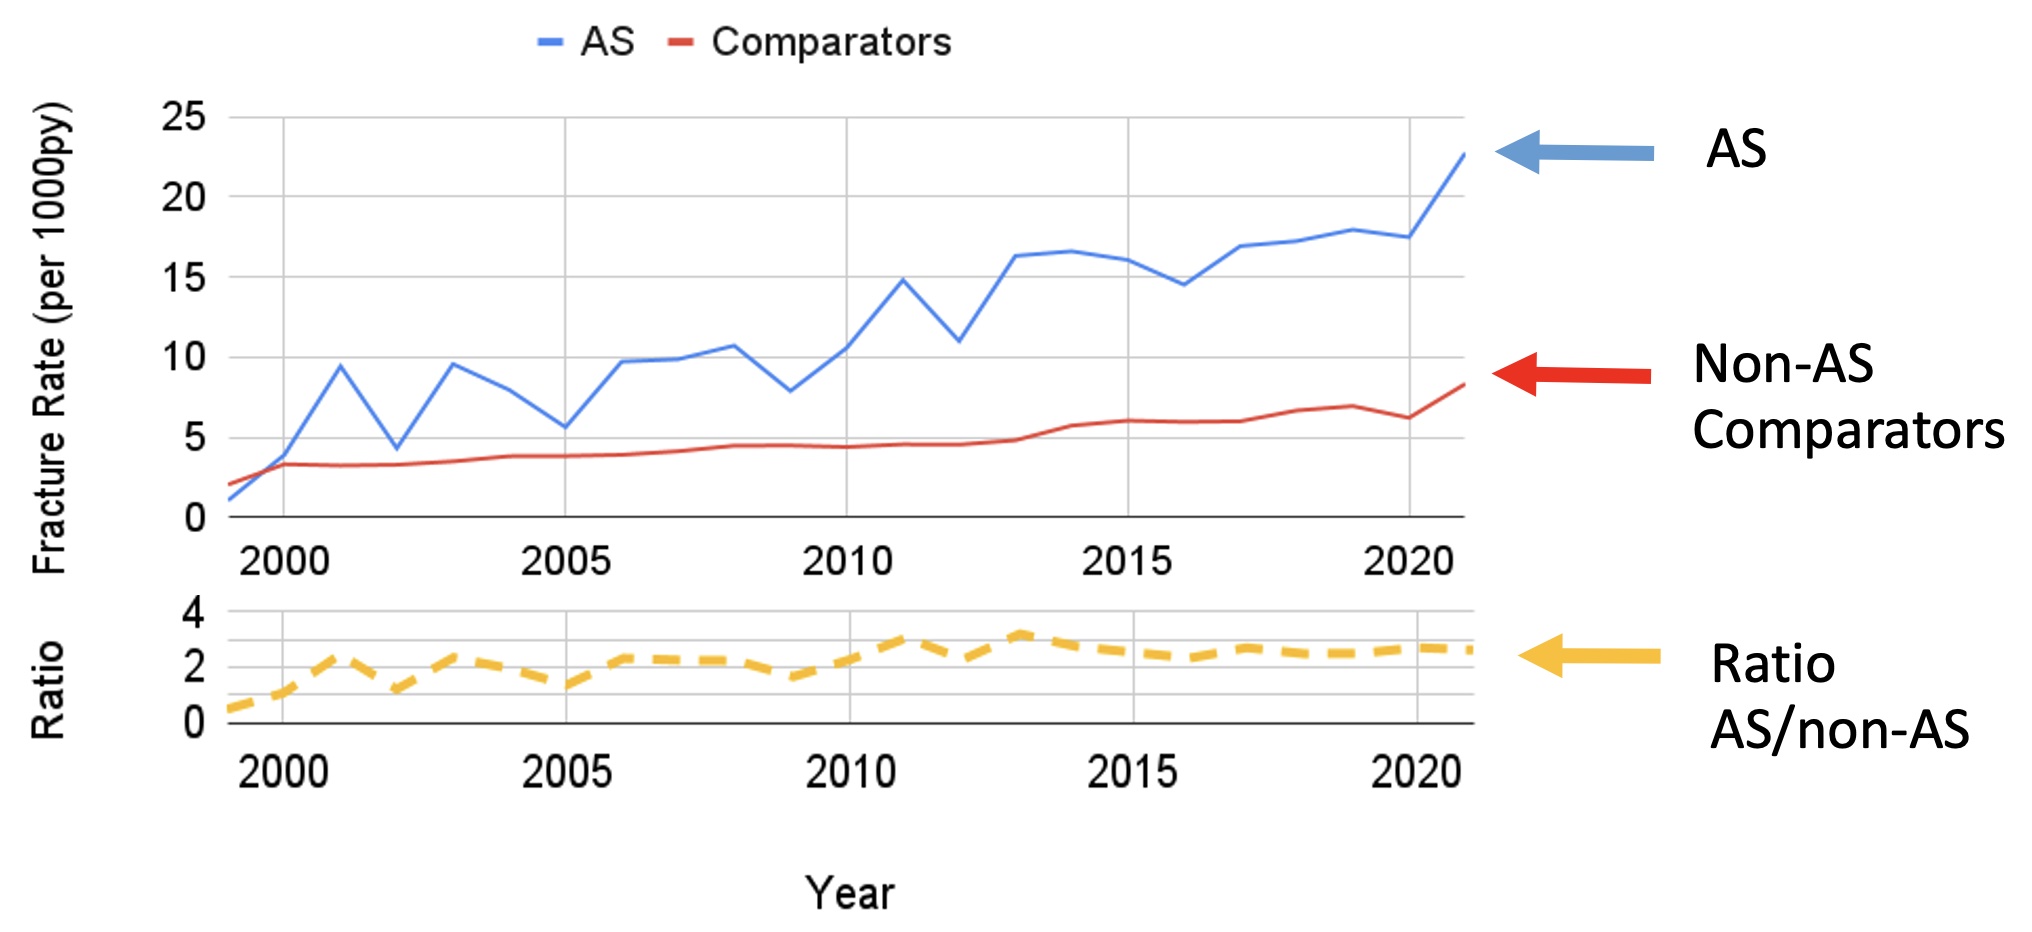
The annual incidence rate of fractures increased among those with AS, from 2.1 per 1000 PY in 1999 to 22.8 in 2021. The rate also increased among comparators from 0.4 to 8.3. The rate ratio (AS/comparators) appear stable over the past 2 decades (Figure 1).
The interrupted time series showed rate of fractures in the TNFi era that was 15 per 1000 PY greater than the rate in the pre-TNFi era (4 per 1000 PY; Figure 2) for people with AS.
Conclusion: Our study showed increasing fracture incidence rates for both the AS comparator groups. This rate of fractures was increased in the TNFi era (2004-2021) relative to the pre-TNFi era. Understanding the fracture risk in AS patients and identifying the risk factors for developing fractures are important to investigate treatment interventions.
 Table 1. Demographics and clinical characteristics of AS and comparator cohorts
 Figure 1. Fracture rates for AS, comparators and the Ratio (AS/Comparator)
.jpg) Figure 2. Fracture rate per 1000 PY among those with AS. Each dot represents the fracture rate in a 6-month period. The trend in fracture rates fit from observed data is shown as a solid line. The pre-TNFi period (2000-2003) slope is extended as a dashed line to allow comparison of the baseline period slope with the observed data slope in the TNFi period (2004-2021). Compared to the pre-TNFi era, the rate of fractures in the TNFi era is increased by 15 per 1000 PY.
Figure 2. Fracture rate per 1000 PY among those with AS. Each dot represents the fracture rate in a 6-month period. The trend in fracture rates fit from observed data is shown as a solid line. The pre-TNFi period (2000-2003) slope is extended as a dashed line to allow comparison of the baseline period slope with the observed data slope in the TNFi period (2004-2021). Compared to the pre-TNFi era, the rate of fractures in the TNFi era is increased by 15 per 1000 PY.
Disclosures: S. Merjanah, None; J. Liew, None; J. Bihn, None; N. Fillmore, None; N. Do, None; M. Dubreuil, Amgen, UCB Pharma, Pfizer.
Background/Purpose: A meta-analysis demonstrated that the risk of vertebral fractures in Ankylosing Spondylitis (AS) is doubled compared to non-AS comparators. Increased fracture risk in AS is thought to be due to local bone remodeling and systemic inflammatory effects. However, data are limited regarding changes in fracture rates in AS over time. We assessed fracture rates in AS and general population comparators and performed an interrupted time series to assess whether fracture rates have changed since the introduction of biologics for AS treatment.
Methods: We used the national Veterans Affairs Corporate Data Warehouse and included adults ≥ 18 years old with ≥1 ICD-9/10 code for AS from an outpatient data source from 1999 to 2021, and at least one disease modifying antirheumatic drug medication fill or administration. Subjects were excluded if they had ≥1 ICD-9/-10 code of rheumatoid arthritis or psoriatic arthritis, had missing age data, or a history of the outcome of interest (radius, femoral or vertebral fracture) prior to inclusion. As comparators, we selected a 20% random sample of adults ≥18 years old without a prior AS diagnosis. For each AS subject, follow up time began at the time of AS diagnosis. Subjects were followed until they had a fracture, reached age 90, died, were disenrolled from the VA, or at the study’s end in May 2021.
Statistical analysis:Annual incidence rates were calculated as the number of incident fractures divided by the number of person-years (PY) separately for the AS and comparison groups. Rates were stratified by sex. For male patients, rates were also stratified for age and race. We directly standardized fracture rates to the structure of the cohort in 2017. To examine trends over time we calculated the adjusted relative risk of fracture in the AS group compared to the comparison group for each year. We then performed an interrupted time series analysis to compare rates of fractures from 2001-2003, and then from 2004-2021 as estimates of fracture rates in the pre-TNFi and TNFi eras. In this analysis we divided standardized fracture rates in AS by the comparator rates to account for a secular trend in fractures.
Results: As of 2017, the baseline year used for standardization, we identified 3,983 patients with AS (median age 52.61 years, 92.4% men, 77.2% white) and 1,152,573 randomly selected general population comparators (median age 64.13 years, 89.5% men, 69.8% white; Table 1).
The annual incidence rate of fractures increased among those with AS, from 2.1 per 1000 PY in 1999 to 22.8 in 2021. The rate also increased among comparators from 0.4 to 8.3. The rate ratio (AS/comparators) appear stable over the past 2 decades (Figure 1).
The interrupted time series showed rate of fractures in the TNFi era that was 15 per 1000 PY greater than the rate in the pre-TNFi era (4 per 1000 PY; Figure 2) for people with AS.
Conclusion: Our study showed increasing fracture incidence rates for both the AS comparator groups. This rate of fractures was increased in the TNFi era (2004-2021) relative to the pre-TNFi era. Understanding the fracture risk in AS patients and identifying the risk factors for developing fractures are important to investigate treatment interventions.
 Table 1. Demographics and clinical characteristics of AS and comparator cohorts
 Figure 1. Fracture rates for AS, comparators and the Ratio (AS/Comparator)
.jpg) Figure 2. Fracture rate per 1000 PY among those with AS. Each dot represents the fracture rate in a 6-month period. The trend in fracture rates fit from observed data is shown as a solid line. The pre-TNFi period (2000-2003) slope is extended as a dashed line to allow comparison of the baseline period slope with the observed data slope in the TNFi period (2004-2021). Compared to the pre-TNFi era, the rate of fractures in the TNFi era is increased by 15 per 1000 PY.
Figure 2. Fracture rate per 1000 PY among those with AS. Each dot represents the fracture rate in a 6-month period. The trend in fracture rates fit from observed data is shown as a solid line. The pre-TNFi period (2000-2003) slope is extended as a dashed line to allow comparison of the baseline period slope with the observed data slope in the TNFi period (2004-2021). Compared to the pre-TNFi era, the rate of fractures in the TNFi era is increased by 15 per 1000 PY. Disclosures: S. Merjanah, None; J. Liew, None; J. Bihn, None; N. Fillmore, None; N. Do, None; M. Dubreuil, Amgen, UCB Pharma, Pfizer.

