Back
Abstract Session
Rheumatoid arthritis (RA)
Session: Abstracts: RA – Treatment II: Pre- and Early Disease (1603–1607)
1607: Machine Learning Identifies Biomarker of Non-Response to Methotrexate in Rheumatoid Arthritis
Sunday, November 13, 2022
5:30 PM – 5:40 PM Eastern Time
Location: Room 121
- VB
Vincent Bouget, MSc
Scienta Lab
Paris, France
Presenting Author(s)
Vincent Bouget1, Julien Duquesne1, Paul-Henry Cournède2, Bruno Fautrel3, Francis Guillemin4, Pascal de Jong5, Judith Heutz6, Marloes Verstappen7, Annette van der Helm-van Mil8, Xavier Mariette9 and Samuel Bitoun10, 1Scienta Lab, Paris, France, 2Paris-Saclay University - CentraleSupelec, Paris, France, 3Sorbonne University Paris, France and Pierre Louis Institute of Epidemiology and Public Health, Paris, France, Paris, France, 4Université de Lorraine, APEMAC, Vandoeuvre-les-nancy, France, 5ErasmusMC, Hendrik Ido Ambacht, Netherlands, 6Erasmus Medical Center, Rotterdam, Netherlands, 7Leiden University Medical Center, Leiden, Netherlands, 8Leiden University Medical Center, Erasmus Medical Center, Leiden, Netherlands, 9Paris-Saclay University, Rueil Malmaison, Ile-de-France, France, 10Paris-Saclay University, Paris, France
Background/Purpose: Methotrexate (MTX) is the first line treatment for rheumatoid arthritis (RA). Unfortunately, 30% to 40% of RA patients do not respond to MTX with a risk of joint erosion. On the other hand, several second-line treatments exist to treat patients with inadequate response. Identifying patients unlikely to respond to MTX before initiating the treatment is therefore a major goal to improve RA management.
Using machine learning models based on simple clinical and biological data, we aimed at unveiling simple clinical markers and/or biomarkers of non-response to MTX.
Methods: We used data from the ESPOIR and Leiden early arthritis cohorts to train a machine learning model (LightGBM) predicting response to MTX. We included patients that fulfilled the 2010 EULAR/ACR criteria and were treated with MTX in monotherapy +/- steroids. The model uses patient's characteristics at treatment initiation. The predictive variables were selected using backward feature selection. The endpoint was to predict the therapeutic response, defined as the EULAR response 9 months (+/- 6 months) after treatment initiation.
To identify biomarkers, we used Shapley values to analyze how variables are used by the model to predict response. For a given patient and a given variable, Shapley values quantify how much this variable contributed to the predicted therapeutic response. On the training set, we first computed the Shapley values. Based on these Shapley values, patients were then clustered into subgroup of responders/non-responders using the K-means algorithm. We validated the results on the tREACH trial.
Results: We included 433 patients from the ESPOIR cohort, 243 from the Leiden cohort and 138 from the t-REACH trial. Among the 25 available variables, the feature selection automatically selected DAS28, lymphocytes count, white blood cells, creatininemia, AST, ALT, swollen joints count, and corticosteroids co-treatment as predictors of EULAR response. In the replication cohort, the model achieved an AUROC of 0.75 (CI 0.66-0.83) (Table 1).
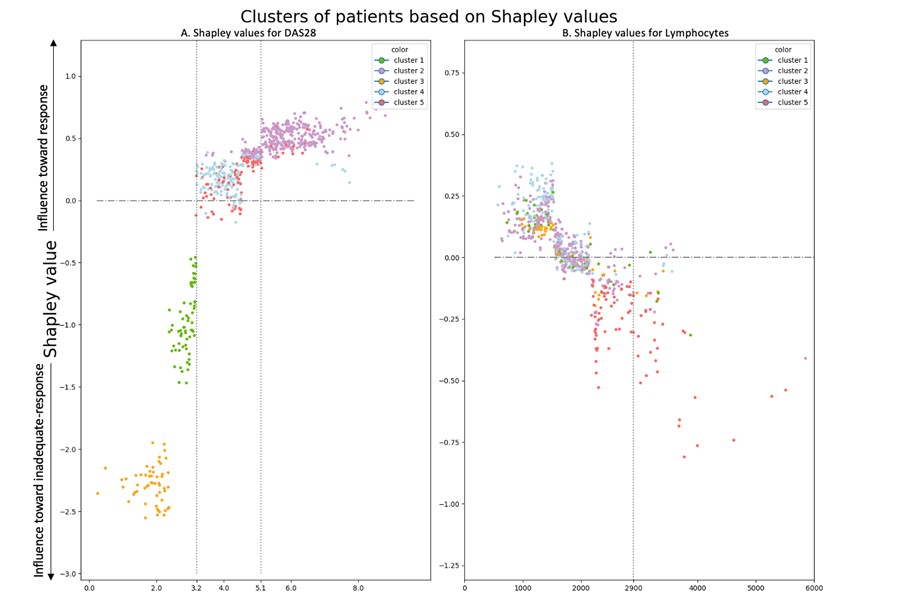
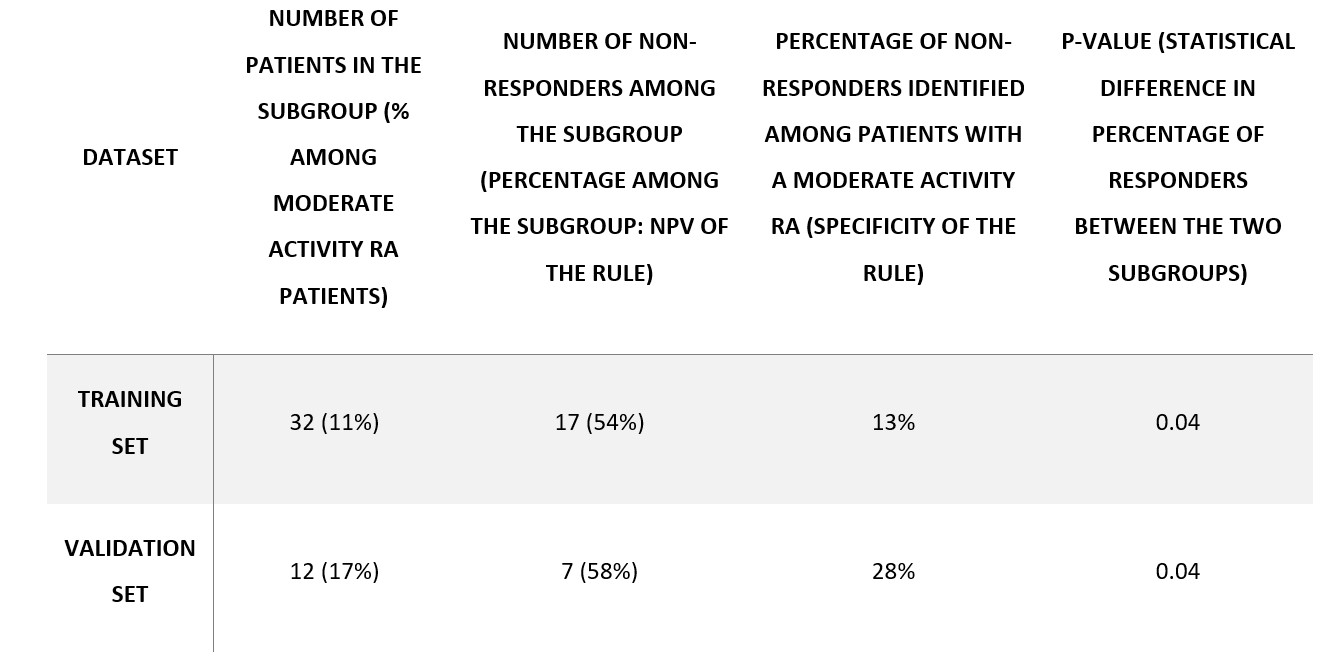
The strongest predictor of response was DAS28. As expected, high DAS28 was associated to response and low DAS28 was associated with non-response (Figure 1 - left panel: yellow, green, and purple clusters). Interestingly, for patients with moderate activity (DAS28 between 3.2 and 5.1), DAS28 is a weak predictor of response (Figure 1 - left panel: red and cyan clusters are close to x-axis). In this population, which is currently the most frequent population in which DMARDs are introduced, blood lymphocytes count was potent to discriminate responders and inadequate responders (Table 2): around 60% of patients above 2900 cells/mm3 were non-responders vs 30% in the whole population (Figure 1 - right panel: red cluster is strongly correlated to non-response). This simple rule obtained using machine learning can be used in clinical practice without any algorithm to identify potential non-responders.
Conclusion: Using clinical and biological variables, we accurately predicted inadequate response to MTX. Thanks to our machine learning model, we identified high blood lymphocytes count as a simple biomarker of non-response for RA patients with moderate activity. It could have direct impact in clinical practice.
 Table 1. Machine learning model performances.
 Figure 1. Shapley values graphs A positive Shapley value represents how much the variable influences the prediction towards response for a given patient. Each patient is represented by a point. Patients are clustered based on Shapley values.
Left panel Shapley values of the model computed on the training set for DAS28.
Right Panel: Shapley values of the model computed on the training set for Lymphocytes count.
 Table 2. Summary of high-lymphocytes-count subgroup statistics.
Disclosures: V. Bouget, None; J. Duquesne, None; P. Cournède, None; B. Fautrel, Pfizer, Novartis, Roche, Sanofi-Aventis, SOBI, UCB; F. Guillemin, None; P. de Jong, None; J. Heutz, None; M. Verstappen, Bristol-Myers Squibb(BMS); A. van der Helm-van Mil, None; X. Mariette, AstraZeneca, Bristol Myers Squibb, Galapagos, GSK, Novartis, Pfizer; S. Bitoun, None.
Background/Purpose: Methotrexate (MTX) is the first line treatment for rheumatoid arthritis (RA). Unfortunately, 30% to 40% of RA patients do not respond to MTX with a risk of joint erosion. On the other hand, several second-line treatments exist to treat patients with inadequate response. Identifying patients unlikely to respond to MTX before initiating the treatment is therefore a major goal to improve RA management.
Using machine learning models based on simple clinical and biological data, we aimed at unveiling simple clinical markers and/or biomarkers of non-response to MTX.
Methods: We used data from the ESPOIR and Leiden early arthritis cohorts to train a machine learning model (LightGBM) predicting response to MTX. We included patients that fulfilled the 2010 EULAR/ACR criteria and were treated with MTX in monotherapy +/- steroids. The model uses patient's characteristics at treatment initiation. The predictive variables were selected using backward feature selection. The endpoint was to predict the therapeutic response, defined as the EULAR response 9 months (+/- 6 months) after treatment initiation.
To identify biomarkers, we used Shapley values to analyze how variables are used by the model to predict response. For a given patient and a given variable, Shapley values quantify how much this variable contributed to the predicted therapeutic response. On the training set, we first computed the Shapley values. Based on these Shapley values, patients were then clustered into subgroup of responders/non-responders using the K-means algorithm. We validated the results on the tREACH trial.
Results: We included 433 patients from the ESPOIR cohort, 243 from the Leiden cohort and 138 from the t-REACH trial. Among the 25 available variables, the feature selection automatically selected DAS28, lymphocytes count, white blood cells, creatininemia, AST, ALT, swollen joints count, and corticosteroids co-treatment as predictors of EULAR response. In the replication cohort, the model achieved an AUROC of 0.75 (CI 0.66-0.83) (Table 1).
The strongest predictor of response was DAS28. As expected, high DAS28 was associated to response and low DAS28 was associated with non-response (Figure 1 - left panel: yellow, green, and purple clusters). Interestingly, for patients with moderate activity (DAS28 between 3.2 and 5.1), DAS28 is a weak predictor of response (Figure 1 - left panel: red and cyan clusters are close to x-axis). In this population, which is currently the most frequent population in which DMARDs are introduced, blood lymphocytes count was potent to discriminate responders and inadequate responders (Table 2): around 60% of patients above 2900 cells/mm3 were non-responders vs 30% in the whole population (Figure 1 - right panel: red cluster is strongly correlated to non-response). This simple rule obtained using machine learning can be used in clinical practice without any algorithm to identify potential non-responders.
Conclusion: Using clinical and biological variables, we accurately predicted inadequate response to MTX. Thanks to our machine learning model, we identified high blood lymphocytes count as a simple biomarker of non-response for RA patients with moderate activity. It could have direct impact in clinical practice.
 Table 1. Machine learning model performances.
 Figure 1. Shapley values graphs A positive Shapley value represents how much the variable influences the prediction towards response for a given patient. Each patient is represented by a point. Patients are clustered based on Shapley values.
 Left panel Shapley values of the model computed on the training set for DAS28.
Right Panel: Shapley values of the model computed on the training set for Lymphocytes count.
 Table 2. Summary of high-lymphocytes-count subgroup statistics.
Disclosures: V. Bouget, None; J. Duquesne, None; P. Cournède, None; B. Fautrel, Pfizer, Novartis, Roche, Sanofi-Aventis, SOBI, UCB; F. Guillemin, None; P. de Jong, None; J. Heutz, None; M. Verstappen, Bristol-Myers Squibb(BMS); A. van der Helm-van Mil, None; X. Mariette, AstraZeneca, Bristol Myers Squibb, Galapagos, GSK, Novartis, Pfizer; S. Bitoun, None.

