
Poster Session D
Crystal arthropathies
Sandra Hermann, MD
Charité
Berlin, Germany
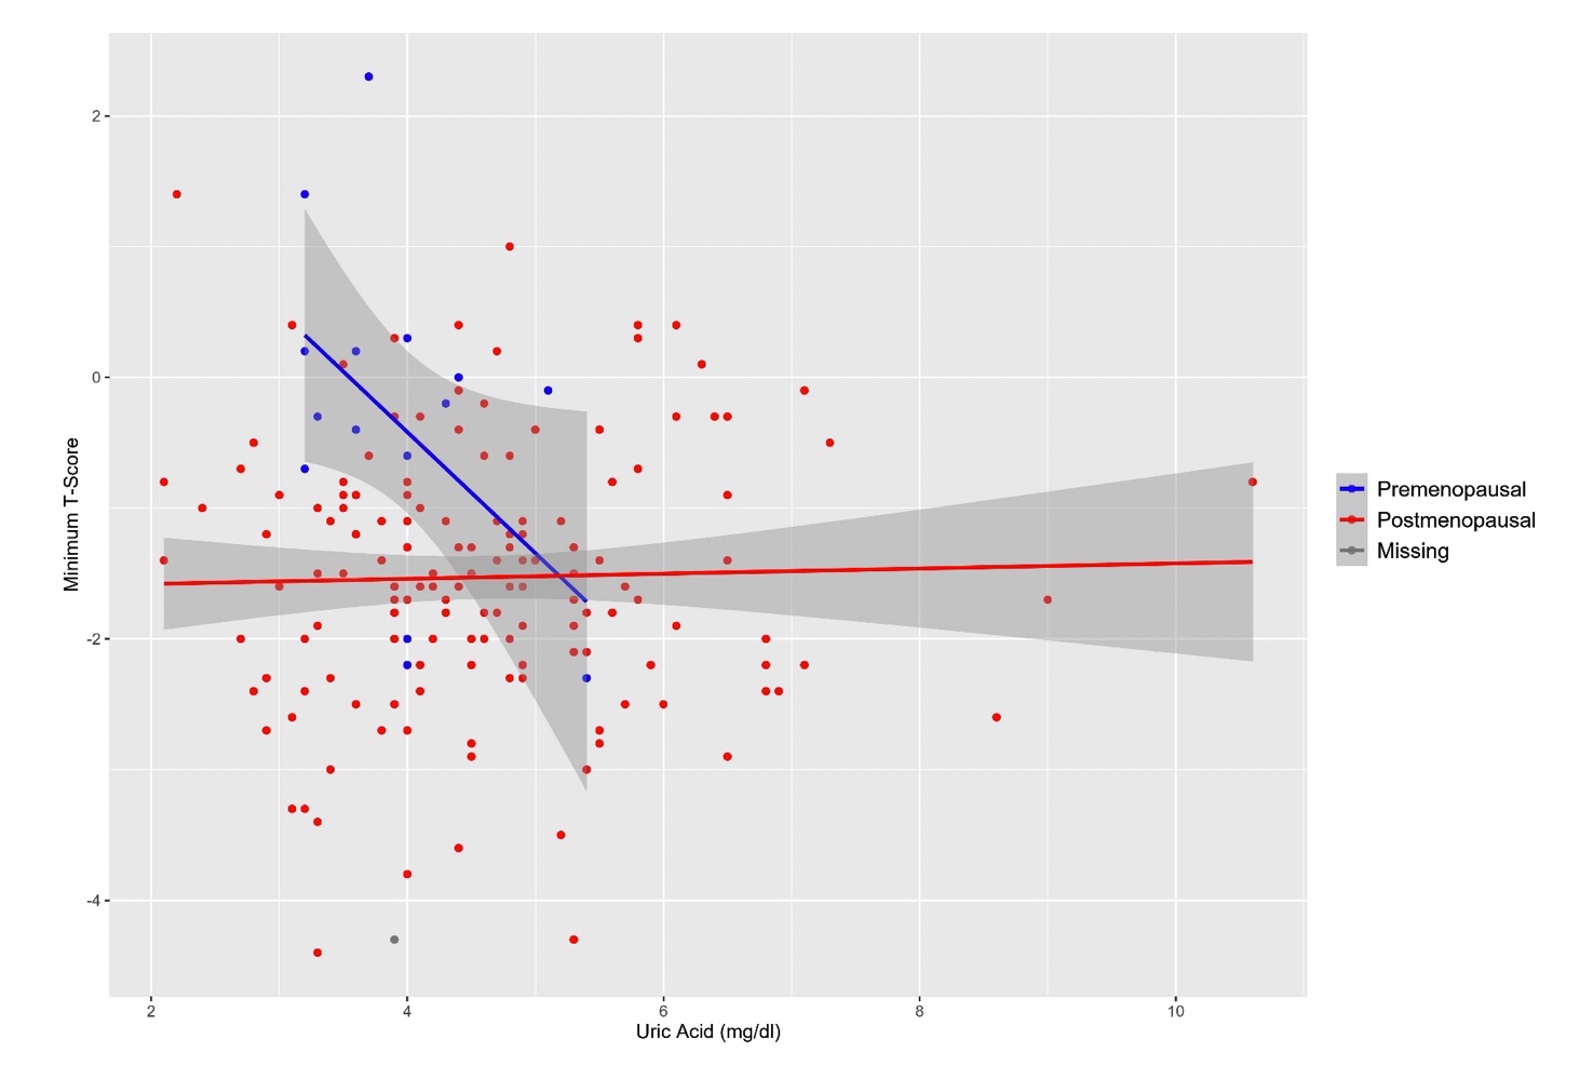 Figure 1. Scatterplot of minimum T-scores and uric acid in female rheumatoid arthritis patients stratified by menopausal status. Grey shadows surrounding the regression lines are the respective 95% confidence intervals.