Back
Poster Session A
Diversity, inclusion and racial disparities
Session: (0085–0122) Healthcare Disparities in Rheumatology Poster
0120: Epstein Barr Virus Reactivation in Native American Rheumatic Disease Patients Is Associated with Systemic Disease and Rheumatoid Arthritis but Not Other Rheumatic Diseases
Saturday, November 12, 2022
1:00 PM – 3:00 PM Eastern Time
Location: Virtual Poster Hall
- CG
Carla Guthridge, PhD
Oklahoma Medical Research Foundation
Oklahoma City, OK, United States
Abstract Poster Presenter(s)
Carla J. Guthridge1, Catriona Wagner2, Sohail Khan3, Michael Peercy4, Bobby Saunkeah4, Joel Guthridge1 and Judith James1, 1Oklahoma Medical Research Foundation, Oklahoma City, OK, 2Oklahoma Medical Research Foundation, Santa Cruz, CA, 3Cherokee Nation, Tahlequah, OK, 4Chickasaw Nation, Ada, OK
Background/Purpose: EBV infection is associated with autoantibody development in the preclinical period of rheumatic diseases, such as SLE and RA. Furthermore, EBV reactivation, characterized by EBV early antigen (EBV-EA) antibody production, correlates with IFN pathway activation and elevated disease activity. However, although Native American (NA) individuals experience a higher prevalence, severity, and mortality from rheumatic diseases, the relationship between EBV and autoimmune rheumatic diseases has not been studied explicitly in these patients. This study characterizes the relationship between serologic evidence of EBV reactivation and serum biomarkers in NA rheumatic disease patients.
Methods: NA patients with RA (n=38), SLE/Sjögren's syndrome (systemic autoimmune rheumatic disease, SARD; n=25), polyarthralgia/OA (n=30), polyarthritis/UCTD (n=19), and healthy controls (n=31) provided serum samples for determination of serum levels of autoantibodies, cytokines, chemokines, CRP, vitamin D, cotinine, and viral (EBV, CMV, HSV) antibodies.
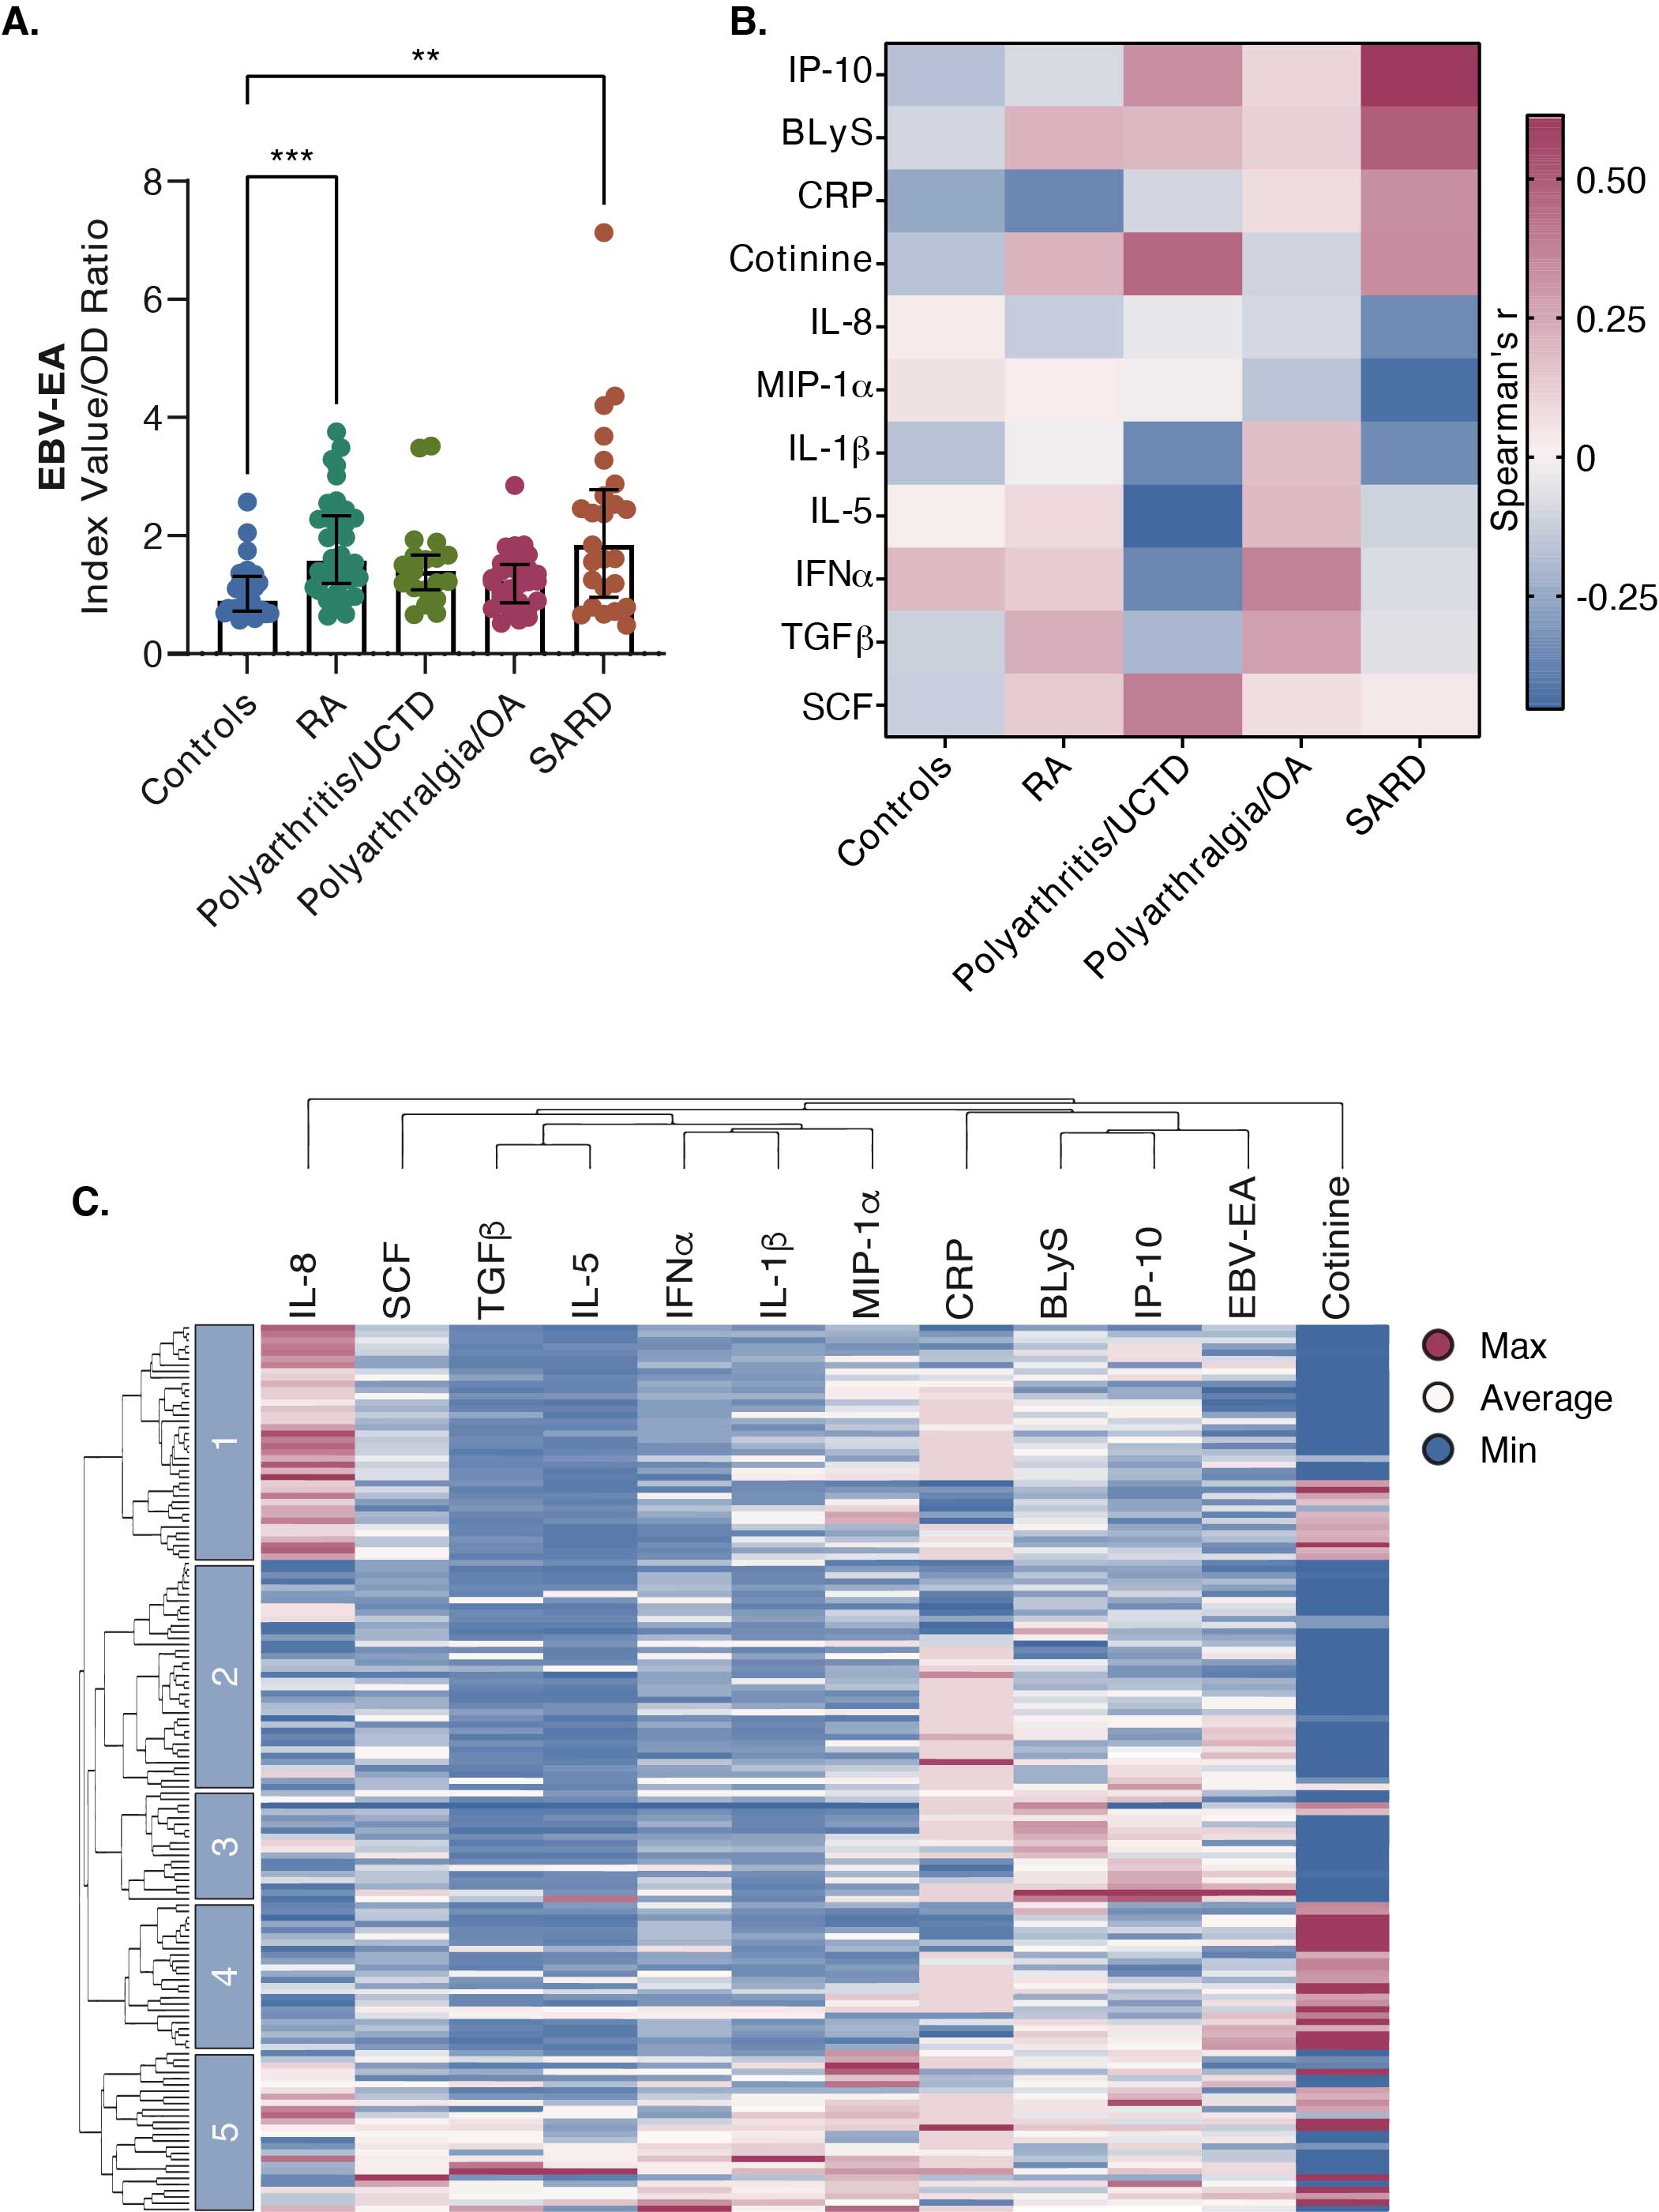
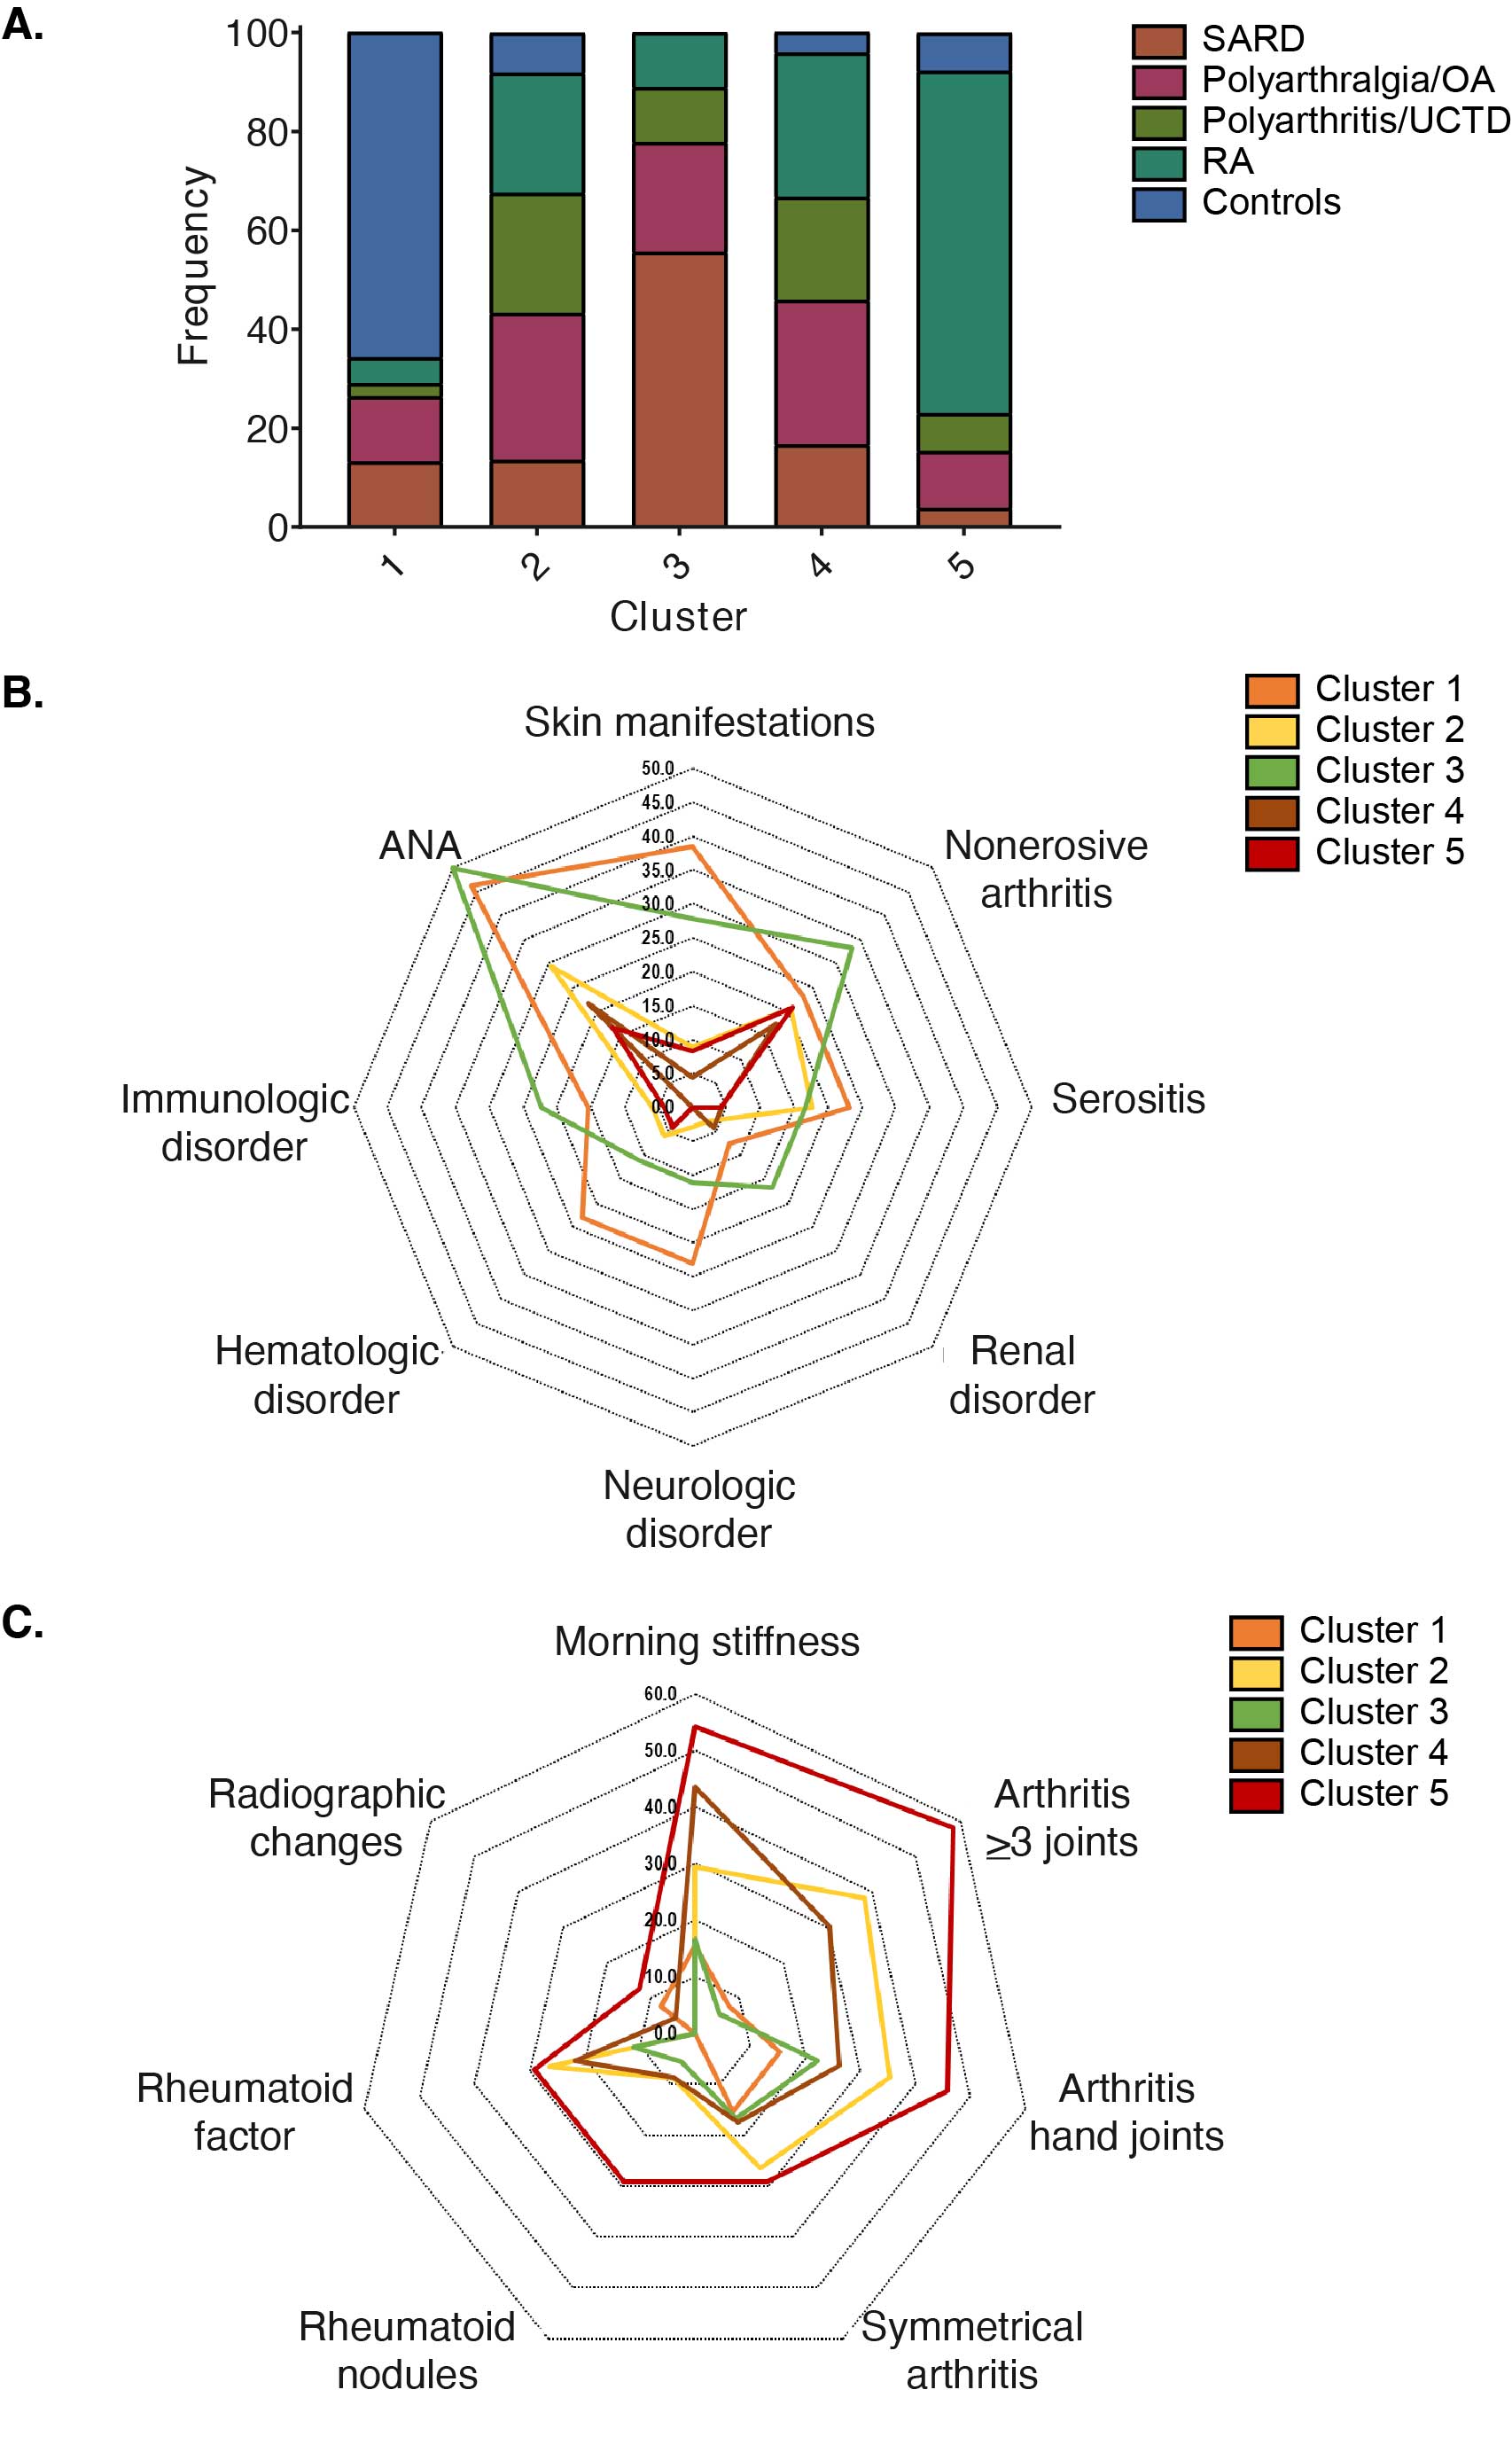
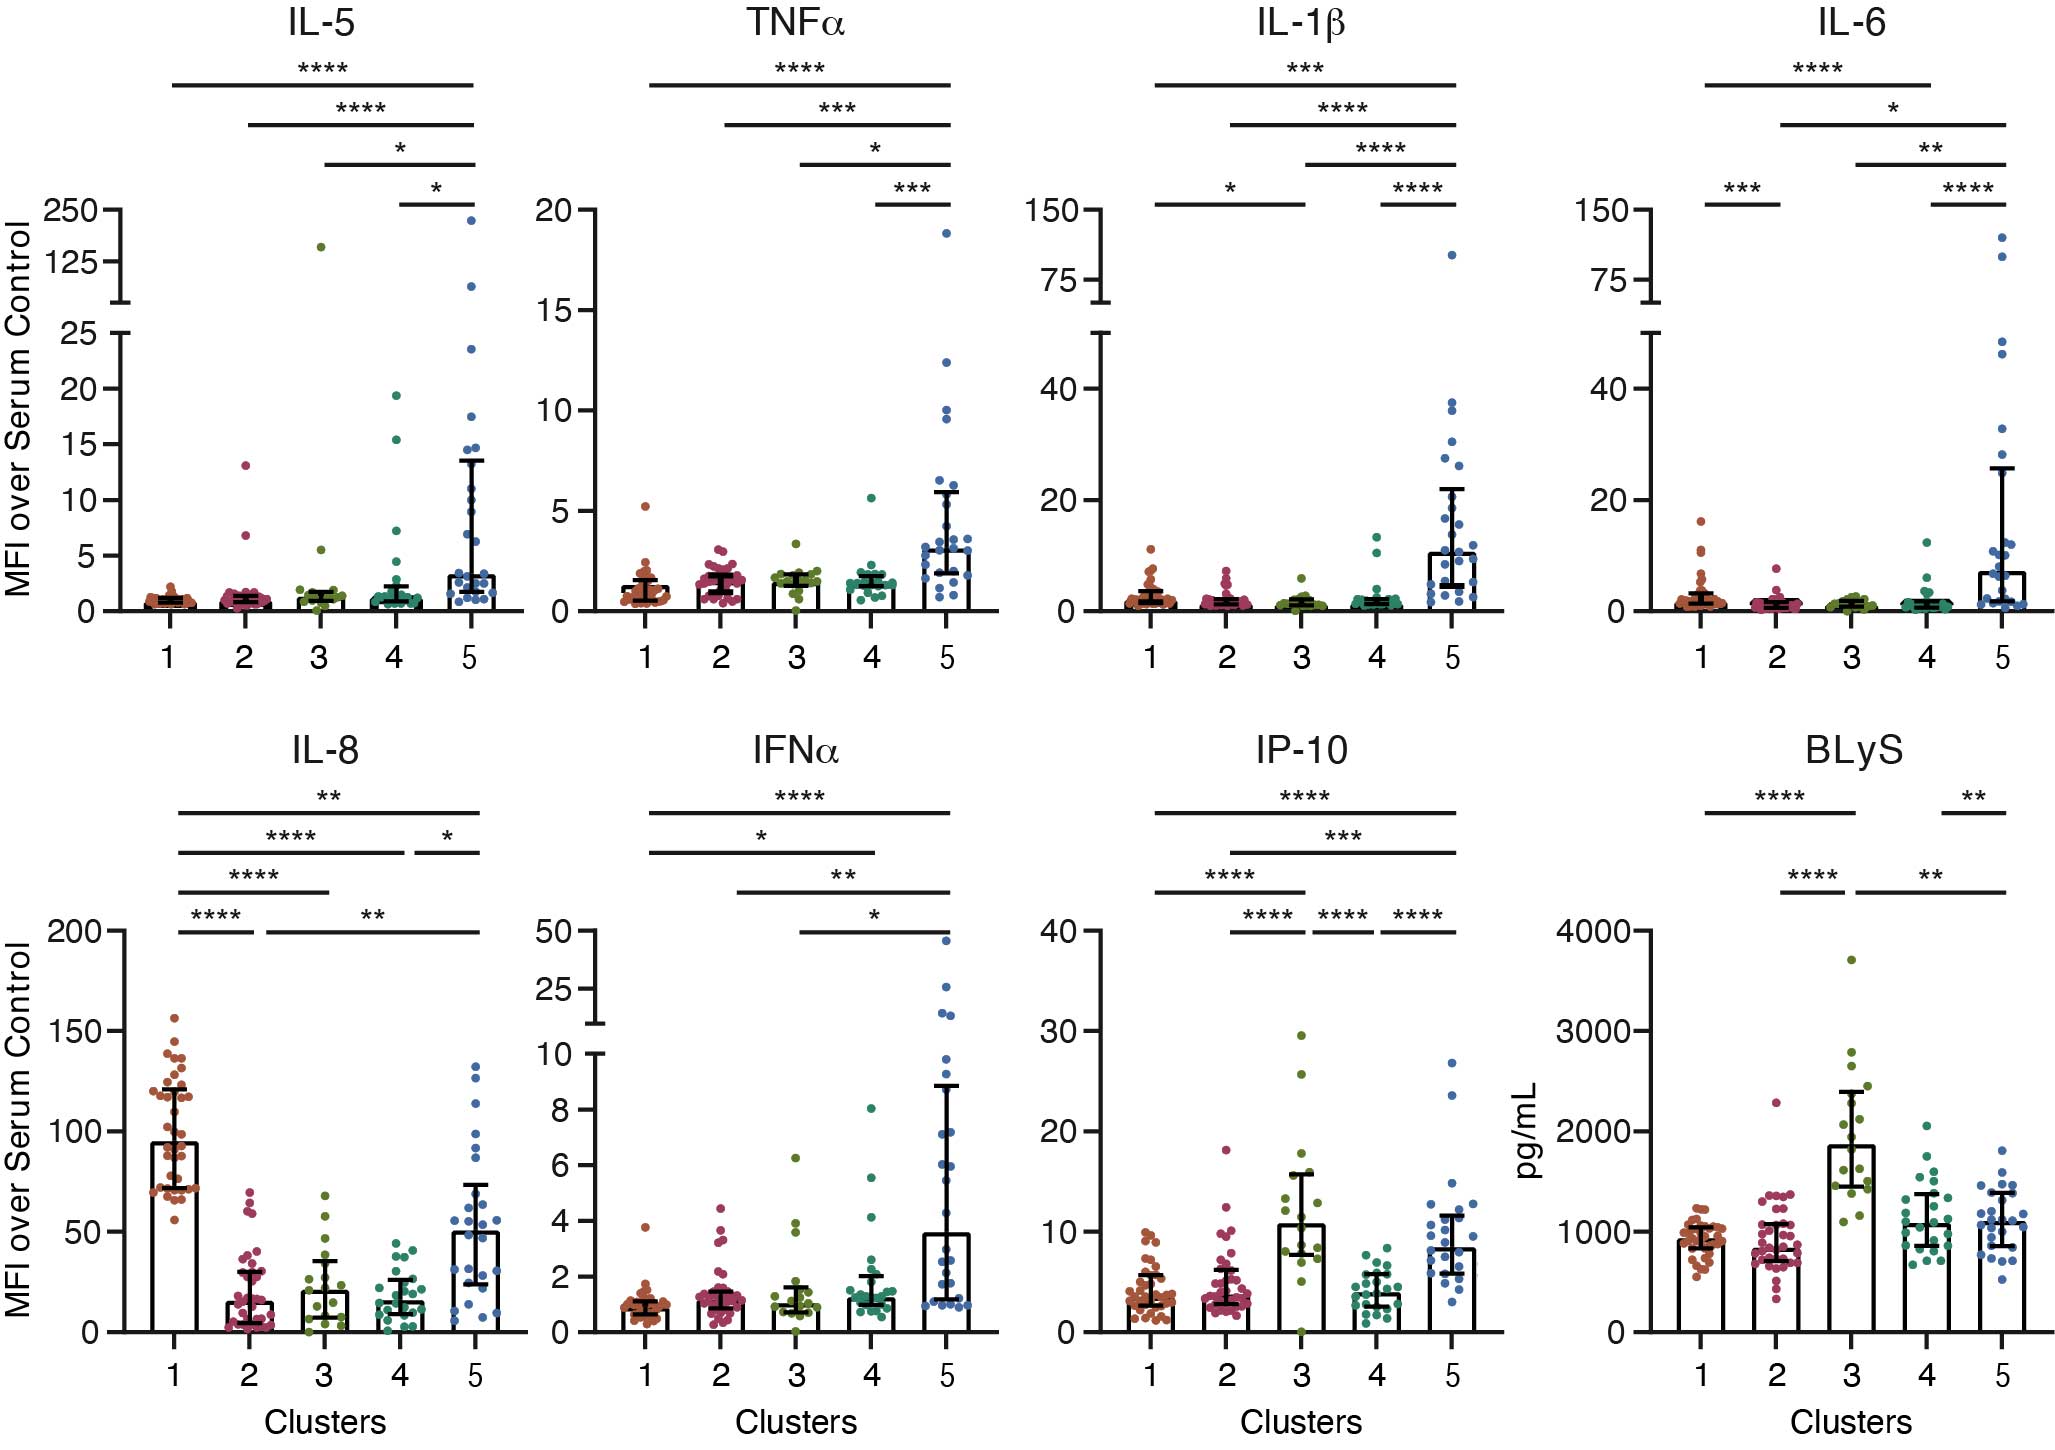
Results: EBV-EA antibody levels were significantly higher in SARD and RA patients compared to controls but not in other disease groups (Figure 1A). We identified 11 biomarkers that correlated with EBV-EA antibody levels (p-value < 0.1), including IP-10, BLyS, CRP, cotinine, IL-8, MIP-1a, IL-1b, IL-5, IFNa, TGFb, and SCF (Figure 1B). Specifically, EBV-EA antibody levels positively correlated with IP-10 (r=0.615; p=0.001) and BLyS (r=0.494; p=0.012) and negatively correlated with MIP-1 alpha (r=-431; p=0.032) in SARD but not RA patients. In contrast, EBV-EA antibodies negatively correlated with CRP (r=-0.356; p=0.028) in RA but not in SARD patients. Hierarchical clustering of all subjects using these biomarkers revealed 5 patient clusters (Figure 1C). Each cluster differed in the composition of disease groups; however, all disease groups were represented in each cluster (Figure 2A). Although the frequencies of ACR SLE criteria did not differ significantly between clusters (Figure 2B), the frequency of arthritis in 3 or more joints was significantly higher in Cluster 5 compared to Cluster 3 (Figure 2C), consistent with the high prevalence of RA patients in this cluster. Clusters also differed in soluble mediator levels (Figure 3). For example, Cluster 5 had elevated levels of many different cytokines, chemokines, and soluble receptors, in particular IL-5 and TNFa. Cluster 1 exhibited higher concentrations of a smaller set of mediators, such as IL-1b, IL-6, and IL-8, compared to clusters 2, 3, and 4. Cluster 3 had the highest levels of IP-10 and BLyS.
Conclusion: We found that EBV-EA antibody levels are elevated in NA SARD and RA patients compared to controls. EBV-EA antibody levels correlated with IFN-associated IP-10 and BLyS in NA SARD patients but not in RA patients. Clustering of subjects based on biomarkers associated with EBV-EA antibodies revealed 5 patient clusters with differing levels of soluble mediators. Importantly, disease groups were found across clusters, suggesting similar pathogenic mechanisms between diseases.
 EBV reactivation is elevated in Native American RA and systemic autoimmune rheumatic disease (SARD) patients and correlates with soluble mediators and distinct patient clusters. (A) EBV-early antigen (EA) antibody levels were measured by ELISA. Statistical significance was determined using Kruskal-Wallis test with Dunn’s multiple comparisons. **p < 0.01, ***p < 0.001. (B) Spearman correlation was used to compare EBV-EA antibody levels to biomarker concentrations. Heatmap represents Spearman’s rank correlation coefficients of biomarkers with p-values < 0.1. (C) Hierarchical clustering of patients and controls using z-scores of biomarkers identified in (B). Z-scores are shown on a gradient scale from red (maximum) to blue (minimum). Clusters are designated by blue bars.
 Disease groups and ACR classification criteria of the patient clusters. (A) Frequency of each disease group in the patient clusters. (B,C) Frequencies of (B) SLE-associated and (C) RA-associated ACR classification criteria in the patient clusters.
 Figure 3. Comparison of select soluble mediator concentrations in each patient cluster. Soluble mediator concentrations that significantly differ between patient clusters. Statistical significance was determined using Kruskal-Wallis test with Dunn’s multiple comparisons. *p < 0.05, **p < 0.01, ***p < 0.001, ****p < 0.0001
Disclosures: C. Guthridge, None; C. Wagner, None; S. Khan, None; M. Peercy, None; B. Saunkeah, None; J. Guthridge, None; J. James, Bristol-Myers Squibb(BMS), AstraZeneca, Novartis, Progentec Biosciences.
Background/Purpose: EBV infection is associated with autoantibody development in the preclinical period of rheumatic diseases, such as SLE and RA. Furthermore, EBV reactivation, characterized by EBV early antigen (EBV-EA) antibody production, correlates with IFN pathway activation and elevated disease activity. However, although Native American (NA) individuals experience a higher prevalence, severity, and mortality from rheumatic diseases, the relationship between EBV and autoimmune rheumatic diseases has not been studied explicitly in these patients. This study characterizes the relationship between serologic evidence of EBV reactivation and serum biomarkers in NA rheumatic disease patients.
Methods: NA patients with RA (n=38), SLE/Sjögren's syndrome (systemic autoimmune rheumatic disease, SARD; n=25), polyarthralgia/OA (n=30), polyarthritis/UCTD (n=19), and healthy controls (n=31) provided serum samples for determination of serum levels of autoantibodies, cytokines, chemokines, CRP, vitamin D, cotinine, and viral (EBV, CMV, HSV) antibodies.
Results: EBV-EA antibody levels were significantly higher in SARD and RA patients compared to controls but not in other disease groups (Figure 1A). We identified 11 biomarkers that correlated with EBV-EA antibody levels (p-value < 0.1), including IP-10, BLyS, CRP, cotinine, IL-8, MIP-1a, IL-1b, IL-5, IFNa, TGFb, and SCF (Figure 1B). Specifically, EBV-EA antibody levels positively correlated with IP-10 (r=0.615; p=0.001) and BLyS (r=0.494; p=0.012) and negatively correlated with MIP-1 alpha (r=-431; p=0.032) in SARD but not RA patients. In contrast, EBV-EA antibodies negatively correlated with CRP (r=-0.356; p=0.028) in RA but not in SARD patients. Hierarchical clustering of all subjects using these biomarkers revealed 5 patient clusters (Figure 1C). Each cluster differed in the composition of disease groups; however, all disease groups were represented in each cluster (Figure 2A). Although the frequencies of ACR SLE criteria did not differ significantly between clusters (Figure 2B), the frequency of arthritis in 3 or more joints was significantly higher in Cluster 5 compared to Cluster 3 (Figure 2C), consistent with the high prevalence of RA patients in this cluster. Clusters also differed in soluble mediator levels (Figure 3). For example, Cluster 5 had elevated levels of many different cytokines, chemokines, and soluble receptors, in particular IL-5 and TNFa. Cluster 1 exhibited higher concentrations of a smaller set of mediators, such as IL-1b, IL-6, and IL-8, compared to clusters 2, 3, and 4. Cluster 3 had the highest levels of IP-10 and BLyS.
Conclusion: We found that EBV-EA antibody levels are elevated in NA SARD and RA patients compared to controls. EBV-EA antibody levels correlated with IFN-associated IP-10 and BLyS in NA SARD patients but not in RA patients. Clustering of subjects based on biomarkers associated with EBV-EA antibodies revealed 5 patient clusters with differing levels of soluble mediators. Importantly, disease groups were found across clusters, suggesting similar pathogenic mechanisms between diseases.
 EBV reactivation is elevated in Native American RA and systemic autoimmune rheumatic disease (SARD) patients and correlates with soluble mediators and distinct patient clusters. (A) EBV-early antigen (EA) antibody levels were measured by ELISA. Statistical significance was determined using Kruskal-Wallis test with Dunn’s multiple comparisons. **p < 0.01, ***p < 0.001. (B) Spearman correlation was used to compare EBV-EA antibody levels to biomarker concentrations. Heatmap represents Spearman’s rank correlation coefficients of biomarkers with p-values < 0.1. (C) Hierarchical clustering of patients and controls using z-scores of biomarkers identified in (B). Z-scores are shown on a gradient scale from red (maximum) to blue (minimum). Clusters are designated by blue bars.
  Disease groups and ACR classification criteria of the patient clusters. (A) Frequency of each disease group in the patient clusters. (B,C) Frequencies of (B) SLE-associated and (C) RA-associated ACR classification criteria in the patient clusters.
  Figure 3. Comparison of select soluble mediator concentrations in each patient cluster. Soluble mediator concentrations that significantly differ between patient clusters. Statistical significance was determined using Kruskal-Wallis test with Dunn’s multiple comparisons. *p < 0.05, **p < 0.01, ***p < 0.001, ****p < 0.0001
Disclosures: C. Guthridge, None; C. Wagner, None; S. Khan, None; M. Peercy, None; B. Saunkeah, None; J. Guthridge, None; J. James, Bristol-Myers Squibb(BMS), AstraZeneca, Novartis, Progentec Biosciences.

