Poster Session A
Rheumatoid arthritis (RA)
0055: Protective Role for Mast Cells in TNF-induced Inflammatory-Erosive Arthritis and Its Associated Lymphatic Dysfunction in Mice
- YP
Yue Peng, MS
University of Rochester
Rochester, NY, United States
Abstract Poster Presenter(s)
Background/Purpose: Inflammatory-erosive arthritis is exacerbated by lymphatic dysfunction (1). Mast cells (MCs) regulate lymphatic vessels by releasing inflammatory and vasoactive mediators (e.g. histamine) (2). Previous studies emphasized the pro-inflammatory role of MCs in rheumatoid arthritis (3), while recent studies identified their role in M2 vs. M1 macrophage transition, and anti-inflammatory effects in tissues (4). Here we aimed to elucidate the effects of MCs on lymphatic function and inflammatory-erosive arthritis in tumor necrosis factor transgenic (TNF-Tg) mice, which exhibit defects in ankle joint-draining popliteal lymphatic vessels (PLVs).
Methods: Whole mount immunofluorescent microscopy (WMIFM) and toluidine blue (TB) stained histochemistry were performed to quantify peri-PLV MCs. Scanning electron microscopy (SEM) was used to visualize peri-PLV MCs (n=2 wild-type (WT) mice). Ankle bone volumes were assessed by μCT as a biomarker of erosive arthritis in WT, TNF-Tg, and KitW-sh/W-sh (cKit-/-) mice (5) that have a selective hematopoietic deficit in MCs. Near-infrared indocyanine green (NIR-ICG) lymphatic imaging was used to quantify ICG clearance, an outcome measure of PLV draining function (1). 4-month-old female TNF-Tg mice received cromolyn sodium, a clinically used MC stabilizer (3.15mg/g/day/i.p., n=6), or saline (n=5) for 3 weeks. In vivo measurements including ICG clearance and μCT were collected at baseline and after 6-weeks of treatment, followed by ex vivo WMIFM and TB histology.
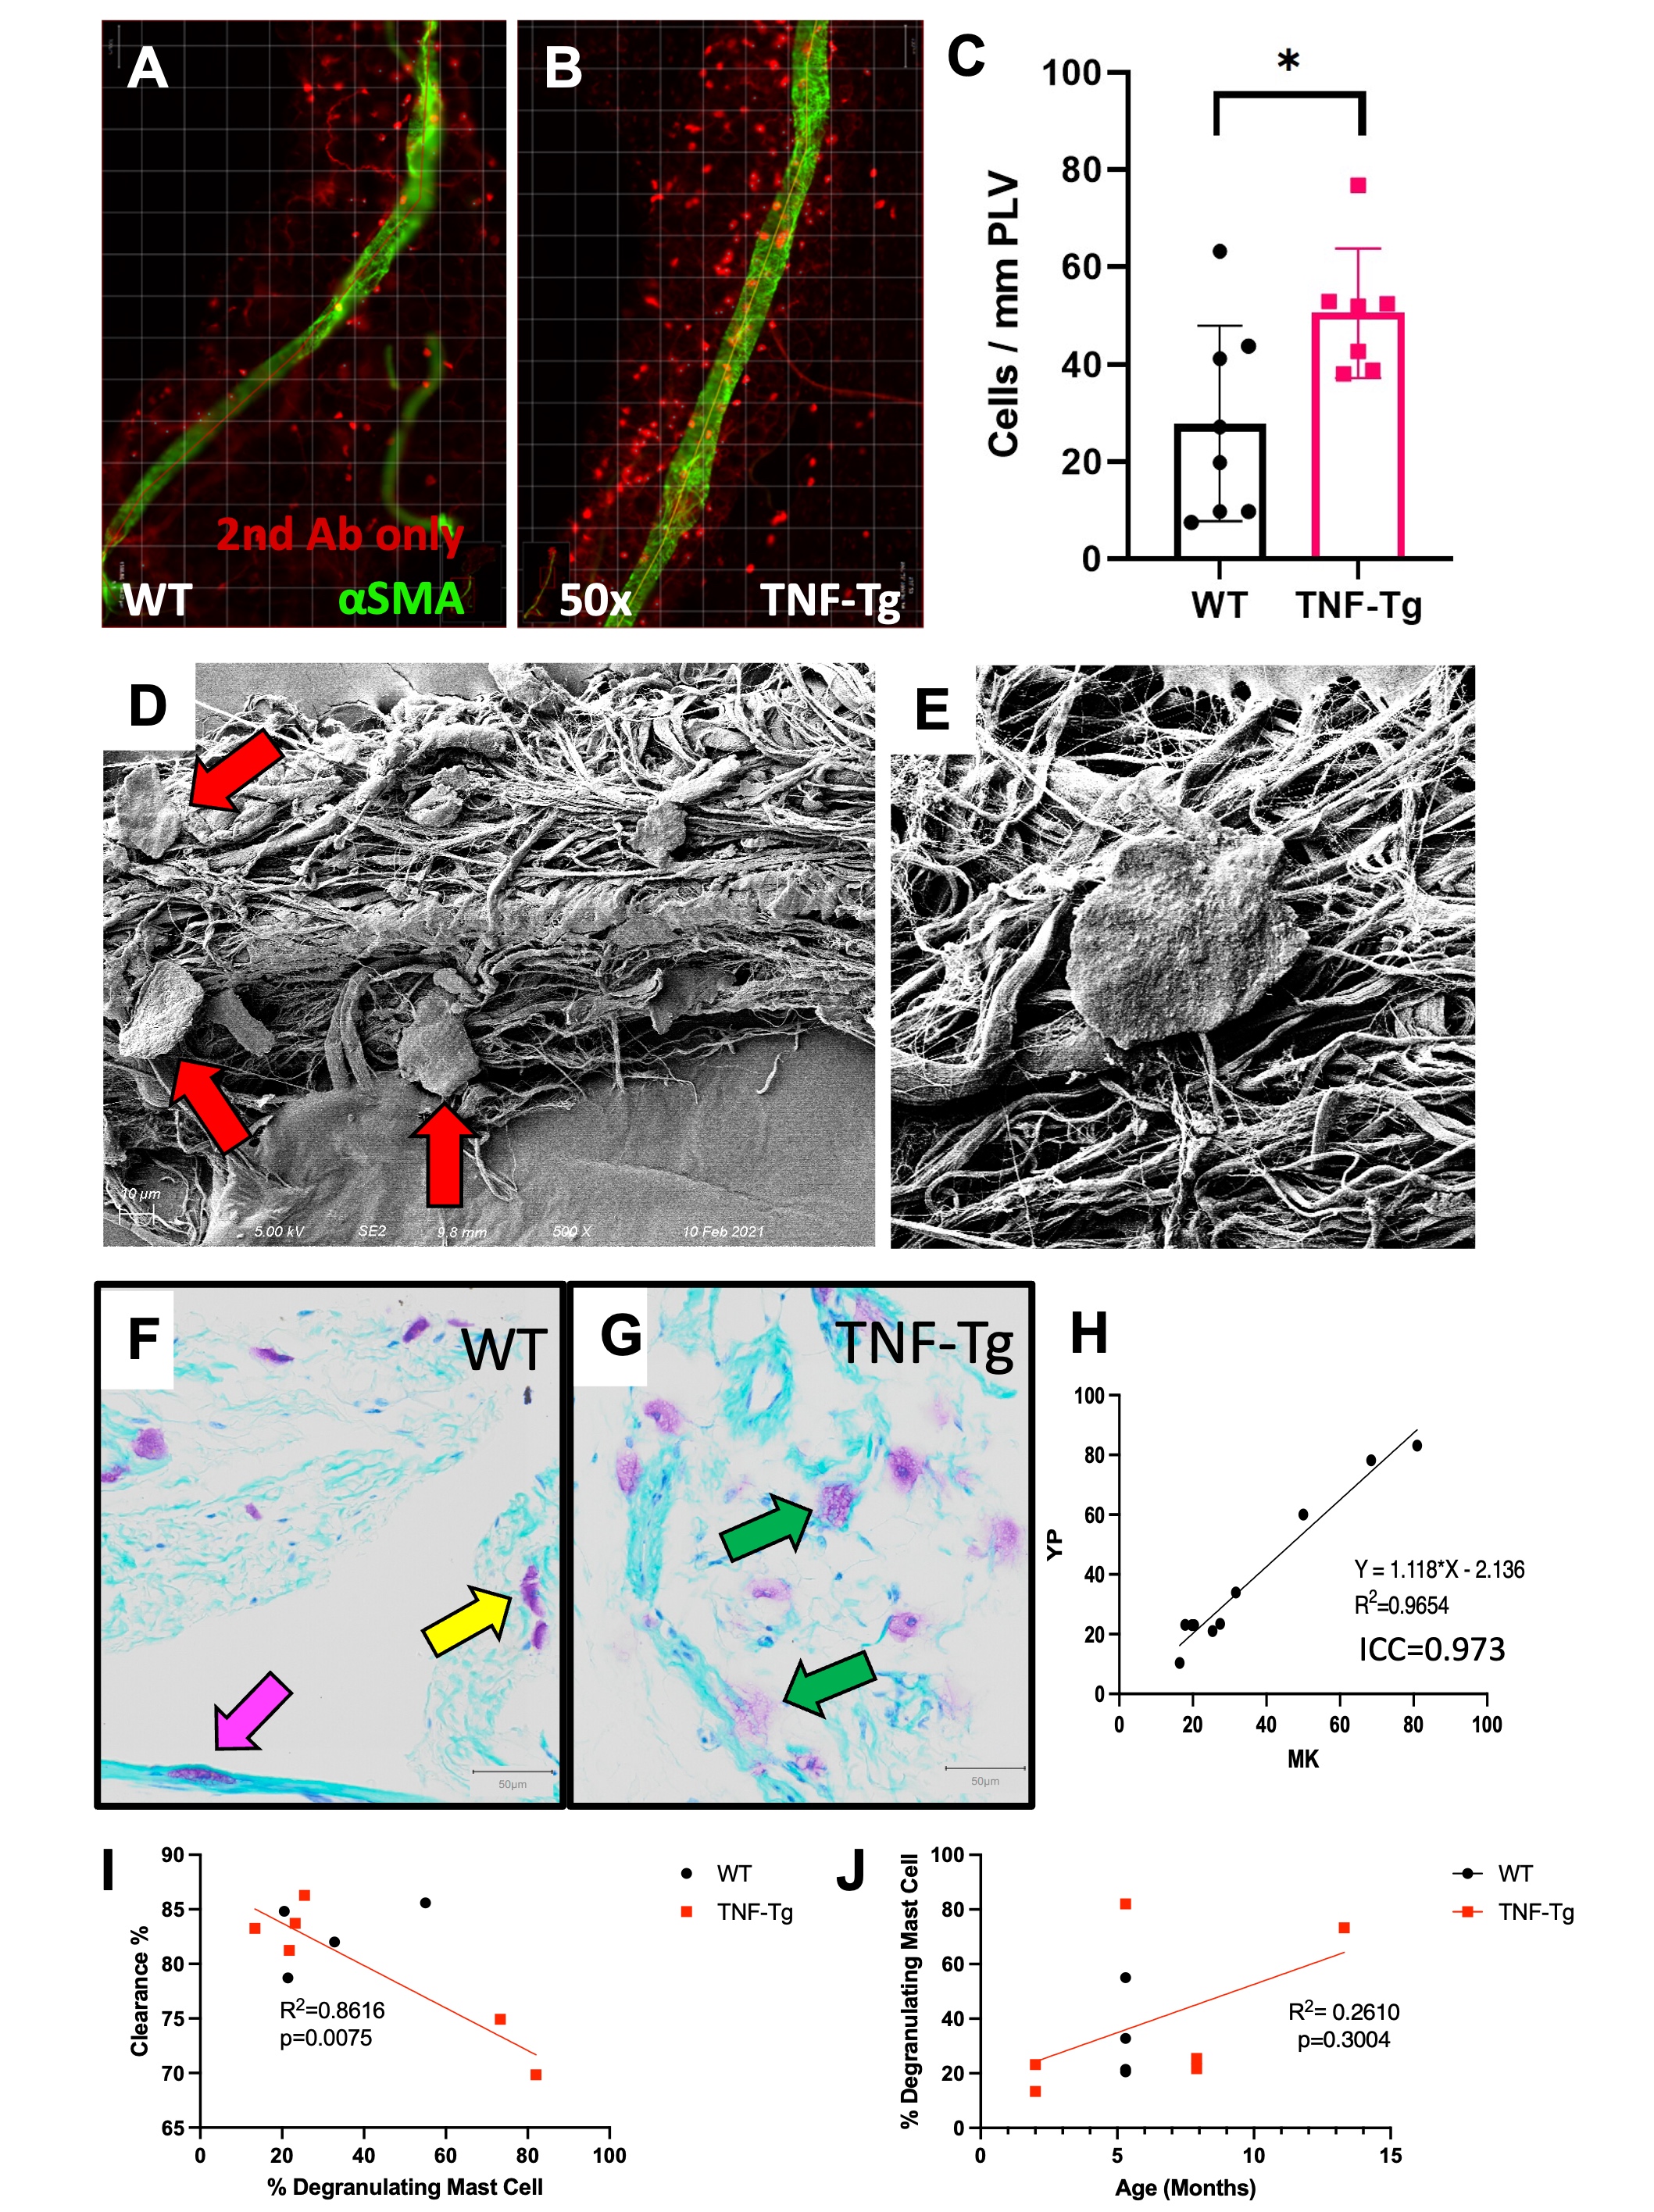
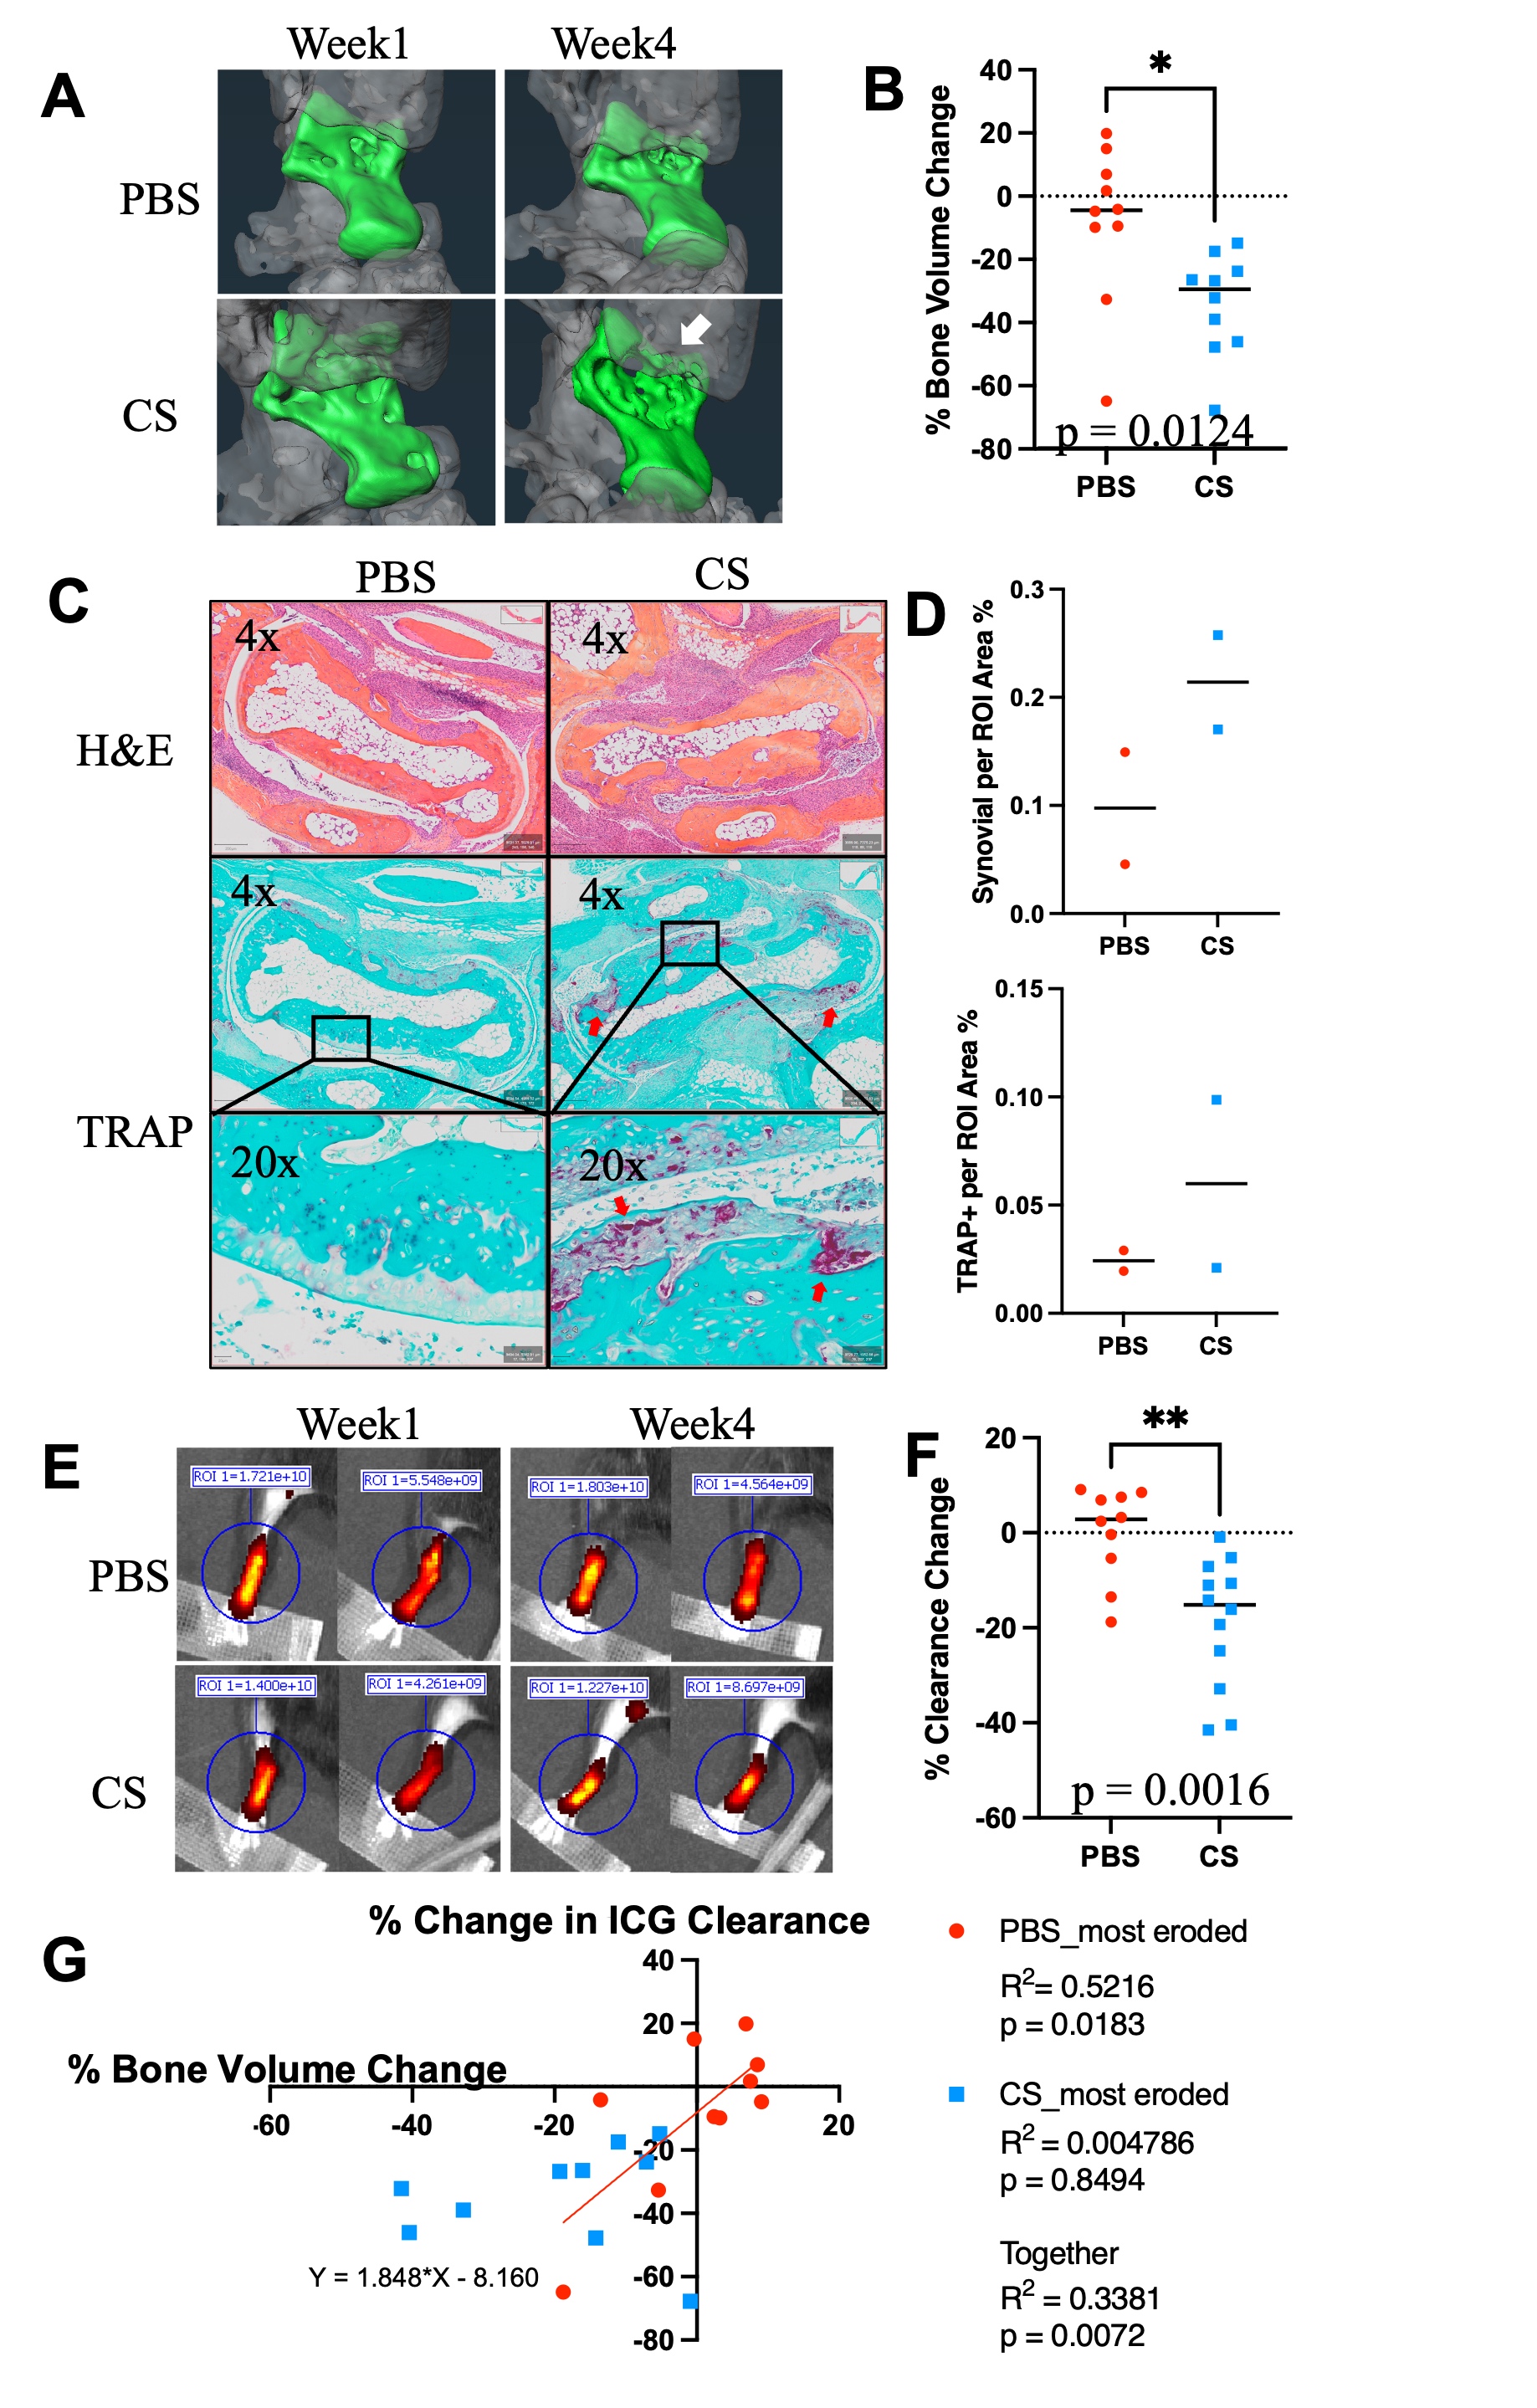
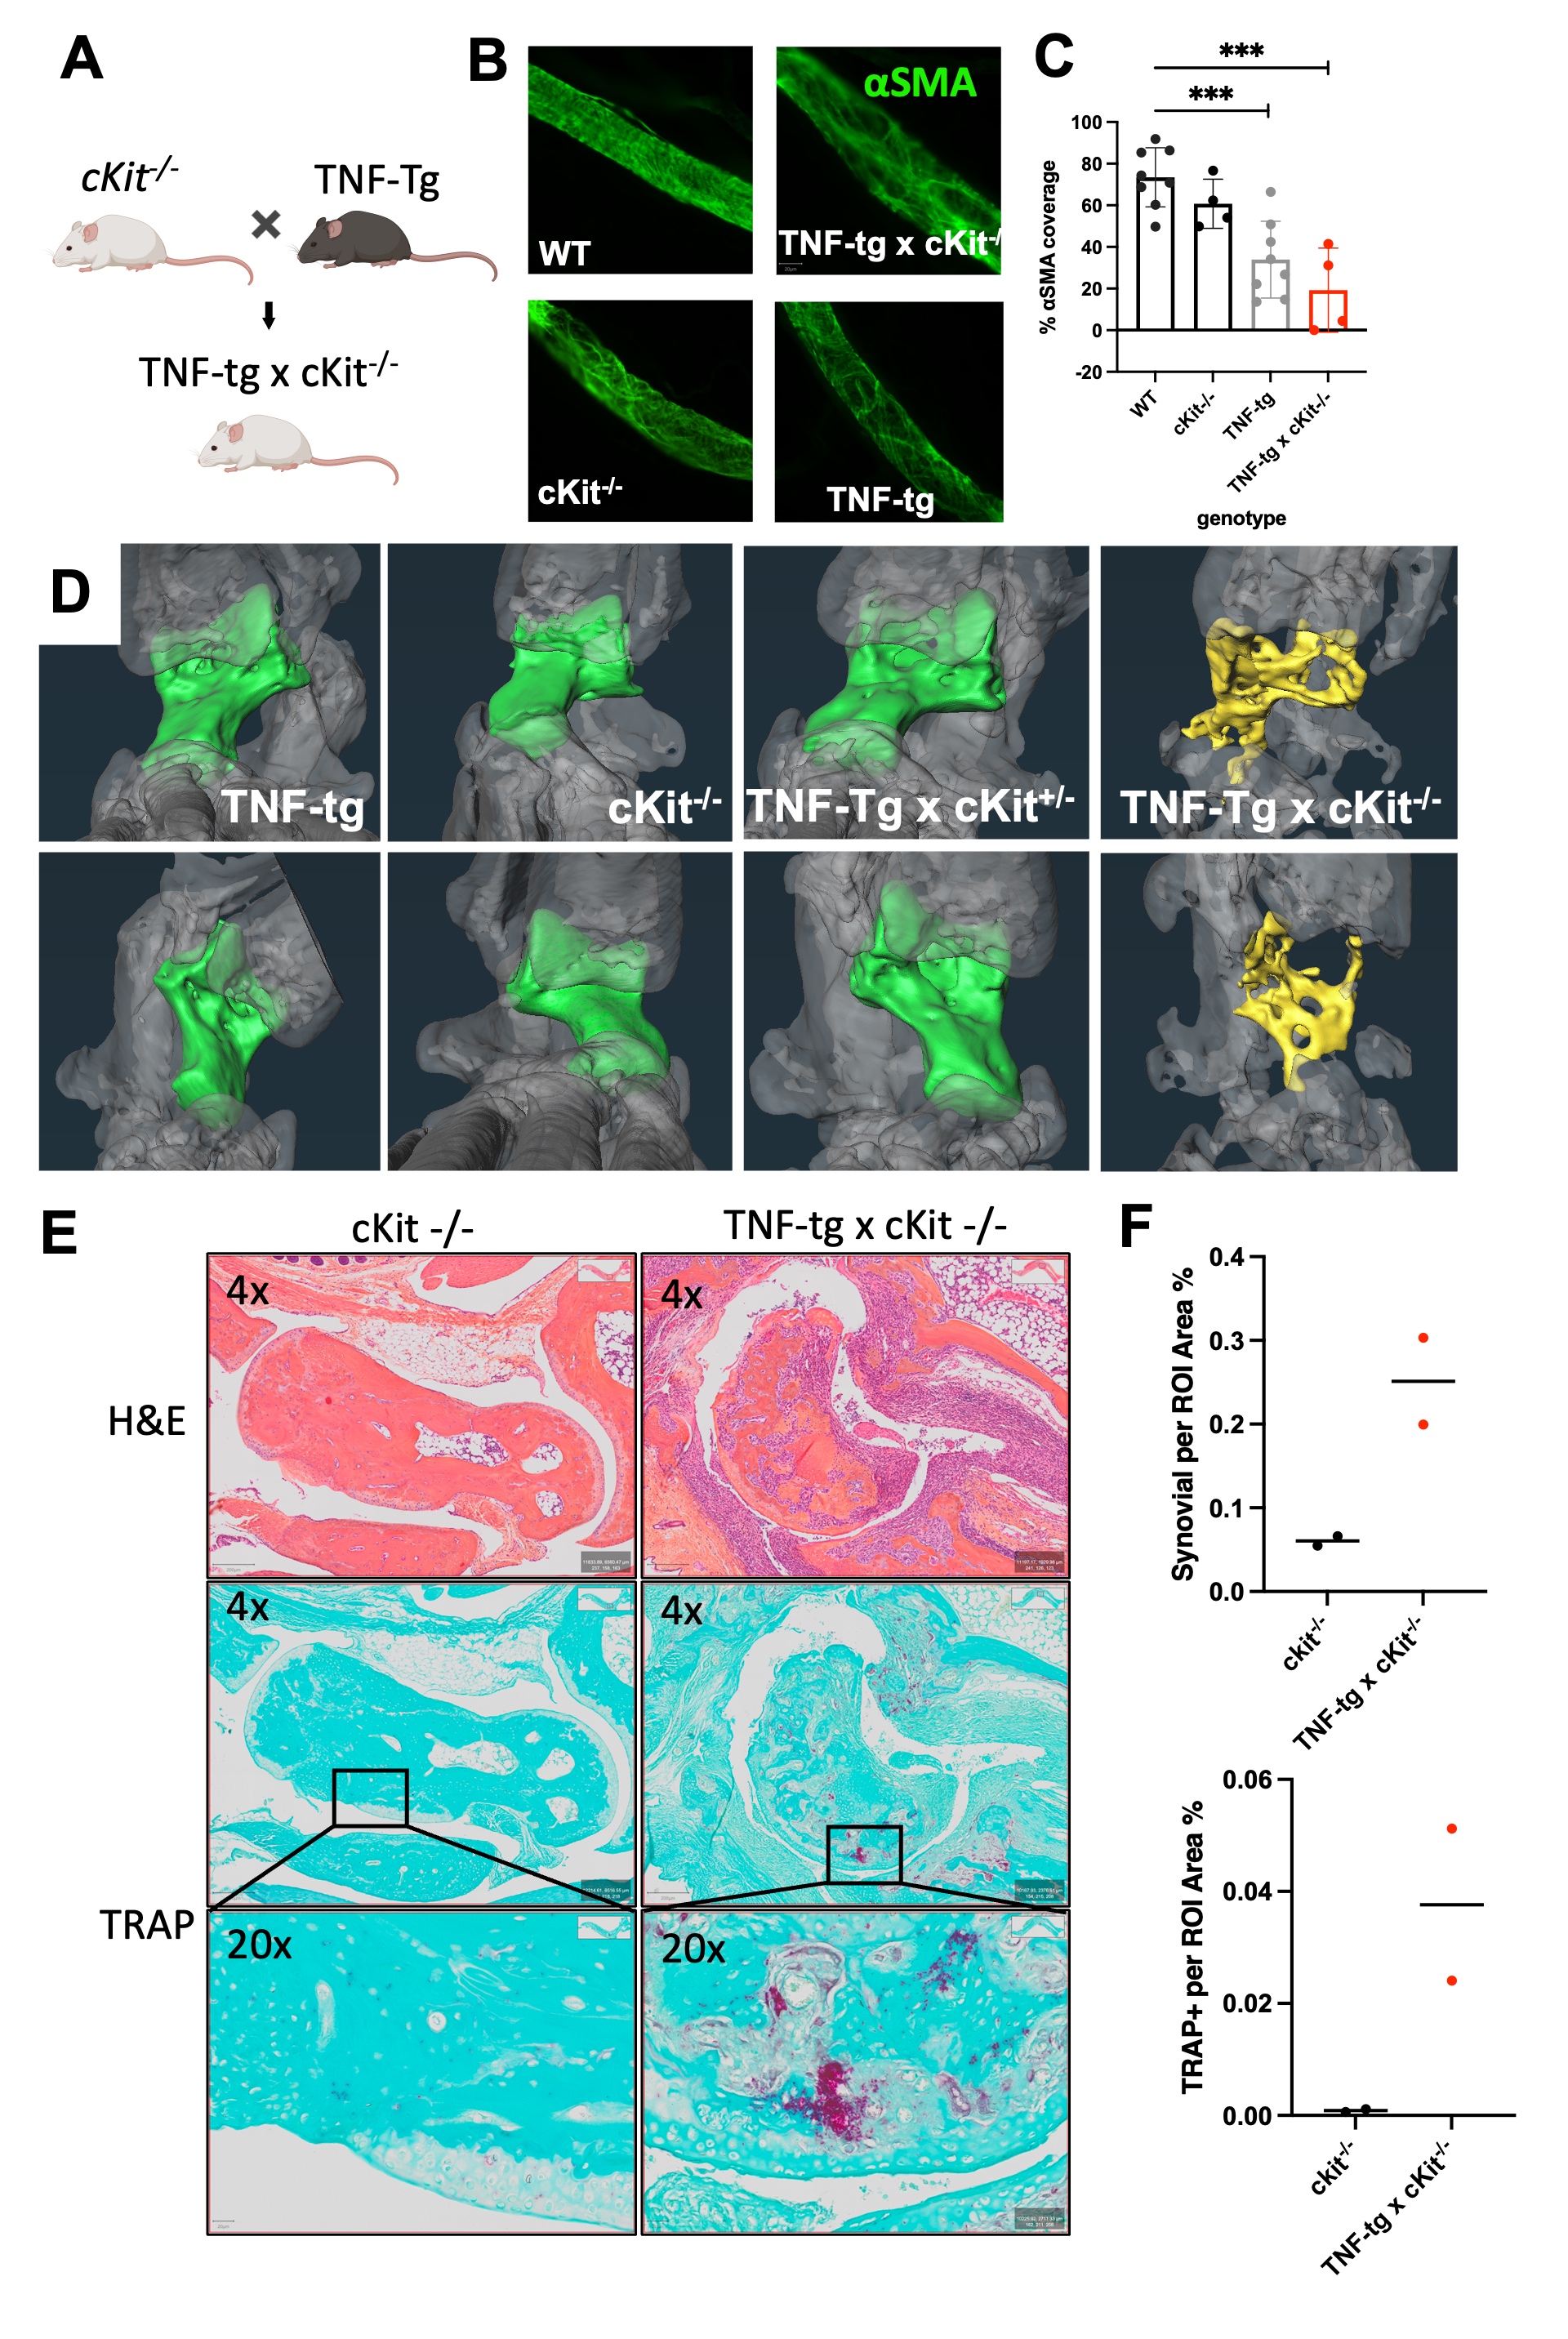
Results: WMIFM and TB histochemistry demonstrated a significant increase in the number of peri-PLV MCs in TNF-Tg vs. WT littermates, and SEM confirmed the peri-PLV localization of MCs (Figure 1). Moreover, the percentage of degranulating TB-stained MCs was inversely correlated with ICG clearance (Figure 1). TB-staining also identified intra-PLV MCs. Cromolyn sodium therapy significantly exacerbated TNF-induced bone loss, and decreased ICG clearance (Figure 2). Bone erosions and ICG clearance were also exacerbated in cKit-/- x TNF-Tg vs. TNF-Tg mice, which was associated with a similar reduction of PLV αSMA coverage in both groups (Figure 3).
Conclusion: TNF-Tg mice exhibit increased numbers of peri-PLV MCs with increased proportions of activated/degranulated MCs, which are inversely correlated with lymphatic function. Genetic ablation of MCs and pharmacological inhibition of MC degranulation both exacerbate TNF-induced inflammatory-erosive arthritis with decreased lymphatic clearance. Together, these findings support an inflammatory role of activated/degranulated peri-PLV MCs during arthritic progression, and a homeostatic role of intra-PLV MCs, in which loss of the later is dominant. Future studies to test this hypothesis towards elucidating MC regulation of lymphatic function and arthritic flare are warranted.
Reference
1. Bouta et al. Nat Rev Rheum. 14(2):94-106. 2018.
2. Pal et al. Front Immunol. 11:1234. 2020
3. Nigrovic et al. Arthritis Res Ther. 7(1):1-1. 2004
4. Wang et al. BioRxiv. 2021.
5. Grimbaldeston et al. Amer J Pathol. 167(3):835-48. 2005. Figure 1. Identification of increased peri-PLV MCs with greater degranulation in TNF-Tg mice. PLVs were harvested and processed for whole mount immunofluorescent microscopy with antibodies specific for αSMA (green) and an IgG2b isotype control (red), and representative images of WT (A) and TNF-Tg (B) PLVs are shown. The number of peri-PLV red cells per mm of WT (n=8) and TNF-Tg (n=7) PLV from male mice at indicated age was quantified, and the data for each PLV are presented with the mean ± SD (C, *p < 0.05 via unpaired t-test). Scanning electron microscopy was performed on WT PLVs with attached peri-lymphatic tissue, and representative images obtained at x500 (D) and x5,000 (E) highlighting MCs with their typical pancake-shape (red arrows). Toluidine blue and fast green stained histochemistry was also performed on WT (F) and TNF-Tg (G) PLVs, and representative x20 images illustrate the non-degranulating peri-PLV MCs (yellow arrow) with dark staining and clear membrane borders in WT PLV, versus the MCs with intracellular vacuoles and ruptured plasma membranes (green arrows) associated with TNF-Tg PLV. We also observed intra-PLV MCs (pink arrow). (H) The ratio of degranulating:non-degranulating MCs per PLV was quantified and compared with lymphatic clearance determined by in vivo NIR-ICG imaging. The data are presented as linear regressions of ICG clearance % vs. % degranulating mast cells (I), and % degranulating MCs vs. age (J) (n=6 for TNF-Tg, n=4 for WT). Note the significant correlation between % degranulating mast cells and ICG clearance, and lack of relationship between % degranulating mast cells and age of mice.
 Figure 2. Cromolyn sodium exacerbates bone erosion, increases synovial hyperplasia and reduces PLV clearance in TNF-Tg mice. Ten 4-month-old male TNF-Tg mice received baseline μCT and NIR-ICG scans to determine ankle bone volume and lymphatic clearance respectively, and were randomized to 6-weeks of placebo (PBS) or cromolyn sodium (CS) treatment (n = 5 mice; 10 hindlimbs). Terminal μCT and NIR-ICG scans were performed, and the % change in ankle bone volume and ICG clearance from baseline were quantified. (A) Representative volume renderings of the talus from placebo and CS-treated mice are presented to illustrate the increased erosions (arrows) in CS treated mice. (B) The % change in TCFI (talus + cuboid + fused navicular/lateral cuneiform + intermediate cuneiform) bone volume for each ankle is presented with the mean +/- SD (*p < 0.05). (C) Taluses from mice treated with PBS or cromolyn sodium were harvested together with PLVs for H&E and TRAP-stained histology. Representative images are shown at x4 and x20 to illustrate the synovial hyperplasia and osteoclastic bone erosion. (D) Histomorphometry shows trending increases in synovial and TRAP+ area, consistent with the levels of inflammatory-erosive arthritis observed by Micro-CT (A). (E) NIR-ICG images of lower limbs from the placebo and CS-treated mice with the median % ICG clearance are presented to illustrate the decrease in lymphatic function in CS-treated mice (**p < 0.01) (F). (G) Linear regression analyses were performed to assess the correlation of % change in TCFI bone volume vs. ICG clearance, and the data for each leg are presented with the Pearson Correlation Coefficient and p-value. Note the significant correlation in PBS, but not CS-treated groups, suggesting a potential arthritic stage dependent effect of CS.
  Figure 3. TNF-Tg PLVs exhibit reduced PLV αSMA coverage, while bone erosions are exacerbated with increased synovial hyperplasia and osteoclastic bone resorption in MC deficient TNF-Tg x cKit-/- mice. (A) MC and melanocyte deficient (white fur) KitW-sh/W-sh mice in a C57/B6 background were crossed with TNF-Tg mice a C57/B6 background to generate TNF-Tg x cKit-/- dirty coat mice in a C57/B6 background. (B) PLVs were harvested and processed for whole mount immunofluorescent microscopy. Representative x20 images of αSMA+ PLV-LMC coverage (green) with quantification of αSMA coverage (C, αSMA coverage as a percent of total PLV area) are shown for all groups. Each data point for αSMA coverage represents individual PLVs. Statistics: All data are reported as mean ± standard deviation (SD). Unpaired t-test, (***p < 0.001, TNF-Tg vs. TNF-Tg x cKit-/- p = 0.2374). (D) Micro-CT was performed, and talus bone volumes (colored bone within the remaining transparent grey ankle joint) were quantified. (E) Histologic evidence of talus bone erosion in TNF-Tg x cKit-/- mice compared to cKit-/- mice. Taluses from TNF-%g x cKit-/- or cKit-/- mice were harvested at 4.5 month of age for histologic analysis with H&E and TRAP staining. Representative images are shown at x4 and x20 to illustrate peri-talus inflammation and osteoclastic bone erosion. (F) Histomorphometry shows trending increases in synovial and TRAP+ area, consistent with the levels of inflammatory-erosive arthritis observed by Micro-CT (D).
Disclosures: Y. Peng, None; H. Kenney, None; K. Bentley, None; L. Xing, None; C. Ritchlin, UCB, AbbVie, Eli Lilly, Pfizer Inc, Novartis, Janssen, Bristol-Myers Squibb; E. Schwarz, None.

