Back
Poster Session A
Vasculitis
Session: (0458–0497) Vasculitis – Non-ANCA-Associated and Related Disorders Poster I: Giant Cell Arteritis
0458: Predictive Models for Thromboembolic Events in Giant Cell Arteritis: A US Veterans Health Administration Population-Based Study
Saturday, November 12, 2022
1:00 PM – 3:00 PM Eastern Time
Location: Virtual Poster Hall
- DM
Despoina Michailidou, MD
University of Washington
Seattle, WA, United States
Abstract Poster Presenter(s)
Despina Michailidou1, Tianyu Zhang2, Andreas Diamantopoulos3, Pavlos Stamatis4 and Bernard Ng5, 1Division of Rheumatology, University of Washington, Seattle, WA, 2Department of Biostatistics, University of Washington, Seattle, WA, 3Akershus University Hospital, Lørenskog, Norway, 4Department of Clinical Sciences Lund, Rheumatology, Lund University, Sweden, Larissa, Larisa, Greece, 5Rheumatology Section, VA Puget Sound Healthcare System, Seattle, WA
Background/Purpose: Giant cell arteritis (GCA) is an independent risk factor for thromboembolic events. The purpose of our study was to identify prognostic factors for thromboembolic events in patients with GCA and develop quantitative predictive tools for pulmonary embolism (PE) and deep venous thrombosis (DVT).
Methods: In this retrospective analysis we included a total of 13,029 patients with GCA. We investigated potential predictors of PE and DVT by using univariate and multivariate Cox regression models. Nomograms were then constructed based on the results of these Cox models. We also assessed the accuracy and predictive ability of our models by using calibration curves and cross-validation concordance index.
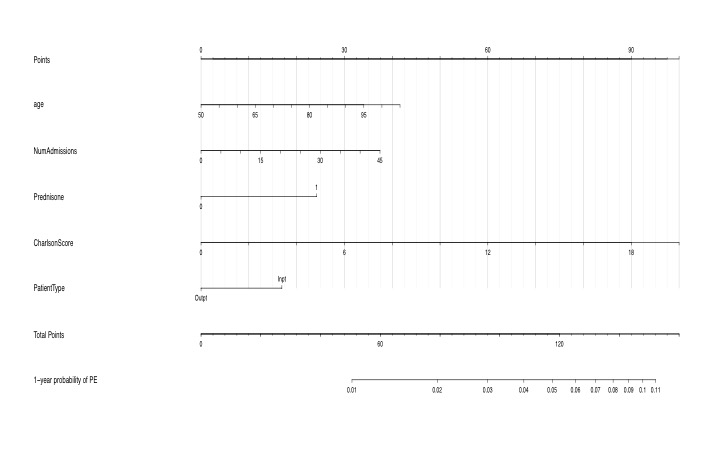
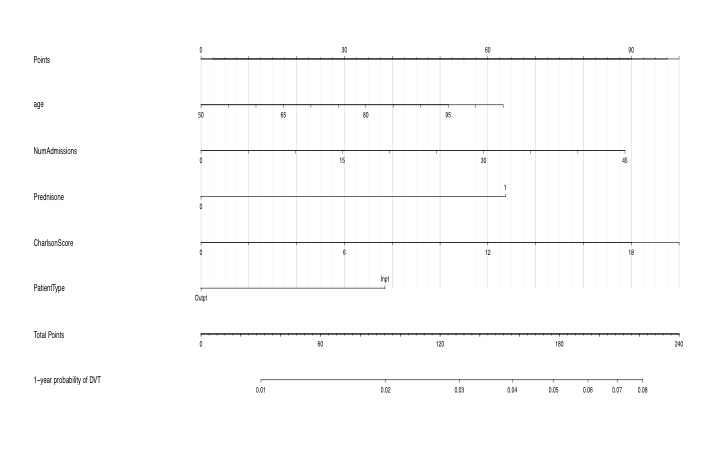
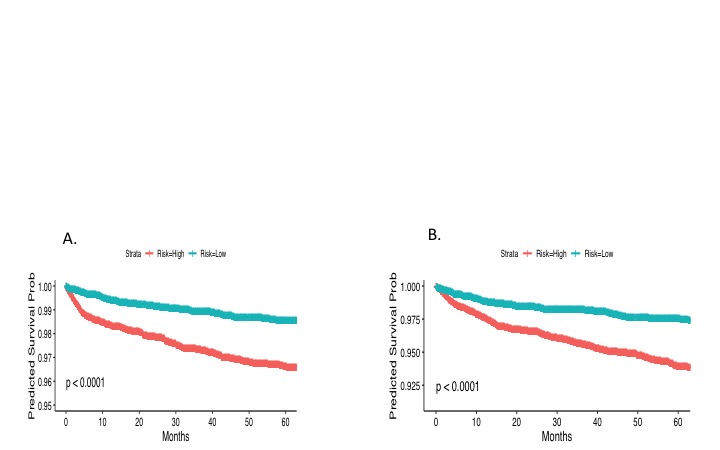
Results: Age, inpatient status at the time of initial diagnosis of GCA, number of hospitalizations after diagnosis of GCA, duration of glucocorticoid therapy for at least 6 months, and 5 year average Charlson score prior to the diagnosis of GCA were all found to be predictive factors of thromboembolic events. Prognostic nomograms were then prepared based on these predictors with promising prognostic ability (Figures 1 and 2). The probability of surviving thromboembolic events over an observation period of 5 years was illustrated with survival plots, after stratifying patients based on predicted risk (Figure 3). The concordance index of the survival models for both PE and DVT was 0.64, indicating a good predictive ability.
Conclusion: Our suggested nomograms based on specific prognostic factors can accurately predict the 1-year probability of developing PE or DVT among patients with GCA.
 Figure 1. Nomogram for predicting the 1-year probability of PE in patients with GCA. NumAdmissions, number of admissions; Outpt, outpatient; Inpt, inpatient
 Figure 2. Nomogram for predicting the 1-year probability of DVT in patients with GCA. NumAdmissions, number of admissions; Outpt, outpatient; Inpt, inpatient
 Figure 3. Kaplan-Meier plot for the time to PE (A) and DVT (B) from the time of diagnosis of GCA stratified by predicted risk (blue and red lines).
Disclosures: D. Michailidou, Chemocentryx, Pfizer US Pharmaceuticals Group; T. Zhang, None; A. Diamantopoulos, GE Royalties for lectures; P. Stamatis, None; B. Ng, None.
Background/Purpose: Giant cell arteritis (GCA) is an independent risk factor for thromboembolic events. The purpose of our study was to identify prognostic factors for thromboembolic events in patients with GCA and develop quantitative predictive tools for pulmonary embolism (PE) and deep venous thrombosis (DVT).
Methods: In this retrospective analysis we included a total of 13,029 patients with GCA. We investigated potential predictors of PE and DVT by using univariate and multivariate Cox regression models. Nomograms were then constructed based on the results of these Cox models. We also assessed the accuracy and predictive ability of our models by using calibration curves and cross-validation concordance index.
Results: Age, inpatient status at the time of initial diagnosis of GCA, number of hospitalizations after diagnosis of GCA, duration of glucocorticoid therapy for at least 6 months, and 5 year average Charlson score prior to the diagnosis of GCA were all found to be predictive factors of thromboembolic events. Prognostic nomograms were then prepared based on these predictors with promising prognostic ability (Figures 1 and 2). The probability of surviving thromboembolic events over an observation period of 5 years was illustrated with survival plots, after stratifying patients based on predicted risk (Figure 3). The concordance index of the survival models for both PE and DVT was 0.64, indicating a good predictive ability.
Conclusion: Our suggested nomograms based on specific prognostic factors can accurately predict the 1-year probability of developing PE or DVT among patients with GCA.
 Figure 1. Nomogram for predicting the 1-year probability of PE in patients with GCA. NumAdmissions, number of admissions; Outpt, outpatient; Inpt, inpatient
 Figure 2. Nomogram for predicting the 1-year probability of DVT in patients with GCA. NumAdmissions, number of admissions; Outpt, outpatient; Inpt, inpatient
 Figure 3. Kaplan-Meier plot for the time to PE (A) and DVT (B) from the time of diagnosis of GCA stratified by predicted risk (blue and red lines).
Disclosures: D. Michailidou, Chemocentryx, Pfizer US Pharmaceuticals Group; T. Zhang, None; A. Diamantopoulos, GE Royalties for lectures; P. Stamatis, None; B. Ng, None.

