Poster Session A - Sunday Afternoon
A0466 - Differences in Prevalence and Treatment of Hepatitis B Virus Infection in Asian and Black Patients
.jpeg.jpg)
Pranusha Atuluru, BS
University of Miami, Miller School of Medicine
Miami, FL
Presenting Author(s)
1University of Miami, Miller School of Medicine, Miami, FL; 2University of Miami Miller School of Medicine, Miami, FL; 3University of Miami/Jackson Health System, Miami, FL
Introduction: Hepatitis B virus (HBV) infection, an important cause of chronic liver disease, has a prevalence of 4.3% in the United States (US) and causes significant morbidity and mortality. Immigrants and racial/ethnic minorities are disproportionately burdened by HBV. Few studies have investigated characteristics of HBV infection and treatment by race; therefore, we sought to understand and compare risk factors, barriers to care, and treatment patterns in Blacks and Asians, the two most disproportionately impacted groups.
Methods: Using informatics, we identified patients with possible HBV based on ICD-10 code B18.1, who were seen between May 2010 and July 2021 at a tertiary referral center. We performed retrospective chart review to confirm infection and captured sociodemographic/clinical data. We used descriptive statistics, Kruskal-Wallis and Pearson’s chi squared tests to evaluate for differences between Black and Asian patients. Analyses were conducted using STATA 17.0(College Station, Texas).
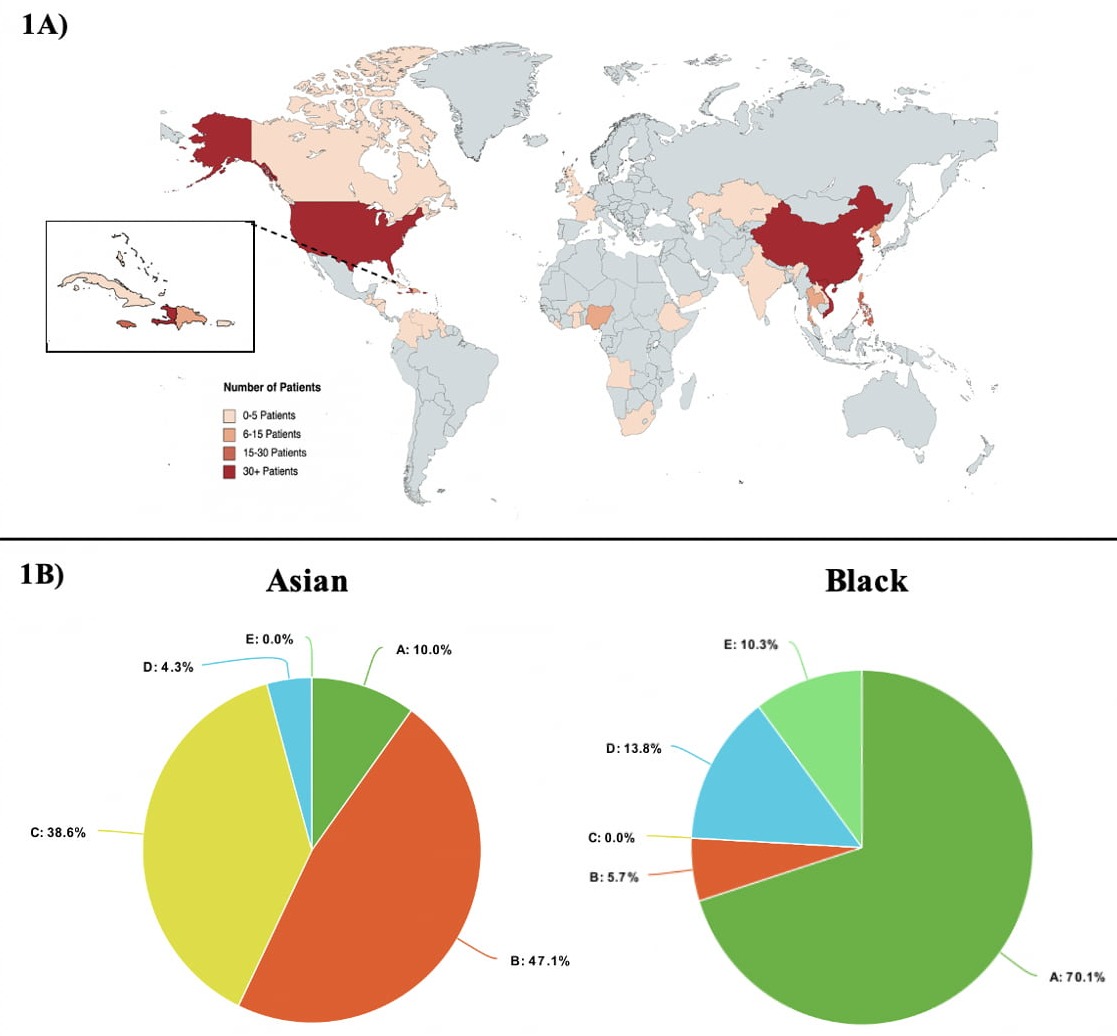
Results: Out of 673 patients, 509 had confirmed HBV: 308 Black and 201 Asian patients. Compared to Asians, Blacks were older and more likely to be male and US-born. Top birth countries included Haiti, 22%, US, 18%, China, 16%, and Vietnam, 8% (Fig 1a). Risk factors for HBV differed significantly; 44% of Asians had a family history of HBV compared to 8% of Blacks, p < 0.001 (Table 1). Clinical notes for Black patients were more likely to document history of injection drug use, blood transfusions and tattoos. The predominant HBV genotype was A in Blacks and B in Asians (Fig 1b). Despite no significant differences in prevalence of cirrhosis or infection phenotype, there were treatment differences; 60 % of Blacks vs. 70% of Asians were treated, p 0.04. More Black patients had concurrent HIV or HCV, 14% and 5%, respectively compared to 0-1% of HIV and HCV in Asians. NAFLD was more common in Asians, 27%, vs 12% in Blacks. While 97% of Blacks and 70% of Asians met Hepatocellular carcinoma (HCC) screening criteria, only 67% of Blacks and 44% of Asians of those meeting criteria were screened in the past twelve months.
Discussion: There are significant differences in risk factors, access to care and treatment between Black and Asian patients in our institution. Future studies should seek to understand barriers to treatment and the determinants of inadequate HCC screening in both Asian and Black patients, given the dire consequences of HBV-related HCC in these communities.

Table 1: Demographics and Clinical Characteristics of Black and Asian Patients with HBV |
| |||
Variable | Black | Asian | p-value |
|
(n = 308) | (n = 201) |
|
| |
Median Age, years (IQR) | 56.97 (46.21-65.1) | 51.54 (42.63-61.86) | 0.003 |
|
Male Gender, n (%) | 199 (64.8) | 103 (51.2) | 0.002 |
|
Hispanic Ethnicity, n (%) | 23 (8.1) | 3 (1.5) | 0.002 |
|
English-speakers, n (%) | 266 (86.4) | 182 (90.6) | < 0.001 |
|
US-Born, n (%) | 73 (32.9) | 9 (5.1) | < 0.001 |
|
Insurance Type, n (%) |
|
| < 0.001 |
|
Private | 185 (63.4) | 148 (74.8) |
|
|
Medicaid/Medicare | 93 (31.9) | 33 (16.7) |
|
|
Uninsured | 12 (4.1) | 12 (6.1) |
|
|
Married (not separated), n (%) | 146 (52.1) | 143 (72.6) | < 0.001 |
|
Risk Factors, n (%) |
|
|
| |
Intravenous Drug Use | 4 (1.4) | 1 (0.5) | < 0.001 |
|
Intranasal Cocaine | 19 (6.6) | 1 (0.5) | < 0.001 |
|
Non-IV Drug Use | 19 (6.6) | 1 (0.5) | < 0.001 |
|
Sexually Transmitted Diseases | 34 (11.9) | 5 (2.5) | < 0.001 |
|
Transfusions | 54 (19.2) | 16 (8.1) | < 0.001 |
|
Family history of hepatitis | 11 (3.9) | 6 (3.1) | < 0.001 |
|
Family history of HBV | 22 (7.6) | 87 (44.4) | < 0.001 |
|
Family history of HCC | 12 (4.2) | 37 (18.9) | < 0.001 |
|
Tattoos | 26 (9) | 9 (4.6) | < 0.001 |
|
Other Medical Conditions, n (%) Non-alcoholic Fatty Liver Disease (NAFLD) Human Immunodeficiency Virus (HIV) Hepatitis C Virus (HCV) |
32 (11.6) 39 (13.8) 13 (4.5) |
53 (27.2) 0 (0) 2 (1) |
< 0.0001 < 0.001 < 0.001 |
|
Ever Treated for HBV, n (%) | 166 (60.4) | 136 (69.7) | 0.037 |
|
Currently Treated for HBV, n (%) | 148 (52.5) | 105 (55) | 0.59 |
|
Phenotype, n (%) Immune tolerant HbeAg positive active ( > 20000 DNA) HbeAg negative active ( > 2000 DNA) Inactive carrier Indeterminate |
2 (0.8) 7 (2.7) 9 (3.5) 175 (67.6) 66 (25.5) |
1 (0.5) 2 (1) 6 (3.1) 117 (60.3) 68 (35.1) | 0.195 |
|
Met criteria for HCC Screening, n (%) | 299 (97.1) | 141 (70.2) | < 0.0001 |
|
HCC Screening < 6 months before visit, n (%) | 219 (76.6) | 91 (46.7) | < 0.001 |
|
HCC Screening < 12 months before visit, n (%) | 190 (66.7) | 86 (44.1) | < 0.001 |
|
Disclosures:
Pranusha Atuluru, BS1, Malika Elmengad, 1, Leo S. Kleyman, BS2, Sirisha Gaddipati, MD3, Sanjana Rao, MD1, Patricia Jones, MD, MSCR2. A0466 - Differences in Prevalence and Treatment of Hepatitis B Virus Infection in Asian and Black Patients, ACG 2022 Annual Scientific Meeting Abstracts. Charlotte, NC: American College of Gastroenterology.
