Poster Session A - Sunday Afternoon
Category: IBD
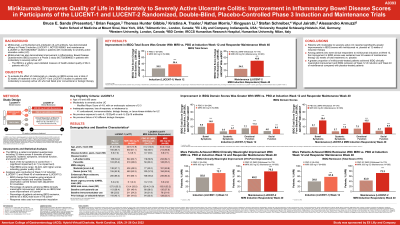
A0393 - Mirikizumab Improves Quality of Life in Moderately-to-Severely Active UC: Improvement in IBDQ Scores in Participants of LUCENT-1 and LUCENT-2 Randomized, Double-Blind, Placebo-Controlled Phase 3 Trials


Bruce E. Sands, MD, MS, FACG
Icahn School of Medicine at Mount Sinai
New York, NY
Presenting Author(s)
1Icahn School of Medicine at Mount Sinai, New York, NY; 2Alimentiv Inc., London, ON, Canada; 3Eli Lilly and Company, Indianapolis, IN; 4University Hospital Schleswig-Holstein, Kiel University, Kiel, Schleswig-Holstein, Germany; 5Western University, London, ON, Canada; 6Humanitas Research Hospital, Rozzano, Lombardia, Italy
Introduction: The Inflammatory Bowel Disease Questionnaire (IBDQ) is a measure of health‑related quality of life (QoL). This analysis evaluated effect of mirikizumab (miri) vs placebo (PBO) on IBDQ scores in patients (pts) with moderately-to-severely active ulcerative colitis (UC) who had failed prior conventional or biologic therapy in a Phase 3, double-blind, 12-week (W) induction study (LUCENT-1) followed by a 40W maintenance study (LUCENT-2) for a total of 52W continuous therapy.
Methods: Pts (N=1162) in LUCENT-1 were randomized 3:1 to receive 300mg miri or PBO intravenously once every four weeks (Q4W). 544 pts who achieved Modified Mayo Score Clinical Response to miri by W12 of induction were rerandomized 2:1 in LUCENT-2 to subcutaneous miri 200mg or PBO Q4W in maintenance period. Randomization was stratified by previous biologic therapy failure, baseline corticosteroid use, and region. LUCENT-1 stratification included baseline (BL) disease activity, and LUCENT-2 included LUCENT-1 clinical remission status. The least squares mean change from BL in IBDQ scores at W12 of induction and W40 of maintenance was determined using analysis of covariance models. BL was W0 of therapy and stratification factors and BL scores were used as covariates. The Minimal Clinically Important Difference (MCID) was defined as an improvement of ≥16 points in total IBDQ score (IBDQ response) and IBDQ remission as a total score ≥170 points. IBDQ response and remission were calculated using non-responder imputations. Treatments were compared using the common risk difference (risk diff).
Results: Miri treatment resulted in significantly greater improvement from BL in IBDQ total and domain scores vs PBO at both W12 of induction and W40 of maintenance (52W treatment) (Table). The proportions of pts who achieved an IBDQ response was significantly greater for miri treated pts vs PBO at W12 (risk diff =17.1[95%CI:10.7, 23.5]) and W40 (29.5 [21.0, 37.9]). Significantly greater proportions of pts receiving miri achieved IBDQ remission at W12 (18.1 [11.8, 24.4]) and W40 (28.5 [20.1, 37.0]) vs PBO (all evaluations and timepoints: p< 0.001).
Discussion: Pts reported significantly greater improvements in IBDQ scores at induction and maintenance with miri compared to PBO. Over 75% of pts achieved a clinically meaningful improvement in QoL, as measured by IBDQ response, at the end of the 52 weeks of miri treatment.
| IBDQ Total Score1 | IBDQ Response2
| IBDQ Remission2
| |||
LSM Change from BL (SE) | LSM Diff (SE) | n (%) | Risk Diff (95% CI) | n (%) | Risk Diff (95% CI) | |
LUCENT-1 Week 12 of Induction | ||||||
PBO IV Q4W (N=294) | 25.21 (1.80) | 164 (55.8) | 117 (39.8) | |||
Miri 300 mg IV Q4W (N=868) | 38.42 (1.11) | 13.21 (2.01)* | 631 (72.7) | 17.1 | 499 (57.5) | 18.1 |
LUCENT-2 Week 40 of Maintenance (52 Weeks of Continuous Therapy) of Miri Induction Responders | ||||||
PBO SC (N=179) | 24.51 (2.77) | 88 (49.2) | 77 (43.0) | |||
Miri 200 mg SC (N=365) | 49.75 (2.10) | 25.24 (3.09)* | 289 (79.2) | 29.5 | 264 (72.3) | 28.5 |
Abbreviations: BL=baseline; CI=confidence interval; Diff=difference; IBDQ=Inflammatory Bowel Disease Questionnaire; IV=intravenous; LSM=least squares mean; Miri=mirikizumab; n=number of patients in the specified category; N=number of patients in the analysis population; PBO=placebo; Q4W=every 4 weeks; Risk Diff=common risk difference; SC=subcutaneous; SE=standard error 1Inflammatory Bowel Disease Questionnaire domains and total scores were evaluated by analysis of covariance with modified baseline observation carried forward and adjustment for covariates. 2Inflammatory Bowel Disease Questionnaire-based measurements for clinical response and remission were analyzed using non-responder imputation. The common risk difference was the stratification-adjusted difference in the proportion of participants receiving mirikizumab minus the proportion of participants receiving placebo. *p< 0.001 | ||||||
Disclosures:
Bruce E. Sands, MD, MS, FACG1, Brian Feagan, 2, Theresa Hunter Gibble, PhD3, Kristina A. Traxler, PharmD3, Nathan Morris, PhD3, Xingyuan Li, PhD3, Stefan Schreiber, MD4, Vipul Jairath, MBChB, DPhil5, Alessandro Armuzzi, MD, PhD6. A0393 - Mirikizumab Improves Quality of Life in Moderately-to-Severely Active UC: Improvement in IBDQ Scores in Participants of LUCENT-1 and LUCENT-2 Randomized, Double-Blind, Placebo-Controlled Phase 3 Trials, ACG 2022 Annual Scientific Meeting Abstracts. Charlotte, NC: American College of Gastroenterology.
